Friday, September 6, 2013

August jobs report: yellow flag for the second month in a row


- by New Deal democrat

The headline for August 2013 employment is that 169,000 jobs were added, and the unemployment rate declined to 7.3%, a new post-recession low and in line with my examination of initial jobless claims yesterday - but keep in mind that the unemployment rate is a lagging indicator. While there were many positives, mainly they simply took back declines from last month. June and July were both revised down, the second month in a row of negative revisions. Negative revisions are not a good sign. We also had a negative number from the very volatile household report, which often turns first.

First, let's look at the more leading numbers in the report which tell us about where the economy is likely to be a few months from now. These were positive or neutral.
  • the average manufacturing workweek increased 0.1 hours from 40.7 hours to 40.8 hours, but is still below where it was 2 months ago. This is one of the 10 components of the LEI and will affect that number positively.

  • construction jobs were unchanged.

  • manufacturing jobs rose for the for the second month in a row, after 4 months of decline, up 14,000.

  • temporary jobs - a leading indicator for jobs overall - increased by 13,100.

  • the number of people unemployed for 5 weeks or less - a better leading indicator than initial jobless claims - was unchanged, and remains about 125,000 off its lows.

Now here are some of the other important coincident indicators filling out our view of where we are now:
  • The average workweek for all workers increased 0.1 to 33.7 hours.

  • Overtime hours increased 0.2 to 3.4 hours, which simply reversed last month's decline.

  • the index of aggregate hours worked in the economy increased 0.4 hours from last month's level of 98.4 to 98.8. This is also a post-recession record.

  • The broad U-6 unemployment rate, that includes discouraged workers declined from 14.0% to 13.7%, also a new post-recession low.

  • The workforce declined 37,000. Part time jobs fell by -334,000. I predict there will be silence from all those Doomers whose metric of part-time jobs since the beginning of this year looks shot to hell.
Other news included:
  • the alternate jobs number contained in the more volatile household survey actually decreased by -115,000 jobs.

  • Government jobs actually increased by 17,000.

  • Combined revisions to the June and July reports totalled a loss of -74,000 jobs, with the reports now showing +172,000 and +104,000 jobs, respectively. Downward revisions are not a good sign, although this is only one month.

  • average hourly earnings increased from $23.98 to $24.05. The YoY change increased from +1.9% to +2.2%, meaning that YoY average real wages have increased again.

  • the employment to population ratio declined back to 58.6%. The labor force participation rate actually declined -0.2% to 63.2%

This was a positive report, and the leading parts of the report were either positive or neutral. That's all good. That aggregate hours increased strongly is probably the best single item in the report. That part time jobs declined substantially means the Doomers will have to find something else to hang their hats on (and, memo to Mish, in a showdown between initial jobless claims and Gallup, go with initial jobless claims). But after industrial production and retail sales stalling last month, I really don't like the continuing downward revisions to past employment reports. And of course there is nothing to like in the continued flatness of the employment to population ratio.

With the recent marked deceleration in the economy as shown by the last three quarters of GDP reports, with the long leading indicators of interest rates and housing turning negative, the ongoing Sequester that was so awful that it was never supposed to happen, and the approaching debt ceiling debate in Congress, this report, while positive for now, and consistent with continued expansion for the rest of this year, maintains the hoisting of a yellow flag for 2014.

Thursday, September 5, 2013

More Evidence of a EU Recovery

From Markit:

The recovery in the eurozone manufacturing sector entered its second month during August. At 51.4, up from a flash reading of 51.3, the seasonally adjusted Markit Eurozone Manufacturing PMI® rose for the fourth successive month to reach its highest level since June 2011.
 

National PMIs improved in all nations bar France, while France and Greece were the only countries to register readings below the 50.0 no-change mark.  The Netherlands topped the PMI league table, followed by Austria and then Ireland.
 

Growth rates for production, new orders and new export business all accelerated to the fastest since May 2011, with back-to-back increases also signalled for each of these variables. Meanwhile, the outlook for output remained on the upside as the new orders-to-inventory ratio hit a 28-month high and backlogs of work rose marginally.

Here are the numbers for the various countries:

Netherlands   53.5   27-month high
Austria           52.0   18-month high
Ireland            52.0   9-month high
Germany        51.8   (flash 52.0) 25-month high
Italy                51.3   27-month high
Spain              51.1 29-month high
France            49.7 (flash 49.7) Unchanged
Greece            48.7 44-month high

With the exception of France and Greece, all of the above numbers are showing an expansion.

Finally, here is a chart of the readings over a time scale:


Note that all of the respective indexes are rising (some very strongly).

While we're here, let's take a look at the EU Leading and Coincident Indicators.


First note that the leading indicators (in green) are increasing while the coincident indicators (in red) are decreasing.  However, the second table shows that the rate of decline in the coincident numbers is declining while the rate of increase in the leading indicators is staying fairly steady.


The reason for the continued strong increase in the leading indicators is their large monetary component.  Yield spread accounts for 20% while money supply accounts for 37% of the total index.

At the same time, the number of employees accounts for 74% of the coincident indicators, which explains their weak performance.

Let's place this information in context by looking at the euro:


The weekly chart shows the euro follows the ISM readings in a general way.  As the ISM numbers declined in 2011 so did the euro, falling (from peak to trough) from 148 to 119, or a decline of about 19%.  Since hitting the low, the euro has rebounded, rallying to the 50% Fib retracement of the 2Q11-3Q12 sell-off.  The mid 125's are now offering general technical support.


Vehicle sales achieve pre-recession normal range


- by New Deal democrat

With yesterday's report that August vehicle sales totalled 16.1 million on an annualized basis, we have finally returned to a normal, expansionary range.

The below graph of vehicle sales for the last 20 years subtracts 16 million so that any number below it records as a negative:


Before 1998, with the exception of a few months in the late 1980's, vehicle sales never crossed the 16 million mark. From then until the end of 2007, the normal range was 16 to 18 million. We have now finally returned to that range.

This is true of more and more aspects of the economy as a whole - GDP, sales, income, and initial jobless claims are already there. Industrial production (slightly) and more importantly jobs and wage growth continue to lag behind.

Initial jobless claims continue improving trend, suggest further decline in unemployment rate


- by New Deal democrat

Initial jobless claims continue to be in a normal expansionary range, at 323,000. For the first time, the 4 week average also declined below 330,000.

This year has repeated the pattern of the 3 prior years, where in late March or April the decline in claims would stall (shown in red), and then declines would resume in late August or September:


Further, initial claims have a good record of predicting changes in the unemployment rate. For longer periods of time, I prefer adjusting initial claims by population, but this graph of the last 10 years shows the relationship of initial jobless claims (blue, left scale) and the unemployment rate (red, right scale) pretty well:


Here's a close-up since the end of the recession:


Based on initial claims, I expect the unemployment rate to decline to a new post-recession low, if not tomorrow then next month. The same applies to the broader U-6 unemployment rate that includes discouraged workers, since both measures tend to move in tandem.

Brazil Prints Stronger Than Expected GDP Number; Is New Growth Around the Corner?

While Brazil was once the darling of the investment community for its fast rates of growth, it has struggled over the least few quarters.  There are several reasons for this slowdown, with the largest fact the slowdown in China's growth.  As China's raw material consumption has dropped, exporters such as Brazil have seen trade revenue fall.  In addition, Brazil has structural issues such as weak domestic infrastructure investment, a wide income stratification and a difficult to navigate political system.

As a result, the government recently increased stimulus and cut payroll taxes in an effort to nudge growth faster, resulting in the recent GDP print that came in stronger than expected: 

Here is the primary text from the Brazil's GDP release:

In the comparison with the first quarter of 2013, the GDP (Gross Domestic Product) at market prices in the second quarter grew 1.5% in the seasonally adjusted series. The highlight was agriculture (growth of 3.9% in volume of value added), followed by industry (2.0%) and services (0.8%). In the comparison with the second quarter of 2012, the GDP grew 3.3%. The highlight was also agriculture (13.0%), followed by industry (2.8%) and services (2.4%).
In the cumulative index in the four quarters ended in the second quarter of 2013 (12 months), the growth was of 1.9% over the immediately previous four quarters. In the first semester, the GDP expanded 2.6% against the same period of 2012. The GDP at current values reached R$ 1.2 trillion in the second quarter.


And here are the highlights from Bloomberg:

Brazil’s economy expanded more than forecast by all analysts in the second quarter, as government stimulus propped up investment and a weaker real boosted the outlook for manufacturing. 

Gross domestic product expanded 1.5 percent during the April to June period, or an annualized 6 percent, the national statistics agency said today. That was the most since the first quarter of 2010 and more than all 44 forecasts from analysts surveyed by Bloomberg, whose median estimate was 0.9 percent. GDP expanded 3.3 percent from the same quarter last year. 

....

Today’s GDP data beat analysts’ median forecast for the first time since the last quarter of 2011. Investment, which declined last year as Brazil expanded at a quarter of the 3.5 percent pace of the global economy, continued to recover, jumping 3.6 percent in the second quarter. Despite the rebound, Brazil still has one of the lowest investment rates of major emerging markets at 18.6 percent of GDP.  

As the chart below shows, GDP growth has been picking up for the last four quarters:


At the same time, the new Markit numbers are not encouraging.  First,

August’s seasonally adjusted HSBC Brazil Purchasing Managers’ Index™ (PMI™) rose from 48.5 in July to 49.4, indicating a further, albeit slower, deterioration of operating conditions across the country.
 

Output in the Brazilian manufacturing sector fell for the second successive month in August, amid evidence of lower volumes of incoming new work. That said, the rate of contraction eased to a marginal pace. Decreases were recorded in both the investment and intermediate goods sectors, while consumer goods producers continued to signal growth.
 

Lower levels of new orders have now been recorded for two consecutive months, with the latest survey pointing to a marginal and slower pace of contraction. Those panel members indicating falling volumes of incoming new work reasoned that this was due to weaker demand and increased competition from Chinese manufacturers. Order book volumes fell at both intermediate and capital goods producers, while manufacturers of consumer goods signalled growth. Export business fell again in August, in part reflecting weaker demand from Argentinian and European clients. Meanwhile, purchasing activity contracted slightly in August.

As the chart shows, the trend is clearly lower:


At 49.7 in August, up slightly from 49.6 in the previous month, the seasonally adjusted HSBC Brazil Composite Output Index posted below the 50.0 no-change level for the second successive month. Business activity fell marginally across both the manufacturing and the service sectors, with firms commenting on tough
economic conditions and subdued underlying demand.
 
August’s seasonally adjusted Services Business Activity Index dipped below the 50.0 no-change level for the first time in 12 months. Down from 50.3 in July to 49.7, the latest index reading was consistent with a marginal contraction of output levels across the country’s service sector. Among the six monitored sub-sectors, Post & Telecommunication registered the sharpest decline.

Like manufacturing, these numbers are also in a downtrend:


Let's take a look at the Brazilian ETF:


There are three key points to make about the Brazilian ETF.  First, over the last year we see declining momentum, as evidenced by the continually lower peaks in the MACD.  Secondly, prices broke long-term technical support between 47 and 48 in June.  Third, prices are currently consolidating between the 41 and 45 price area.


Wednesday, September 4, 2013

Balance Sheet Recession About Over

Because of the weak nature of this recovery, there is ample statistical ammunition for both the bullish and bearish economists to make their case.  The bears can point to overall consistently weak GDP growth, still high unemployment and weak wage growth.  In contrast, the bulls can point to strong auto purchases, rising home sales, an accommodating Fed and strong stock market.  Neither side has sufficient data on their side to rhetorically put the other side away, as it were.

Last week, I made the argument that we may be closer to a recession than previously thought.  I noted that industrial production and capacity utilization have stalled over the last nine months, along with recent weak readings from durable goods and new home sales.  At the same time, a bullish argument can still be made, as highlighted be several recent well-written articles that also appeared last week.  Bill McBride over at Calculated Risk made the following points:

It still appears economic growth will pickup over the next few years. With a combination of growth in the key housing sector, a significant amount of household deleveraging behind us, the end of the drag from state and local government layoffs (four years of austerity mostly over), some loosening of household credit, and the Fed staying accommodative (even if the Fed starts to taper, the Fed will remain accommodative).    

He also makes this very salient point for the long term (frankly, the rest of my natural born life):


And in the longer term, I remain very optimistic too. I mentioned a few long term risks in my January post, but I also mentioned that I wasn't as concerned as many others about the aging of the population. By 2020, eight of the top ten largest cohorts (five year age groups) will be under 40, and by 2030 the top 11 cohorts are the youngest 11 cohorts. The renewing of America was one of the key points I made when I posted the following animation of the U.S population by age, from 1900 through 2060. The population data and estimates are from the Census Bureau (actual through 2010 and projections through 2060). 

Working age population growth is the lifeblood of any economy.  The influx of new, working age people means they will have to find a job (or start a business) to support themselves.  So long as the economy remains open and accommodating (which it will despite the overheated political rhetoric there is a very strong chance the economy will continue growing.

Bloomberg also published as article last week with a bullish outlook.  It mentioned the following:

The signs of resilience are everywhere: Households continue to spend. Businesses are investing and hiring. Home sales are rebounding, and the automobile industry is surging. Banks have healthier balance sheets, and credit is easing. All this coincides with the economy shedding the excesses of the past, such as unmanageable levels of consumer and corporate debt. 

Both Calculated Risk and Bloomberg point to to very key development: the cleaning up of our respective balance sheets.  What started this recession was a massive build-up of debt in the system, largely related to the housing bubble.  When the bubble burst, people had to sell the asset(s) underlying their debt, usually at a loss.  As this process continued for a few years, people had to either declare bankruptcy and/or pay off their debt from existing earnings.  This meant they had less money to spend on other items, meaning there was overall less economic demand, culminating in weak overall growth.

Here are some charts of the underlying data:


Total household and non-profit debt, according to the Federal Reserve's Flow of Funds report, has been dropping since a little bit before the recession began.


The IMF provided the data for this chart, which shows that total household debt has been declining as a percentage of GDP since mid-way through the last recession.


And finally, household obligations as a percent of disposable personal income are at very low historical levels.

And there is the continued good news from the banking sector, as reported in the latest quarterly banking profile from the FDIC:

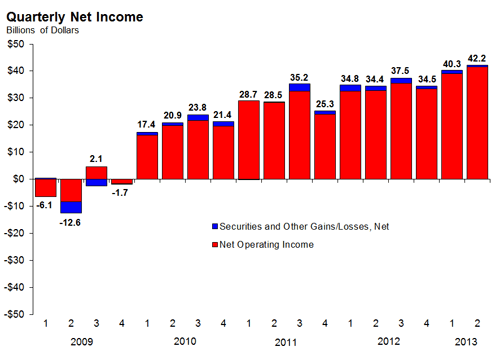
Rising noninterest income and falling loan loss expenses continued to lift bank earnings in the second quarter. FDIC-insured institutions reported net income of $42.2 billion, an increase of $7.8 billion (22.6 percent) compared with second quarter 2012 when industry earnings were reduced by losses on credit derivatives. This is the 16th consecutive quarter that earnings have registered a year-over-year increase. For a second consecutive quarter, industry earnings reached a new nominal high. However, the quarterly return on assets (ROA) of 1.17 percent, while up from 0.99 percent a year ago, remained below the 1.27 percent average for the industry from 2000 through 2006. More than half of all banks—53.8 percent—reported higher quarterly net income than a year ago, and only 8.2 percent reported negative net income. This is the lowest proportion of unprofitable institutions since third quarter 2006.  

.....

Loan Losses Fall to Lowest Level Since 2007

Net loan and lease charge-offs totaled $14.2 billion, a $6.3 billion (30.7 percent) year-over-year decline. This is the smallest quarterly total since third quarter 2007. While charge-offs were down across all major loan categories, the overall decline was led by residential real estate loans. Charge-offs of home equity lines of credit were $1.1 billion (41.7 percent) below the level of a year ago, while charge-offs of other loans secured by 1-to-4 family residential properties were $1.4 billion (32.1 percent) lower. Smaller reductions occurred in charge-offs of real estate construction and land loans (down $772 million, or 67 percent), real estate loans secured by nonfarm nonresidential properties (down $775 million, or 52.5 percent), commercial and industrial loans (down $760 million, or 37.3 percent), and credit cards (down $748 million, or 11 percent).


Noncurrent Loans Post Thirteenth Consecutive Quarterly Decline
 
Noncurrent loan levels also showed improvement across all major loan categories. The amount of loans and leases that were 90 days or more past due or in nonaccrual status fell by $21.7 billion (8.3 percent) during the second quarter, marking the 13th consecutive quarter that noncurrent balances have declined. Noncurrent first lien mortgage loans declined by $13.3 billion (8.2 percent), while noncurrent real estate construction and land loans dropped by $2.8 billion (19.1 percent), and noncurrent real estate loans secured by nonfarm nonresidential properties fell by $2.5 billion (8.8 percent). During the quarter, the percentage of total loans and leases that were noncurrent declined from 3.41 percent to 3.09 percent, the lowest level since fourth quarter 2008.


Here are some charts of the data:


Put in economic terms, the above charts show the "balance sheet" recession is close to ending.


More on demographics and median income


- by New Deal democrat

Lest you think your blogger is the only one who has figured out that "median household income" is largely a proxy for the employment to population ratio, and is heavily influenced by demographics and retirement, consider Cornell University economist Richard Burkhauser's report that the 'Average American' will slide down income scale:
Changes in demographics over the next two decades will make it even more difficult to raise the median, according to a Cornell economist.

....
The most important contribution to declining income over the past decade, and particularly during the Great Recession and its aftermath, was the large number of unemployed men, they found. But looking ahead, they predicted that over the next two decades demographic shifts will be an important factor pulling the median down.

In the 1990s and 2000s the Baby Boom generation, maturing into their peak earning years, helped to boost the median income. But as they retire over the next two decades their household incomes will fall sharply.
And he makes use of this handly graph showing how median income changes by age:

Median household income is likely to continue to trend lower for the next 15 years, purely as a matter of demographics, as the Baby Boom generation retires. In order to get a better look at working-age households only, and do away with the effect of retirements, we need to look at median household income from ages 25-54 or 25-64. The Census Bureau does this calculation, but only on a yearly basis, and the most current statistics (at table H-10) are from 2011. The series should be updated for 2012 later this month.

More On the ISM/GDP Relationship

Yesterday, NDD noted that the strong ISM reading was a very good sign for the economy, going so far as to note, "This morning's unexpectedly strong ISM report appears to put to rest any worry about any imminent economic downturn."

In correlation to his comments, consider the following two charts.


I've got the ISM new orders number (left scale in blue) and the year over year percentage change in GDP (right scale in red) on the chart above.  While the correlation used to be a bit stronger (see the very tight relationship in the 1970s) there is still a good correlation between the numbers.

The reason is actually pretty straight forward.  When market participants think the economy will pick up, they order more things like equipment to produce goods and things to sell.  Hence, the pick-up in new orders and its inclusion in the Conference Board's leading indicators series.


Above is a scatter plot of the ISM readings and the percentage change in GDP readings.  I've had to convert the ISM readings to a quarterly number (using an average of the three months).  This means the comparison is a bit weaker, but I believe it still makes the primary point: an ISM reading above 60 almost always correlates with positive year over year GDP growth.

Yen Continues Consolidation


The yen dropped sharply after Abe announced that yen devaluation was part of this three part plan to return Japan to a period of growth.  From peak to trough, the yen lost about 27%.  However, for the last few months the yen has been consolidating losses around the 38.2% Fib level of the 07-11 rally.

The real test for Abe will come when the yen breaks this pattern.  Ideally, we'd like to see prices trade sideways.

Tuesday, September 3, 2013

Surprisingly strong ISM manufacturing


- by New Deal democrat

This morning's unexpectedly strong ISM report appears to put to rest any worry about any imminent economic downturn.

Below is a graph of the New Orders Index, which is one of the 10 elements of the LEI, covering the last 30 years. The red line is drawn at the 60 level. I've subtracted 60 from the index, so that any positive number coincides with a reading above 60, and any negative number coincides with a reading below 60:


This morning's reading of 63.2 is the strongest in over 2 years. Only 28 months in the last 30 years (360 months) have been stronger.

India Prints Weak GDP Number, Adding Further Downward Pressure To Indian Markets

From the FT:

India’s economy slowed sharply in the three months to June piling further pressure on Prime Minister Manmohan Singh’s crisis-hit administration, as it struggles to find ways to support its plunging currency and reassure increasingly anxious foreign investors about its future growth. 
Asia’s third-largest economy expanded by just 4.4 per cent compared with the same period in the previous year, from 4.8 per cent in the preceding three months. The figure was well below expectations and its worst performance since 2009, raising fresh doubts about government assurances that growth would pick up again later this year. 

All see this from Bloomberg and Reuters. 

However, India's real problem is that its growth model is no longer competitive, meaning the country must reallocate labor:

Structural problems were inherent in India’s unusual model of economic development, which relied on a limited pool of skilled labor rather than an abundant supply of cheap, unskilled, semiliterate labor. This meant that India specialized in call centers, writing software for European companies and providing back-office services for American health insurers and law firms and the like, rather than in a manufacturing model. Other economies that have developed successfully — Taiwan, Singapore, South Korea and China — relied in their early years on manufacturing, which provided more jobs for the poor.

Two decades of double-digit growth in pay for skilled labor have caused wages to rise and have chipped away at India’s competitive advantage. Countries like the Philippines have emerged as attractive alternatives for outsourcing. India’s higher-education system is not generating enough talent to meet the demand for higher skills. Worst of all, India is failing to make full use of the estimated one million low-skilled workers who enter the job market every month.

Manufacturing requires transparent rules and reliable infrastructure. India is deficient in both. High-profile scandals over the allocation of mobile broadband spectrum, coal and land have undermined confidence in the government. If land cannot be easily acquired and coal supplies easily guaranteed, the private sector will shy away from investing in the power grid. Irregular electricity holds back investments in factories. 

India’s panoply of regulations, including inflexible labor laws, discourages companies from expanding. As they grow, large Indian businesses prefer to substitute machines for unskilled labor. During China’s three-decade boom (1978-2010), manufacturing accounted for about 34 percent of China’s economy. In India, this number peaked at 17 percent in 1995 and is now around 14 percent.

Let's take a look at the Indian ETF:


Indian prices are near their lowest level in over 1 1/2 years.  Prices started dropping hard in early May, falling through the 200 day EMA.  Since then, we've seen two attempted rallies that fell short.  Prices moved through the 45-46 level (a key technical support area) earlier this month.

The underlying technicals for this chart are very bearish.  Prices have dragged the shorter EMAs below the 200 day EMA, the MACD is negative and declining, the CMF is negative and volatility is increasing. 


US Economic/Market Analysis

Let's start by looking at last week's economic numbers.

The Good

Texas manufacturing is still expanding, although at a slower rate.  Production, new orders and shipments all printed lower numbers, although all are still positive.

The Case-Shiller home price index continues to show gains:

Data through June 2013, released today by S&P Dow Jones Indices for its S&P/Case-Shiller1 Home Price Indices, the leading measure of U.S. home prices, showed that prices continue to increase. The National Index grew 7.1% in the second quarter and 10.1% over the last four quarters. The 10-City and 20-City Composites posted returns of 2.2% for June and 11.9% and 12.1% over 12 months.

These numbers indicate the housing recovery is still on track.  However, I would expect this number to start slowing over the next 4-6 months.  The latest readings are from the end of June, meaning they probably don't reflect the increase in interest rates that we've been seeing over the summer.

The Richmond Fed's manufacturing number jumped sharply, rising 25 points to a reading of 14.  This index has been stuck in the doldrums for a number of months, so this reading is very encouraging. 

The BEA revised the 2Q GDP up to 2.5%.  This was by far the biggest and most important economic number released last week.  While we would love for growth to be stronger, any upward revision is welcome.  NDD and I covered this report here.

The Chicago PMI increased to 53.
 
The Neutral

From the BEA:

Personal income increased $14.1 billion, or 0.1 percent, and disposable personal income (DPI) increased $21.7 billion, or 0.2 percent, in July, according to the Bureau of Economic Analysis. Personal consumption expenditures (PCE) increased $16.3 billion, or 0.1 percent. In June, personal income increased $38.2 billion, or 0.3 percent, DPI increased $27.3 billion, or 0.2 percent, and PCE increased $64.0 billion, or 0.6 percent, based on revised estimates.

.....

Real DPI -- DPI adjusted to remove price changes -- increased 0.1 percent in July, in contrast to a decrease of 0.2 percent in June. 

Real PCE -- PCE adjusted to remove price changes -- increased less than 0.1 percent in July, compared with an increase of 0.2 percent in June. Purchases of durable goods increased 0.1 percent, compared with an increase of 0.9 percent. Purchases of nondurable goods increased 0.5 percent, compared with an increase of 0.1 percent. Purchases of services decreased 0.1 percent, in contrast to an increase of less than 0.1 percent.

I'm placing the DPI and PCE numbers in the neutral category because of the very weak growth in these key metrics.  While I'd expect weak wage growth in a period of 7%+ unemployment, it also means there is less money available for PCEs, which are vital for the economy to continue moving forward. 

Consumer sentiment slipped a bit:


U.S. consumer sentiment retreated in August from last month's six-year high, though Americans were slightly more upbeat in their outlook than earlier in the month, a survey released on Friday showed.
 
The Thomson Reuters/University of Michigan's final reading on the overall index on consumer sentiment slipped to 82.1 in August from 85.1 in July. 
The Bad

Durable goods orders dropped 7.3%, or .6% (-.6%) ex-transportation.  Even though this was only one month's worth of data, this number was a bit concerning.    

Conclusion

The best news last week was the upward revision of 2Q GDP, which is always a welcome development.  Housing is also still on track, although the Case Shiller composite was for readings through June, so I'd expect some weakness to start in the next 4-6 months.  The manufacturing numbers were mixed, as three regional surveys printed positive numbers, but these are contrasted with a nasty durable goods orders print.  Consumer readings were at best just barely positive, but that's been the case throughout this expansion.

Let's turn to the markets.


Both the 60 minute (top chart) and daily (bottom chart) charts of the SPYs show a very disciplined sell off.  Two weeks ago, prices gapped lower but used the 61.8% Fib level for technical support.  Last week, prices again gapped lower, this time using the 50% Fib level for technical support.  Both charts show declining momentum as well.  Overall, prices have only dropped a little over 4%, so this is hardly a correction to be overly worried about (at least no yet).

Also of importance on the daily chart is the fact the SPYs broke their upward trend in June, indicating that we are now trading in a sideways trading pattern.


The treasury market consolidated between the 100 and 102. levels from late June to mid-August.  After dropping through support, prices rallied back to resistance at 100.  Overall, the chart is still negative with the shorter EMAs still in a negative orientation.  

Monday, September 2, 2013

Sunday, September 1, 2013

Weekly Indicators: Labor (consumers) spends, corporations profit edition


 - by New Deal democrat

In the rear view mirror, second quarter GDP was revised upward. Corporate profits hit a new record. July monthly data included personal income and spending, both up slightly and flat in real, inflation-adjusted terms. The savings rate was also unchanged. Chicago area manufacturing improved slightly. Home price increases accelerated. Consumer confidence increased in August, but the two reporting series conflicted as to whether expecations were improved or declining.

This week's edition of the high frequency weekly indicators has been delayed a bit, due to a little holiday vacation enjoyment. Here they are:

Steel production from the American Iron and Steel Institute
  • -0.9% w/w

  • -1.9% YoY

Steel production over the last several years has been, and appears to still be, in a decelerating uptrend. Obviously there is some noise in the weekly numbers. It has been negative YoY for the last 3 weeks.

Employment metrics

Initial jobless claims
  • 331,000 down -2,000

  • 4 week average 331,2500 up +750

The American Staffing Association Index gained +1 to 97. It is up +4.4% YoY

Tax Withholding
  • $145.7 B for the first 21 days of August vs. $135.3 B last year, up +10.4 B or +7.7%

  • $130.8 B for the last 20 reporting days vs. $1116.8 B last year, up +14.0 B or +12.0%

Initial claims remain firmly in a normal expansionary mode. Like each of the last three years that this same, a good, downside breakout has occurred.

Temporary staffing had been flat to negative YoY for a few months, but has now also broken out positively. Tax withholding is back within its normal range for most of this year, although towards the weak end.

Consumer spending Gallup's 14 day average of consumer spending steadied this week after plummetting last week. The ICSC varied between +1.5% and +4.5% YoY in 2012, while Johnson Redbook was generally below +3%. The ICSC was weak, but Johnson Redbook remains at the high end of its range.

Oil prices and usage
  • Oil up +1.23 to $107.65 w/w

  • Gas unchanged at $3.55 w/w

  • Usage 4 week average YoY up +1.0%
The price of Oil retreated but remained near its 52 week high. The 4 week average for gas usage was, for the eighth week in a row after a long streak to the contrary, up YoY.

Interest rates and credit spreads
  • 5.55% BAA corporate bonds up +0.11%

  • 2.86% 10 year treasury bonds up +0.13%

  • 2.69% credit spread between corporates and treasuries down -0.02%
Interest rates for corporate bonds had been falling since being just above 6% in January 2011, hitting a low of 4.46% in November 2012. Treasuries previously were at a 2.4% high in late 2011, falling to a low of 1.47% in July 2012, and have decisively risen more than 1% above that mark. Spreads remain slightly above their recent new 52 week low this week. Their recent high was over 3.4% in June 2011.

Housing metrics

Mortgage applications from the Mortgage Bankers Association:
  • +2% w/w purchase applications

  • +6% YoY purchase applications

  • -5% w/w refinance applications
Refinancing applications have decreased sharply in the last 4 months due to higher interest rates, declining by more than 50% in total, and are now just about as bad as they have been at any point in the last 7 years. Purchase applications have also declined from their multiyear highs in April, but are still slightly up YoY.

Housing prices
  • YoY this week +10.7%
Housing prices bottomed at the end of November 2011 on Housing Tracker, and averaged an increase of +2.0% to +2.5% YoY during 2012. This weeks's YoY increase is yet another 7 year record.

Real estate loans, from the FRB H8 report:
  • up +14 or +0.4% w/w

  • up +0.4% YoY

  • +1.5% from its bottom
Loans turned up at the end of 2011 and averaged about 1% gains YoY through most of 2012.  Over the last few months, the comparisons have completely stalled.

Money supply

M1
  • -0.1% w/w

  • -0.8% m/m

  • +6.7% YoY Real M1

M2
  • -0.2% w/w

  • +0.4% m/m

  • +4.7% YoY Real M2
Real M1 made a YoY high of about 20% in January 2012 and eased off thereafter. Earlier this year it increased again but this week made a new 2 year low (although it is still positive).  Real M2 also made a YoY high of about 10.5% in January 2012.  Its subsequent low was 4.5% in August 2012. It increased slightly in the first few months of this year and has generally stabilized since, although it has declined slightly in the past several months.

Transport

Railroad transport from the AAR
  • -5000 carloads down -1.7% YoY

  • +300 carloads or +0.2% ex-coal

  • +7700 or +3.5% intermodal units

  • +3800 or +0.7% YoY total loads
Shipping transport Rail transport has been both positive and negative YoY in the last several months. This week was the third positive week in a row since then. The Harpex index had been improving slowly from its January 1 low of 352, but then flattened out for 9 weeks before tying its new 52 week high again this week. The Baltic Dry Index has rebounded to close to its recent 52 week high. In the larger picture, both the Baltic Dry Index and the Harpex declined sharply since the onset of the recession, and have been in a range near their bottom for about 2 years, but stopped falling earlier this year, and now seem to be in a slight uptrend.

Bank lending rates The TED spread is still near the low end of its 3 year range, although it has risen slightly in the last couple of months.  LIBOR established yet another new 3 year low.

JoC ECRI Commodity prices
  • down -0.49 to 124.04 w/w

  • +2.86 YoY

The paradigm for the last several months remained intact this past week. Negatives included a further increase in interest rates, a decrease in mortgage refinancing, and the still elevated price of Oil. Steel production was also a negative, as were commodity prices. Purchase mortgages and real estate loans were slightly positive, as were tax withholding payments. Money supply also weakened a little bit, although it is still positive.

Positives included consumer spending, temporary staffing, jobless claims, gas usage, bank rates, interest rate spreads, both rail and shipping transportation, and house prices.

So the story remains that several of the long leading indicators - interest rates and housing - are problematic, while two others - corporate profits and money supply - are still trending up. Shorter leading indicators also remain generally positive. Have a nice long holiday weekend.

Friday, August 30, 2013

Weekend Weimar, Beagle and Pit Bull

Grill cleaning time:


I'll be back on Monday; NDD will be here over the weekend.


Australian Economy Continues to "Moderate"

From the latest central bank minutes:

Members noted that the news received on domestic activity over the month was consistent with Australian economic growth being below trend in the June quarter. 

Indicators of household consumption had suggested continued moderate conditions overall. Motor vehicle sales grew in the June quarter, but had fallen in July. Retail sales data showed that spending was flat in real terms in the June quarter and liaison pointed to only modest growth more recently. Consumer sentiment had declined since earlier in the year to be close to average levels. Overall, the softer run of recent indicators of consumption was consistent with the somewhat subdued conditions in the labour market. The unemployment rate rose a bit further in June, to 5.7 per cent, while trend employment growth had declined a little over the past few months. 

Retail sales have been soft the last few months:


And the unemployment rate has been ticking up:


In contrast, conditions in the housing sector had continued to improve. Auction clearance rates remained high and dwelling prices had increased further in recent months. A number of indicators were pointing to a further recovery in dwelling investment, consistent with the low level of interest rates. Residential building approvals, especially for detached housing, had increased in the June quarter and loan approvals were at their highest level in over three years. 

The total number of dwelling unit commitments is increasing 


Members did, nevertheless, note that dwelling investment had thus far experienced a muted recovery relative to past cyclical upturns.
Survey measures of business conditions had remained below average and members noted an apparent reluctance on the part of businesses to take on new risks. Non-mining business investment remained subdued and a range of indicators suggested that this was likely to persist in the near term. Mining investment had been at a high level although it looked set to decline over coming years. Consistent with this, imports of capital goods had declined from the high levels in the previous year. 

Conclusion: overall, this is an economy that is clearly slowing.  There are no signs of a hard landing, but instead continued weak growth.

Let's take a look at the Australian ETF


At the beginning of March, we see a sell-off that takes prices all the way down to the 61.8% Fib level, or a loss of about 20% from peak to trough.  Since then, prices have rebounded, trading between the 61.8% and 38.2% Fib level.  Also note the upward resistance provided by the 200 day EMA, indicating we're probably in a bear market.


But the weekly chart shows the most recent sell-off has not made a significant dent in the long-term trend of the ETF, which is still up.  This tells us that traders (at least so far) see a slowdown and overall economic re-balancing rather than an outright contraction.


The Australian dollar started to drop in April as the Reserve Bank of Australia started to cut rates.  Overall, the currency has fallen about 15% from peak to trough.  Prices have fallen through two key support areas (one an ~94 and the second at ~91) and are now consolidating losses by trading between ~89 and ~93.

Coincident indicators stalled in July


- by New Deal democrat

With the release of personal income and spending this morning, we now have all four primary coincident indicators of the economy through July. With the exception of payrolls, they all stalled, with industrial production, real retail sales, and real personal income coming in at zero (actually, within +/-0.05% of 0%).

Below is a graph of all four of the above coincident indicators for the last year. I have presented it at a scale so that the biggest monthly change of each indicator is set to 1.0 (and I've deleted December and January personal income entirely, which featured an increase and then a decrease of over 5% due to moving income forward into 2012 due to the "fiscal cliff"):


You can see that there has been a distinct tapering off of positive readings in the last three months, and the trend is in decline.

That isn't to say that I expect the decline to continue. If anything, this may be the bottom, if all of the Leading Indices are to be believed. On the other hand, this again shows the negative impact of the Sequester, and certainly suggests that this would be a particularly bad time for fiscal shenanigans in Washington. Of course, that is asking way too much . . . .

Yen Devaluation Starting to Pay Dividends With Increased Exports

Despite having a very weak economy, the yen actually strengthened over the duration of this expansion because of Japan's safe haven status.  In fact, from the yen's ETF's lows in 2008 to its highs in 2011, it gained a little over 32%.  However, since the end of last year and the introduction of "Abenomics" (which includes yen devaluation to increase the competitiveness of Japan's exports) the yen's ETF has dropped almost 26%.  The end result is an increase in exports, as shown in this excerpt from the latest BOJ Central Bank Meeting Minutes:

Exports had been picking up. Real exports had turned upward in the January-March quarter of 2013 and kept increasing in the April-May period relative to that quarter, after having continued to decline in the July-September and October-December quarters of 2012. Exports of motor vehicles and their related goods -- due in part to the effects of developments in foreign exchange rates -- had resumed an uptrend, assisted by a pick-up in those to China -- which had seen a significant drop -- while those to the United States and other regions had been steady. Exports of capital goods and parts as a whole had recently started to bottom out, with upward movements observed in exports to the United States and East Asia, disregarding the fluctuations in ships. Exports of IT-related goods as a whole appeared to be heading for a bottom, with the effects of the downshift in demand for parts for final products of smartphones -- which had taken place since the end of 2012 -- easing. Exports were expected to increase moderately, mainly against the background of the pick-up in overseas economies.

The latest exports release shows a 12% year over year increase.  Here's a chart of total exports from the latest BOJ monthly economic report:


Exports are still weak, as they are in line with the numbers reported over the last 3-4 years.  However, we do see the uptick that is mentioned in the BOJ minutes.


Thursday, August 29, 2013

Brazil Raises Rates 50 Basis Points

From Bloomberg:

Brazil’s central bank raised the key rate by half a percentage point for a third straight meeting, as a plunge in the currency undermines efforts to slow inflation in the world’s second-largest emerging market. 

The bank’s board, led by President Alexandre Tombini, today unanimously voted to raise the benchmark Selic rate to 9 percent from 8.5 percent, as forecast by 50 of 52 economists surveyed by Bloomberg. One economist expected a 75 basis-point increase, while one forecast a 25 basis-point boost.
“The committee considers that this decision will contribute to put inflation on a decline and assure that this trend will persist next year,” policy makers said, according to their statement posted on the central bank’s website. The statement was virtually identical to their July 10 communique. 

The central bank is in a very unenviable spot: growth is slowing but inflation is still at uncomfortable levels.  This indicates that the real's drop and the accompanying rise in inflation is seen as the larger threat to the economy.

For more on Brazil, see links here, here and here.

Consumers Finally Realize CNBC (and Larry Kudlow) Are Worthless

From the New York Post

Tv viewers continued to trade out of CNBC in August.

The business news cable network posted some of its worst ratings in 20 years this month — attracting an average of just 37,000 viewers aged 25 to 54 over a 24-hour period, according to just-released ratings data.

That’s down 35 percent from a year ago, according to Nielsen, and the Comcast-owned network’s worst performance in the key advertiser demo since April 1993.

CNBC hit a peak of 162,000 viewers an hour in the key demo in January 2002. 

.......

Larry Kudlow’s 7 p.m. show fell the most, recording just 20,000 viewers in the key advertiser demographic, a 53 percent decline

I stopped watching CNBC over 10 years ago and haven't missed it.  If I was going to watch financial TV again, it's be Bloomberg.  But, frankly, I'm not really impressed with any financial TV, instead finding the written news to be far more comprehensive.

And I have to admit that Kudlow's fall is more than welcome.  I never could stand the idiot.  It now appears that others have been catching on as well.


Three Four Important Points From Revised 2d Quarter GDP


- by New Deal democrat

The release of revisions to second quarter GDP this morning give us our first look at Gross Domestic Income and Corporate Profits after Taxes.

Gross Domestic Income is important because it is the other side of the ledger of GDP. Theoretically, the two should always be equal, but because they are calculated from separate data, there usually is a discrepancy. But more importantly, if there is a divergence between the two, it is more likely for GDP to move towards GDI than the other way around. This morning we learned that 2nd quarter 2013 GDI was up 2.5% at an annualized rate, compared with +2.4% in the first quarter. Here is the most current graph through the first quarter:


Although this hardly shows strong growth, it also confirms that the economy is still growing, and unlike the initial GDP estimate (also revised upward to +2.5%), it does not show any sign of stalling over the last three quarters.

This morning's release also included corporate profits after taxes and inventory adjustments. This is a long leading indicator. It tends to peak at least a year before the onset of any recession. Although profits declined slightly in the first quarter, as shown in the graph below:


they rebounded strongly in the second quarter to a new record of $1863 billion. Of course, while that may negative recession, it also does nothing to address the glaring inequality between capital and labor's share of income in this country.

The final point is that, while it is welcome that 2nd quarter GDP was revised higher, once again state and federal contributions to GDP were revised lower, and both were outright negative. Federal spending subtracted -1.6% in the second quarter while state and local spending decreased -0.5%. The total subtraction from all government expenditioures was -0.9%. Sequestration and austerity are having a real and negative impact on the economy.

Bonddad here:

Consider the following chart, culled from the latest GDP report, that shows the percentage change in exports from the previous quarter:


I've drawn an arrow about the latest quarters numbers. Total exports increase 8.6%; shipment of goods increase 10.1% -- the strongest jump since 4Q210.  And the export of services increase 5.2%.  The increase in exports were a primary reason for the upward revision in US GDP:

The acceleration in real GDP in the second quarter primarily reflected upturns in exports and in nonresidential fixed investment and a smaller decrease in federal government spending that were partly offset by an acceleration in imports and decelerations in private inventory investment and in PCE.

Recent Census data shows there was a drop in exports at the beginning of the 2Q, but that most categories of exports have increased since April:


A Long-Term View of the Japanese ETF


The are two points I wanted to make about this chart:

1.) We see the Abenomics rally that started in 4Q12 and extended to 2Q13.  Prices rallied about 44%.

2.) Since the rally prices have been consolidating in a symmetrical triangle pattern.  This is to be expected after such a strong move as traders take profits and assess the effectiveness of the new programs.

Wednesday, August 28, 2013

Will Emerging Market's Sliding Currency Become an International Crisis?

Over the last few months, India's problems have come home to roost.  Their growth has dropped as the result of a bloated domestic government and rather draconian foreign investment rules.  Their current account relative to GDP is large with little sign of getting smaller and inflation is still at uncomfortable levels, thereby boxing in the central bank.  For more information, see here and here.

And the currency continues to slide:


India’s battered rupee was on track for its worst one-day fall in more than two decades on Wednesday, plunging 3.4 per cent in morning trading to breach Rs68 to the US dollar for the first time in a downbeat reaction to a government plan to rescue the floundering economy. 
Palaniappan Chidambaram, finance minister, on Tuesday outlined a 10-point scheme to reduce the nation’s current account deficit and restore economic growth, responding to another day of sharp stock market losses and currency decline. 

Here's a chart of the rupee ETF that shows two recent breaks of support (see the blue arrow):


Also note the weak momentum and volume reading and very bearish EMA orientation.

And India is not alone in it's problems.  The latest news out of Brazil is not encouraging.

First, we see the manufacturing sector's reading fell below 50, indicating a contraction:

Reflective of lower foreign business and total new orders, Brazilian manufacturers reduced their output in July. Subsequently, the PMI fell to a 13-month low, and indicated that the country’s manufacturing economy
deteriorated for the first time since September 2012.  Meanwhile, the depreciation of the real reportedly resulted in higher prices paid for inputs, with the rate of cost inflation accelerating to the fastest in over three years and charge inflation picking up to the sharpest in five years.
 

The seasonally adjusted HSBC Brazil Purchasing Managers’ Index™ (PMI™) fell to its lowest reading in 13 months, posting 48.5 in July, down from 50.4 in the previous month. The latest reading indicated the first deterioration in manufacturing operating conditions across the country since September 2012. Four of the five PMI sub-indices negatively affected the

Here's a chart of the data:


The service sector output continues to fall, although it is currently on this side of an expansion:

The seasonally adjusted Services Business Activity Index fell from 51.0 in June to 50.3 in July. The latest reading was indicative of a marginal increase in
services output, and the joint-weakest in the current 11-month expansionary sequence. Slower rises in business activity were linked by panellists to weaker
gains in new work, an increasingly fragile economy and national protests.


And the country continues to have currency problems, which I first noted last week.   In fact, their central banker had to forgo an appearance at the Fed's Jackson Hole retreat in order to implement a currency plan:

But with Brazil’s currency, the real, sinking rapidly against the dollar, he chose to stay at home, and on Thursday night launched one of the world’s most ambitious responses yet to the present market volatility – a $60bn currency intervention programme.

Let's take a look at the Brazilian real ETF:


The real has been dropping all summer.  It fell through two key support levels in mid-June and again in mid-August (see blue arrows).  Momentum has been weak for three months, the volume flow has been negative, volatility is high and the moving average picture is very weak.


Here's a chart comparing Brazil's currency ETF with India's; both show a similar recent slide.


Fundamental And Technical Events Leading To Potential Oil Price Spike

Consider the daily and weekly charts of oil:


Prices were consolidating between 104 and 108.  Now they have broken through upside resistance at the 108 by printing a very strong bar.  Also note the declining momentum reading may act as a wound coil, giving prices strong upside rallying potential.


On the weekly chart, we see rising momentum and rising volume inflow along with a technical break through resistance.

More succinctly: the daily and weekly charts are lining up for a potential bullish run in oil prices.

And now we have two fundamental events adding fuel to the fire.  The first is the Syrian situation.  The US is considering limited military strikes and the UK is proposing a UN resolution.  Secondly, inventories have been dropping:


More bluntly: technical and fundamental events may lead to a nasty oil price spike, tightening the oil choke collar and potentially slowing growth.  This is another factor that I would add to my list of economic data points concerning me right now.