Saturday, July 3, 2021

Weekly Indicators for June 28 - July 2 at Seeking Alpha


- by New Deal democrat

My Weekly Indicators post is up at Seeking Alpha.

The indicators in all time frames continue to be very positive, with mortgage rates continuing to tick down. We continue to have supply bottlenecks in “used” housing, cars, and a continued increase in gas prices - but so far no sign of any slowdown. The biggest immediate threat is the impact of the “delta variant” of COVID on the unvaccinated portions of the country.

As usual, clicking over and reading will bring you thoroughly up to date, and bring me a few pennies in my pocket.

Friday, July 2, 2021

June jobs report: a tale of two very different surveys - but both far from full recovery


 - by New Deal democrat

HEADLINES:
  • 850,000 jobs added. Of these, 662,000 were private sector jobs, and 188,000 were government jobs, chiefly in education. The alternate, and more volatile measure in the household report indicated a gain of only 128,000 jobs, which factors into the unemployment and underemployment rates below.
  • The total number of employed is still 6,764,000, or -4.4% below its pre-pandemic peak.  At this rate jobs have grown this year, it will take another full year for employment to completely recover.
  • U3 unemployment rate *rose* 0.1% to 5.9%, compared with the January 2020 low of 3.5%.
  • U6 underemployment rate declined -0.4% to 9.8%, compared with the January 2020 low of 6.9%.
  • Those on temporary layoff declined -12,000 to 1,811,000.
  • Permanent job losers declined -47,000 to 3,187,000.
  • April was revised downward by -9,000, while May was revised upward by 24,000, for a net gain of 15,000 jobs compared with previous reports.
Leading employment indicators of a slowdown or recession

These are leading sectors for the economy overall, and will help us gauge how strong the rebound from the pandemic will be.  These were mixed: 
  • the average manufacturing workweek decreased -0.2 hours to 40.2 hours. This is one of the 10 components of the LEI.
  • Manufacturing jobs rose 15,000. Since the beginning of the pandemic, manufacturing has still lost -481,000 jobs, or -3.8% of the total.
  • Construction jobs fell -7,000. Since the beginning of the pandemic, -238,000 construction jobs have been lost, or -3.1% of the total.
  • Residential construction jobs, which are even more leading, rose by 2,500. Since the beginning of the pandemic, 33,100 jobs have been gained in this sector, or 3.4%.
  • temporary jobs rose by 3,300. Since the beginning of the pandemic, there have still been -278,500 jobs lost, or -9.5% of all temporary jobs.
  • the number of people unemployed for 5 weeks or less declined by -42,000 to 1,981,000, which is  -101,000 *lower* than just before the pandemic hit.
  • Professional and business employment rose by 72,000, which is still 633,000, or about -2.9%, below its pre-pandemic peak.

Wages of non-managerial workers
  • Average Hourly Earnings for Production and Nonsupervisory Personnel: rose $0.10 to $25.68, which is a 3.7% YoY gain. This is excellent news, considering that many low-wage workers have finally been recalled to work. 

Aggregate hours and wages:
  • the index of aggregate hours worked for non-managerial workers declined by -0.1%, which is a  loss of -4.4% since just before the pandemic.
  •  the index of aggregate payrolls for non-managerial workers rose by 0.3%, which is a gain of 2.5% since just before the pandemic.

Other significant data:
  • Leisure and hospitality jobs, which were the most hard-hit during the pandemic, increased 343,000, but is still 2.2 million, or 12.9% below their pre-pandemic peak.
  • Within the leisure and hospitality sector, food and drink establishments gained 194,000, but is still -1,270,200, or -10.3% below their pre-pandemic peak.
  • Full time jobs decreased -183,000 in the household report.
  • Part time jobs increased 408,000 in the household report.
  • The number of job holders who were part time for economic reasons declined by 644,000 to 4,627,000, which is an increase of 229,000 since before the pandemic began.

SUMMARY

This month saw two very different components of the overall jobs report. The establishment survey, which tells us how many jobs were added or lost in various sectors, was very strong, while the household report, which tells us things about unemployment and underemployment, was very weak although still positive.

There was lots of good news in the hardest hit sectors of leisure and hospitality and eduction, which were responsible for over half of all the job gains; while manufacturing, construction, and professional and business services were either weakly positive or even slightly negative. Wage growth also continued strongly, which is certainly good news.

On the other hand, full time jobs as measured in the household report actually declined. But both permanent and temporary layoffs decreased, as did the newly unemployed, as did involuntary part time employment - all of which are very good.

Putting everything together, this month’s report showed substantial and steady progress, but nowhere near enough to fully recover from the pandemic for many months to come (and that’s not taking into account what may await as a result of increasing COVID cases due to the “delta” variant).

Thursday, July 1, 2021

June data starts out mixed: manufacturing strong, housing stalls


 - by New Deal democrat

June data started out this morning with the ISM manufacturing report. There was no big change from last month’s torrid pace. The overall index declined a very slight -0.6% to 60.6, while the leading new orders component declined by 1 to 66:


Any number over 60 implies a very strong economy, so this report indicates that the manufacturing sector is still red hot.

The last big May number, construction spending, was also reported, showing a definite cooling in the housing sector. Total spending actually declined a slight -0.3% from April, while the leading residential sector increased a slight 0.2%, even before taking into account inflation in housing materials:


In short, we start out the month with one leading sector, manufacturing, continuing to be very positive, while one long leading sector, housing, shows evidence of stalling if not a peak.

New jobless claims: a surprise to the positive side


 - by New Deal democrat

I have been paying particular attention to new jobless claims this year, as being the most important weekly economic datapoint to correlate with vaccination progress. My ultimate target for claims is an average of 325,000 or below, which would signify a return to normal expansion levels in the past 30 years.

Lasts week I wrote that “Unfortunately, that progress [in vaccinations] has largely stalled in the past month, and now new jobless claims appear to have stalled as well.”

For this week, at least, I was wrong - and am glad to be so if the positive trend lasts.

This week new jobless claims declined 51,000 to 364,000, a new pandemic low 10,000 below the previous low of 374,000 set three weeks ago. The 4 week average of claims also declined by 6,000 to a new pandemic low of 392,750. Here is the trend since last August:


By way of contrast, at the peak of the pandemic lockdowns in spring 2020, new claims were running 6 million to 7 million per week.

From late February into May, claims had trended down an average of roughly 100,000 per month. This had slowed to roughly 50,000 per month, and over the last 4 weeks, is only down about 35,000. This implies a much weaker employment report tomorrow for June than we saw in the March - May months.

Continuing claims, which are reported with a one week lag, and lag the trend of initial claims typically by a few weeks to several months, have only declined about 10% from roughly 3,750,000 over the past 3 1/2 months:


At least some of this decline *may* be due to many States’ termination of all extended jobless benefits due to the pandemic.

A long term perspective shows that these are equivalent to the worst levels of most previous recessions, or early in the expansions, versus at 2,000,000 or below later in strong expansions:


While I would like to believe that the good news is going to continue, there is no getting around that the “delta outbreak” has begun in the least vaccinated States of the Deep South and interior West, and is likely to follow an exponential scale over the next weeks and possibly months. 

So I continue to believe, as I first wrote three weeks ago, “I think we are going to see two tracks going forward from here, as near-normalcy does return to the more vaccinated parts of the country, while attempts to return to normalcy fail in the laggard regions.” And that implies at least a stall in the decline in new claims, and - I actually suspect - an increase, perhaps to about 450,000 per week or so.

Wednesday, June 30, 2021

Coronavirus dashboard for June 30: 2 to 4 weeks until a likely major “Delta” outbreak in unvaccinated regions


 - by New Deal democrat

Missouri has been the US bellwether for the onset of the “Delta” variant of COVID. Which makes the below graph by Charles Gaba of infection rates by county for June in Missouri particularly insightful:


As has been usual, partisanship, which has correlated highly with vaccinations, in turn also has a strong relationship with the rate of new infections. But more importantly, note just how high an infection level some of the least vaccinated counties have had in June. Many of them are over 0.5% of population newly infected in June, and a few are over 1% - this with “Delta” just getting underway.

If Missouri’s rate continues to rise (and, as we’ll see below, there is every reason to expect that to happen), then COVID is going to burn through Missouri’s (and other similarly situated States’) population in the next few months like a forest fire exploding uphill.

Here is the long term view of how “Delta” is impacting the 3 most vaccinated countries - the US, UK, and Israel:


Now here is the close-up of the past 8 weeks:


Israel, the most vaccinated of all countries, has seen a relatively mild increase that has been mainly confined to young children and teens, none of whom were vaccinated, and also to unvaccinated adults. In the UK, by contrast, which largely had only one vaccination by the somewhat less effective AstraZeneca vaccine, the pandemic has once again flared out of control. The US has only just begun a slow increase in the past week.

The number of States in the US with increasing cases over the past 2 weeks has increased to 12 (compared with New Jersey in orange, the “worst” of the Northeastern States, which has been flat):


Several of these States, most notably CA and VA, have shown slight increases from very low levels, which might be noise;  but the rest all seem to be in established uptrends.

Finally, here are the worst 5 States compared with the UK:


NV appears to be only about 9 days behind the trend in the UK, with the other 4 about 2 weeks behind. If these States’ trends continue - and there is no reason to think their populations are going to change their minds about vaccines, masking, or social distancing at this late date - then they will be in the thick of a “Delta wave” in about 2 to 4 weeks, with many other States in the Deep South and interior West close behind.

Tuesday, June 29, 2021

House prices continue to surge, with affordability near its worst since the Great Recession


 - by New Deal democrat

The FHFA and Case Shiller house price indexes for May and April, respectively, were released this morning. Because housing affordability is very much an issue, let’s take a look.


YoY the FHFA index is up 15.7%, and the Case Shiller national index is up 13.9%:


Not shown, but recall that last week the median price for new single family homes was reported up 18.1% YoY for May, and for existing homes up 23.6% YoY. This is on par with their most drastic increases during the housing bubble.

A quick estimate of how (un-)affordable housing is can be seen by dividing house prices by average hourly wages, i.e., how many hours of income does it cost to buy a typical house. Here’s a long term view of what all 4 indexes looked like normed to 1 as of May 2020:


Note that existing home prices are only available to FRED from the NAR for the past 12 months. But it is quite clear that “real” wage-adjusted house prices are close to their most extreme measures during the bubble.

Another type of estimate, for the typical monthly mortgage payment, can be obtained by multiplying the indexes by the prevailing 30 year mortgage rate (important note: this does not produce the actual monthly mortgage payment, but is a reasonably close estimate):


Here the news is much less alarming, as the typical monthly mortgage payment, while higher than a year ago, is nowhere near as high as it was during the housing bubble.

As a result, at 155.8, the NAR’s “housing affordability index” is close to its lowest (I.e., least affordable) reading since 2009, although it is higher than at any point during the housing bubble, when it was always below 150 and at its worst was just above 100:


An important difference vs. the housing bubble is that there were many speculators in the market, buying simply on the expectation that prices would continue to rise, i.e., “everyone knows house prices only go up!” This time around there is no evidence of such speculation, although obviously there is some panic buying for fear of being “forever priced out.”

We have already seen a downturn in sales. I do not believe this level of prices can be maintained for long.

Monday, June 28, 2021

Coronavirus dashboard for June 28: comparisons with one year ago as “delta” spreads


 - by New Deal democrat

Let’s begin this installment with a look at vaccinations by county from a different source that a reader pointed me to last week, COVIDactnow


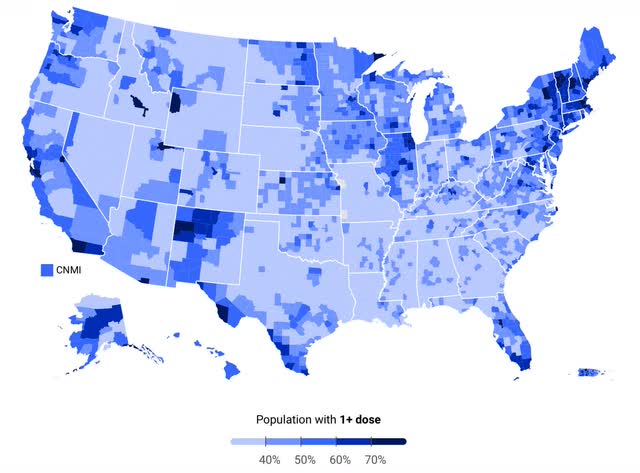
The urban/rural and Red State/Blue State divides are pretty obvious. Conor Kelly (whose work I was highlighting one year ago) also has a more detailed breakdown:


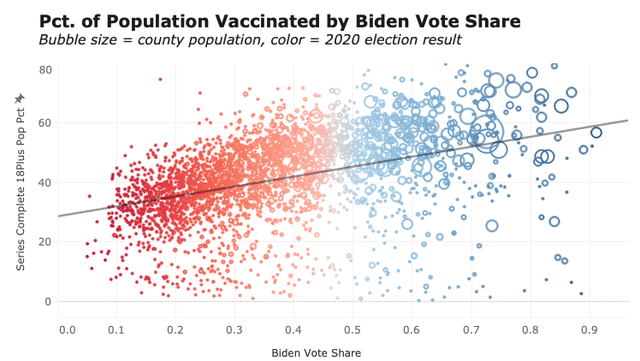
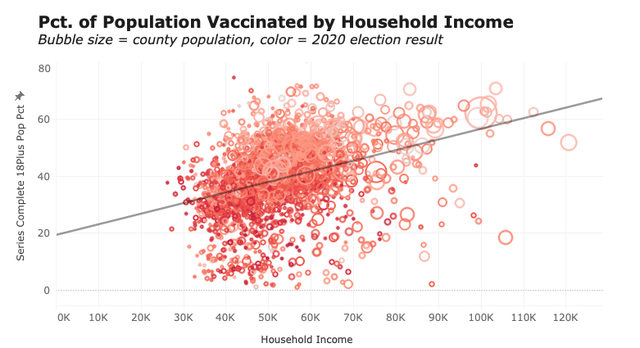
He notes that income level also correlates with vaccination rates even without taking partisanship into account:


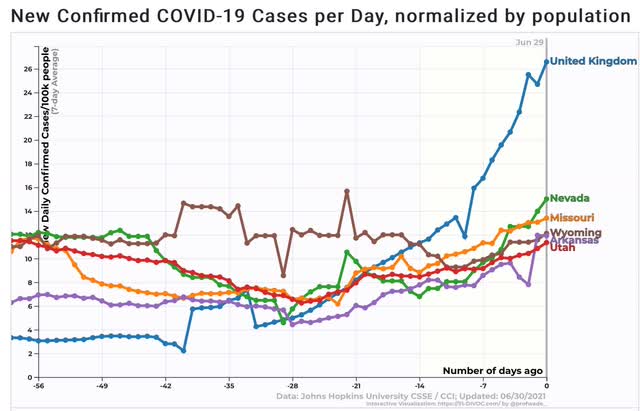
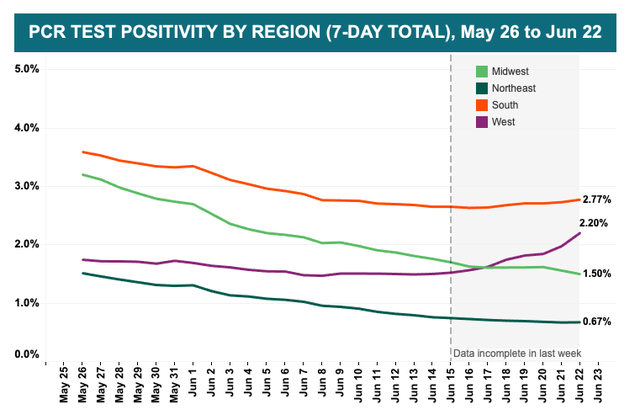
Kelly also notes that test positivity rates have also crept higher in the South and West regions where vaccinations have been lagging:


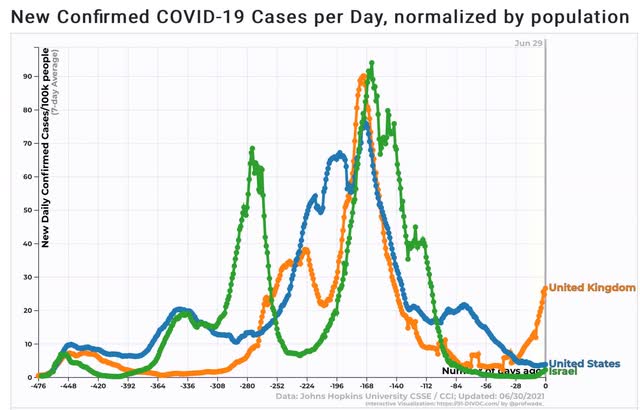
And indeed, when we look at the national level, both deaths and new cases have all but stopped declining:


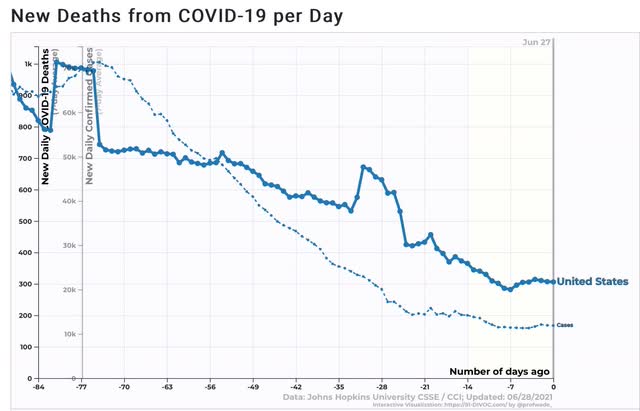
Cases were declining at a rate of 1500/day up until several weeks ago. Now they have been declining a 1500/*week*, and may have bottomed 5 days ago.

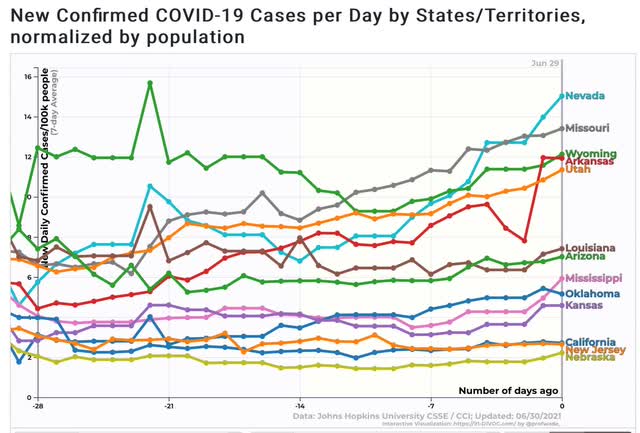
There are 16 States where cases are either flat or higher compared with where they were 2 weeks ago:


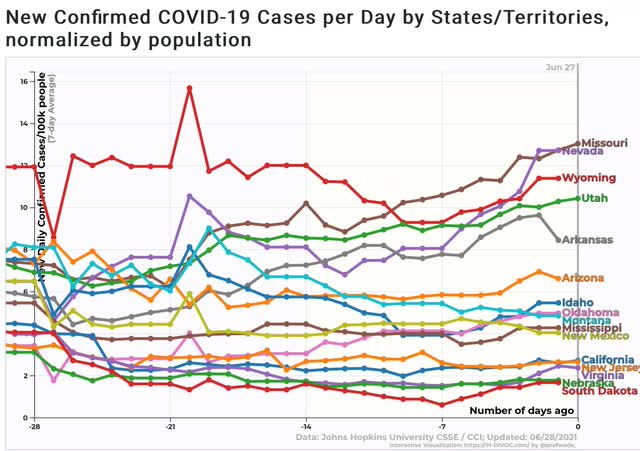
I expect this list to grow over the next week, since there are a number of States with numbers higher than they were 10 or 11 days ago. Note that several of the States have high vaccination rates - CA, NJ, VA, and NM - and in the case of the first 3 there may not be any significant increase, and all are at low levels, but are included for consistency.

For comparison purposes, here is what the top 10 States for new cases looked like one year ago:


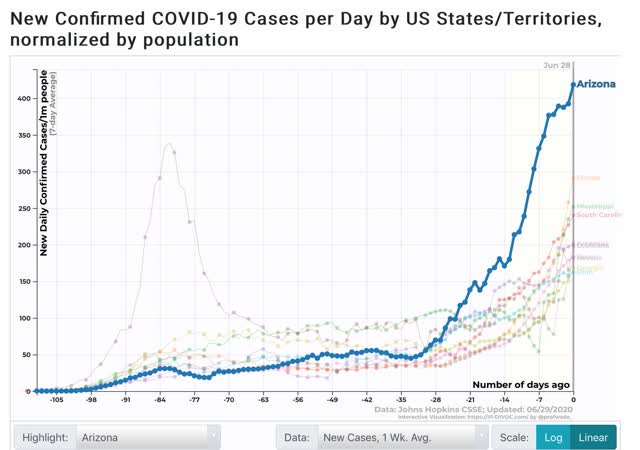
Note that the per capita rate was measured per 1,000,000 one year ago vs. per 100,000 now, so divide by 10 for the rate as measured in the current graph. In other words, by the current measure, the top 10 States had between 15 and 40 cases per 100,000, vs. 5 to 13 cases per 100,000 now.

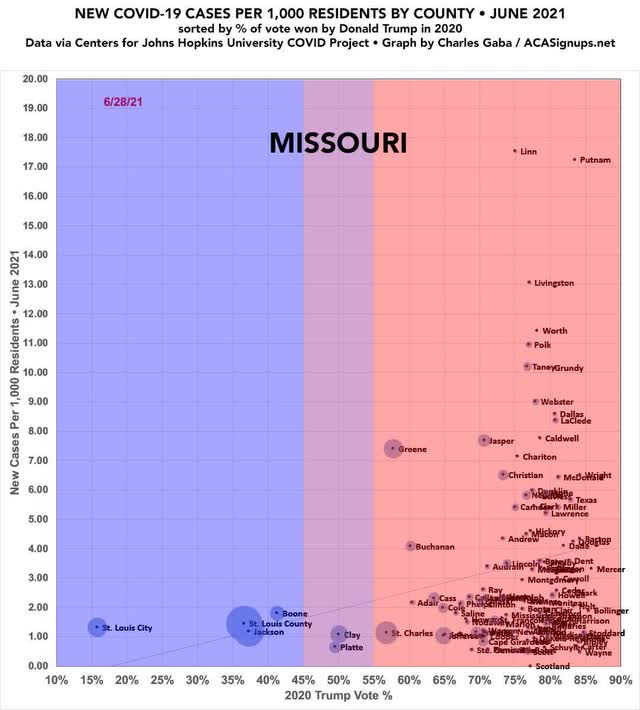
But several States, most importantly MO and WY, have just as high case rates as they had one year ago:


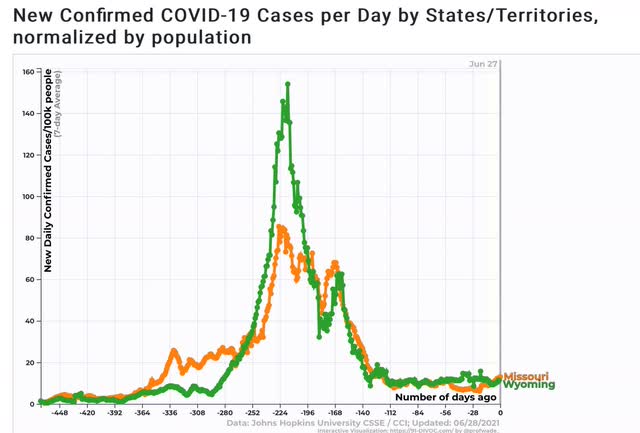
In the case of Missouri, their number of new cases per capita has doubled in the past 4 weeks, from 6.5 to 13.

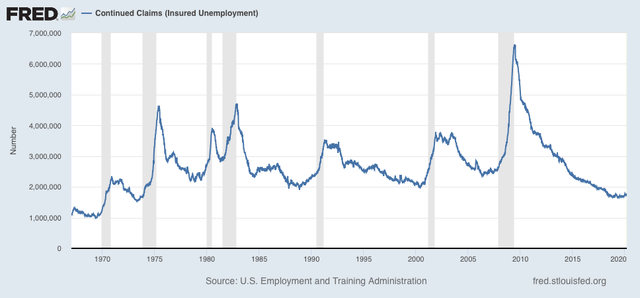
Missouri is particularly instructive, because the State has terminated pandemic employment benefits to force people back to work under the misimpression that the pandemic is “over.” I predict a poor result.

My best guess at this point - and this is all anyone really has - is that the “delta” variant will only cause a small increase in most highly vaccinated States, except for several, notably California, with huge populations at high density (so easier for the variant to spread among those remaining unvaccinated). But the variant will likely cause a very large spike, although not as bad as last winter’s, among the least vaccinated States. I expect that Missouri will lead the way here, and we will have a very clear picture in about 4 to 6 weeks, unfortunately and needlessly at the cost of much misery and death.