Saturday, September 21, 2019
Weekly Indicators for September 16 - 20 at Seeking Alpha
- by New Deal democrat
My Weekly Indicators post is up at Seeking Alpha.
For all of the discussion about various iterations of the treasury bond yield curve, it is little noted that right now it is sending a different message than virtually every other long leading indicator for the economy.
As usual, clicking over and reading should bring you up to the moment on the economy, and bring me a penny or two for my efforts.
Friday, September 20, 2019
A closer look at the housing rebound
-by New Deal democrat
On Wednesday we got some excellent new residential construction numbers. I went into a lot more detail, showing how - exactly as I forecast - the turn in interest rates led the turn in housing sales by about six months, over at Seeking Alpha.
As usual, clicking over and reading helps reward me with a penny or two for my efforts.
While I am at it, on the subject of housing, here is a chart I am working on (not completed yet!) for another post, showing the maximum percentage decline in total and single family housing permits from expansion peak until the onset of recession, ever since reports started in the early 1960s, plus the decline from peak between the beginning of 2018 to the present:
| Recession onset | Total housing Permits | 1 unit housing Permits | —— | — |
|---|---|---|---|---|
| 12/1969 | -22.7% | -20.7% | ——— | |
| 11/1973 | -42.0 | -40.1 | ||
| 6/1980 | -36.8 | -43.7 | ||
| 7/1981 | -37.4 | -38.4 | ||
| 7/1990 | -44.3 | -35.1 | ||
| 3/2001 | -11.5 | -12.5 | ||
| 12/2007 | -49.2 | -58.7 | ||
| 2018-19 | -12.4 | -11.9 | ||
Note that in all cases but two (1969 and 2001), the declines were in excess of 30%. The recent decline, at roughly 12%, is almost identical to the decline prior to the 2001 recession. Why the 2001 recession happened despite the relatively small decline is important (and a subject of that other post to come!).
Also while I am at it, last October I wrote that Barring the Fed Reversing Course, Housing Has Peaked For This Cycle. Obviously with Wednesday’s permits and starts data, housing has exceeded its prior peak.
So what happened? Obviously the Fed did recently - very tardily in my opinion - change course. But the primary driver was a 1.5% decrease in mortgage rates, assisted by a 10% decrease in median new home prices.
Here’s a graph of 30 year mortgage rates since January 2013:
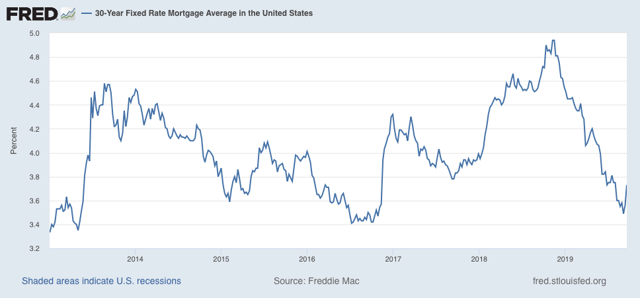
The “taper tantrum” of summer 2013 caused mortgage rates to rise 1.2%. Over the next 3 years, culminating with the Brexit panic low of summer 2016, rates went back down to 3.4%. Between the election of Trump and the Fed raising rates, by last November mortgage rates had risen to 5%. But in the last 11 months they have declined 1.5% (I don’t think it is primarily due to US recession fears, but that is another story).
Now here is the median new home sales price:
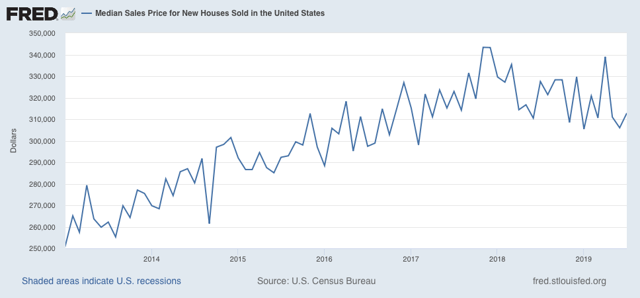
There was a 10% decline that started right at the peak of new home sales at the beginning of 2018.
Here’s what the decline in mortgage rates plus the decline in median prices did to the typical mortgage payment.
In November 2018, if you made a $30,000 down payment and took out a $300,000 30 year mortgage at 5% on the $330,000 median-priced new house, your monthly payment was $1610. Earlier this month, if you made the same down payment and took out a $270,000 mortgage at 3.5% on the $300,000 median-priced new house, your monthly payment had declined to $1212.
That’s almost a $400 difference per month. That is going to spark a lot of new demand — and it did!
Thursday, September 19, 2019
Initial claims increasingly foreclose 2019-early 2020 downturn
- by New Deal democrat
I’ve been monitoring initial jobless claims closely for the past several months, to see if there are any signs of stress. This is because the long leading indicators were negative one year ago, and many - but not a majority - of the short leading indicators have recently turned negative as well. So I have been on “recession watch.” But no recession is going to begin unless and until layoffs increase.
To reiterate, my two thresholds are:
1. If the four week average on claims is more than 10% above its expansion low.
2. If the YoY% change in the monthly average turns higher.
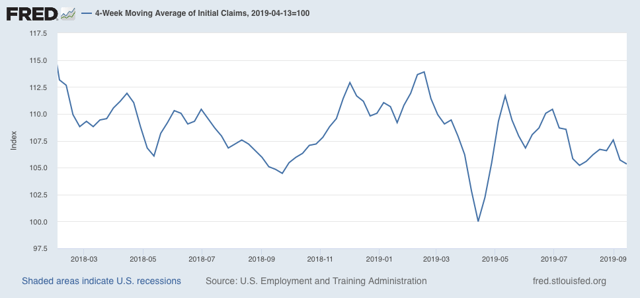
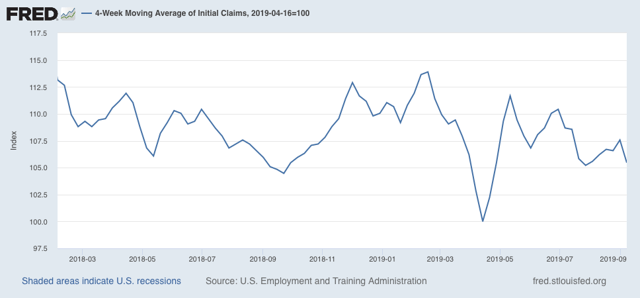
As of this week, initial claims continue to be very close to their expansion lows. The 4 week moving average of claims as of this morning is 212,500, only 11,000, or 5.3%, above the lowest reading this expansion:
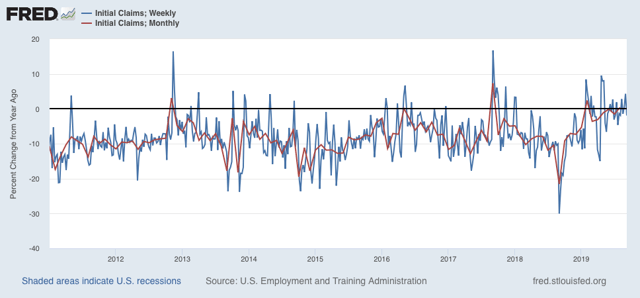
On a YoY% change basis, the 4 week average is 0.6% higher than one year ago:
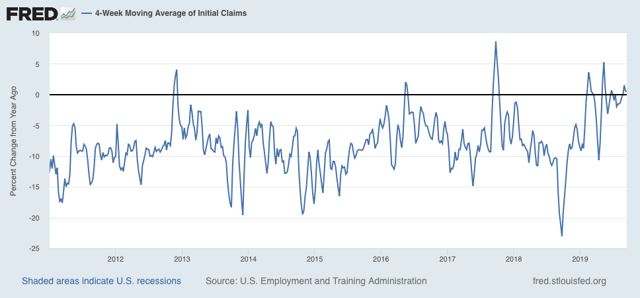
But September claims so far are running -5000 less than the full month of September 2018.
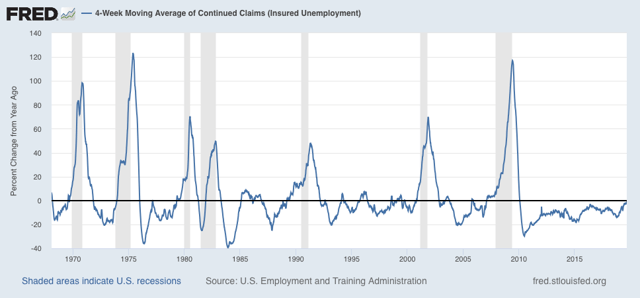
The less volatile 4 week average of continuing claims is also running -1.3% below where it was a year ago:

Initial claims continue to be an important positive in the short term forecast. If a recession doesn’t happen within the next 6 months, it is hard to imagine it happening at all through 2020 (with usual caveat: *IF* the economy is left to its own devices). And initial claims increasingly suggest that a downturn will not happen within that 6 month window.
Wednesday, September 18, 2019
Housing: BOOM!
- by New Deal democrat
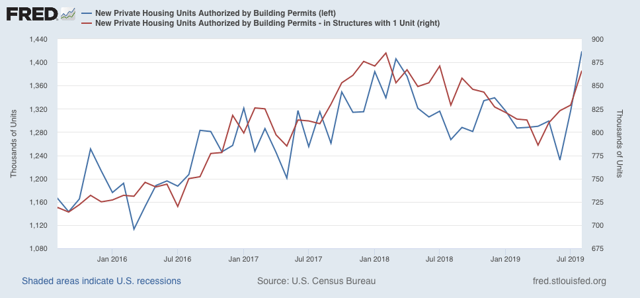
Well, this is an easy post. This morning’s report on housing permits and starts showed new expansion highs in both overall permits and starts. The less volatile single family segment also recovered, with both single family permits and starts at one year highs, although slightly below their expansion peaks.
Here are total and single family permits:
And here are total and single family starts:
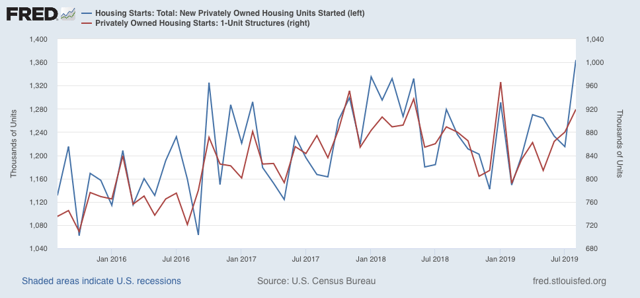
The housing downturn is over. As expected, lower interest rates for the past eight months have shown up in the housing data in spades.
This has major implications for the index of leading indicators this month, which can be expected to pop. And since housing permits are a long leading indicator, this, along with new expansion lows in corporate bond yields, new highs in per capita real retail sales, renewed increases in real money supply, and continuing looseness in credit conditions, means that the only negative long leading indicator is the partially inverted yield curve, and the only mixed or neutral indicator is corporate profits. In short, the latter part of next year is shaping up to be quite positive.
In the immediate term, I wonder if this takes the pressure off the Fed to lower interest rates. If you are a Democrat, don’t hang your hat on there being a recession on Election Day next year (although “Tariff Man” may yet come through!).
Tuesday, September 17, 2019
Industrial production rebounds; another message of slowdown, no recession
- by New Deal democrat
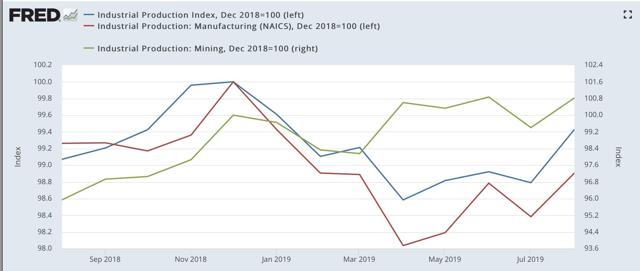
Industrial Production is the King of Coincident Indicators. When industrial production peaks and troughs coincides more often than any other indicator to NBER’s recession dating. Let’s take a look at the report for August, which was pretty darn good, which was released this morning.
Production as a whole increased 0.6%, and last month’s report was revised upward by +0.1%. The manufacturing component also increased, by 0.5%. Both, however, are still below their peaks set last December (left scale in the graphs below). The other important component, mining (which includes oil production) increased 1.4%, reversing July’s decline, missing a new high by less than 0.1% (right scale):
Stepping back for a longer term look, here is the same graph including the “shallow industrial recession” of 2015-16:
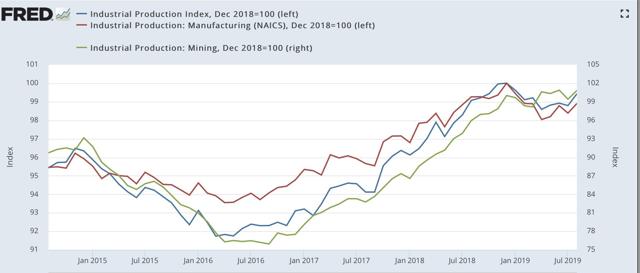
The main difference between the two periods is that the more volatile mining (oil and gas) sector declined by almost 23% in 2015-16, but has continued to increase this year. Manufacturing, which declined about 3% in 2015-16, declined 2% at its worst point this year. Overall industrial production declined by -5% in 2015-16, but only declined -1.4% at its worst point in April of this year.
Here is the update on all of the four monthly indicators that the NBER has said it pays particular attention to in deciding whether or not there is a recession:
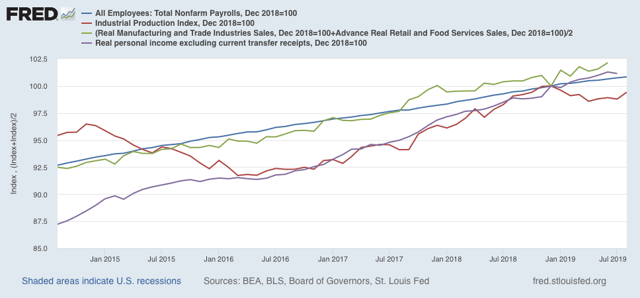
As in 2015-16, industrial production is the only one of the four which has declined this year.
In sum, production had a much more shallow decline this year than in 2015-16, and — so far — looks to be recovering from its trough in April. Once again the message appears to be: slowdown, no recession.
Monday, September 16, 2019
Weekly Indicators for September 9 - 13 at Seeking Alpha
- by New Deal democrat
I realized that I neglected to post a link to this Saturday’s Weekly Indicators post, which was up at Seeking Alpha. So here it is.
The theme over the past few months has been that, despite worsening conditions in manufacturing, and almost singular forecaster attention to the yield curve, many of the short and long term indicators have been improving, or are starting to improve.
As always, clicking over and reading helps reward me a little bit for the efforts I put in.
Last week’s initial jobless claims still show slowdown, no recession
- by New Deal democrat
A couple of weeks ago, I updated the entire list of short leading indicators. To cut to the chase, those that were negative or trending negative came out of the production sector, while those that were positive were mainly from the consumer sector.
But, regardless of which sector’s weakness might give rise to a recession, at some point it would have to be reflected in increased layoffs. As last Thursday’s report of initial jobless claims showed, that isn’t happening. Since I didn’t get around to commenting on this last week, let’s take a look now.
At 204,000, last week’s number of initial claims is close to the bottom of the number of claims even in the past year. The four week moving average is only 5.5% above the low point set in April:
Before a recession, the YoY comparison of initial claims generally moves higher for at least two months in a row. Against very positive numbers in August last year, this year’s number was slightly negative, but as shown below (weekly YoY claims in blue, monthly average in red) we haven’t violated this rule, and September so far is positive YoY:
Continuing claims turn a little after initial claims, but are less volatile. The four week moving average of continuing claims is -2.1% below where it was last year:
The bottom line is that the trend in jobless claims remains very weakly positive. Like so many other data series I track, the message at this point is “slowdown, no recession.”
Subscribe to:
Posts (Atom)