Saturday, August 21, 2021

Weekly Indicators for August 16 - 20 at Seeking Alpha


 - by New Deal democrat

My Weekly Indicators post is up at Seeking Alpha.

Surprisingly, Delta still has not made much of an impact on the coincident indicators. People as a whole are still out shopping and dining with nearly full enthusiasm. And there are signs that the Delta wave is beginning to peak.

As usual, clicking over and reading will bring you up to the virtual moment on the economy, and bring me some pocket change for brunch.

Friday, August 20, 2021

Housing update for 2022 at Seeking Alpha


 - by New Deal democrat

Following up on Wednesday’s post here, I took a comprehensive look at housing construction and sales, and their implications for the 2022 economy, over at Seeking Alpha.

As usual, clicking over and reading should be educational for you, and additional for me by a few pennies in my financial condition.

While I am at it, I haven’t updated my Big Picture short term and long term forecast for the economy since February, so I expect to do that at some point in the next week.

Thursday, August 19, 2021

Initial claims: simply, good news


 - by New Deal democrat

The bottom line for both initial and continued claims this week is simple: unadulterated, absolute good news.

Initial jobless claims declined 29,000 to 348,000, 20,000 below their previous pandemic low. The 4 week average of claims declined by 19,000 to 377,750, 6,750 below its previous pandemic low of 384,500:


Significant progress in the decline of initial claims had stalled for the last 2 months, but as of this week, that has ended.

The story is the same for continuing claims, which declined 79,000 to another new pandemic low of 2,820,000:


This continues this series’ recent declining trend that began on May 29. As I have noted before, this may reflect the termination of special pandemic benefits in many States, the impact of $15 minimum wages and signing bonuses being offered, or other items.

From the long term perspective, below is the current level of continuing claims  (blue), together with the 4 week average of initial claims* (red), and the unemployment rate from last week’s jobs report* (gold)(*adjusted for scale)(all current values = zero). The first two are consistent with early- to mid-expansions over the past 40 years, while the unemployment rate is consistent with mid-expansion or later:


Last week I wrote that the trend in claims was “under the control of the Delta variant . . . . , [because of which] I consider it likely that initial claims do not make much more headway.” Barring a huge upward revision next week, I was wrong. And for good news, I am happy to have been wrong, and I hope it continues.


Wednesday, August 18, 2021

July housing permits and starts: yellow flag for economy in 2022


 - by New Deal democrat

Last month I noted that, from here on, the comparisons with 2020 in housing would become much more challenging. And so they have.


While permits (gold in the graph below) did increase this month, their declining trend remains intact. Starts (blue), and more importantly, single family permits (red, right scale) - the least volatile measure of all - both decreased again, as they have almost relentlessly since the beginning of this year:


Viewed YoY, all three are only 2.5%-6.0% above last July:


Here is a graph I have run many times, the inverted YoY change in interest rates (blue) vs. the YoY% change in single family permits (red/10 for scale):


Note that in late 2018-early 2019, in the face of a similar increase in interest rates, permits actually declined YoY. Almost certainly, by September permits and starts will be negative YoY again.

All of which is of academic interest, except that housing is a very important long leading indicator for the economy. Starts are currently off about 7.5% from their peak, while both total and single family permits are off between 13% to 17%. In the past, when these have declined 20% from peak, it usually has resulted in a recession at some point 12+ months after the peak. Only one indicator, but still this is a yellow flag at minimum for the economy in 2022.


Tuesday, August 17, 2021

July industrial production (good news) and retail sales (bad news still being pretty good news)


 - by New Deal democrat

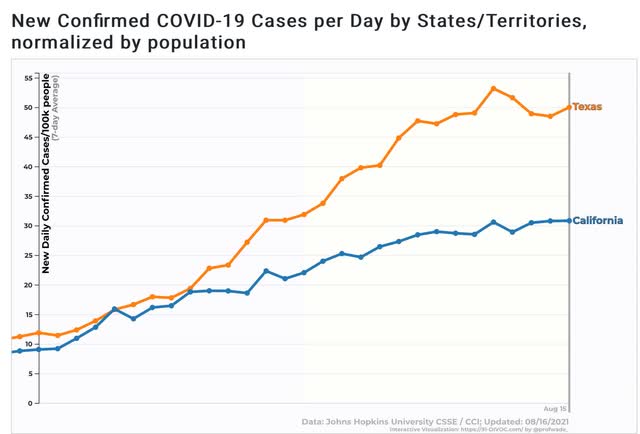
This morning brought the July report for the King of Coincident Indicators, industrial production, as well as one of my favorite consumer side indicators, retail sales. Let’s take a look at each.


Industrial sales increased strongly in July, up 0.9% overall, and the manufacturing component up 1.4%. Manufacturing production is now higher than it was just before the pandemic recession, and total production is only -0.2% lower, as shown in the below graph in which each are normed to 100 as of February 2020:


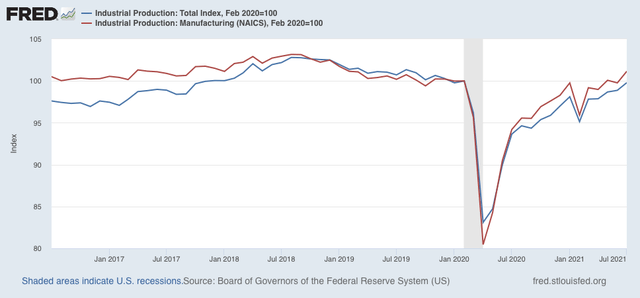
The only coincident indicator still below its pre-pandemic level is jobs, which is off -3.7% compared with February 2020.

Which is a good segue to retail sales, which are a good short leading indicator for jobs.

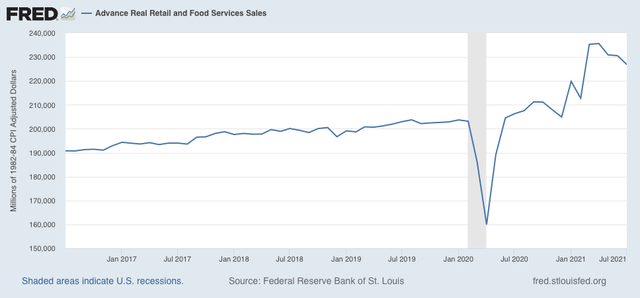
Nominally retail sales declined -1.1% in July, a pretty steep decline. Since consumer prices rose 0.5% that month, real retail sales declined -1.6% ! Ordinarily this would be very concerning, but in the context of the wild swings since the pandemic began, it is well within the range of monthly changes. Indeed, although I won’t bother with a YoY graph, the fact is that real retail sales are still over 10% higher than they were just before the pandemic hit, thanks to government emergency assistance programs, as shown in the graph of the absolute level of real retail sales:


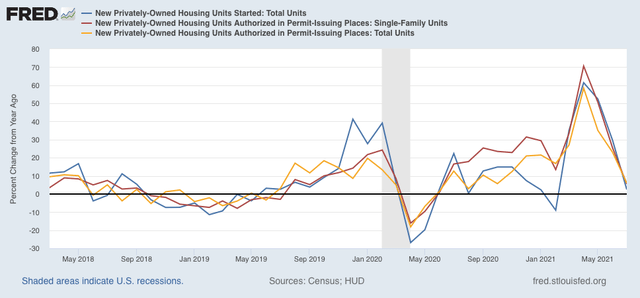
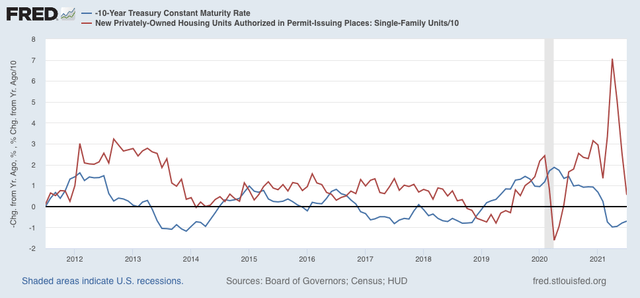
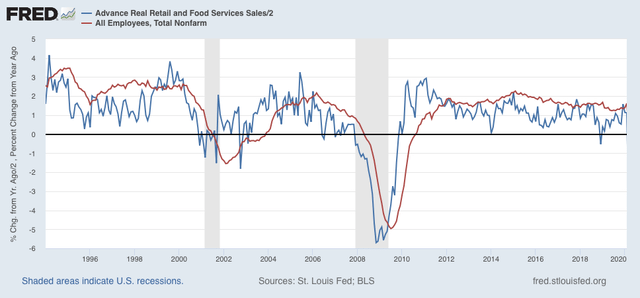
As I have written many times over the past 10+ years, real retail sales YoY/2 has a good record of leading jobs YoY with a lead time of about 3 to 6 months. That’s because demand for goods and services leads for the need to hire employees to fill that demand.  The exceptions have been right after the 2001 and 2008 recessions, when it took jobs longer to catch up, as shown in the graph below, which takes us up to February 2020:


Now here is the same graph since the onset of the pandemic. Note the scale is much larger, given the huge changes wrought by the early lockdowns, and of course the comparative spikes from the data one year later:


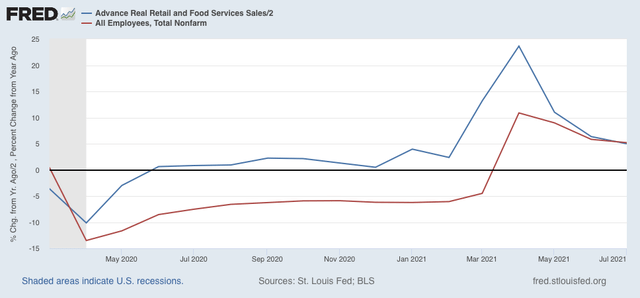
As with the recoveries immediately after the two prior recessions, up until the past several months YoY job creation has been well below YoY real retail sales growth. But as of last month, jobs entirely caught up to forecast trend, as real sales/2 = 5.0%, while job growth YoY has been 5.2%.

The fact that real sales continue to be so strong compared with pre-pandemic levels even after the -1.6% decline in July argues in favor of continued strong monthly jobs growth as well.

Monday, August 16, 2021

Coronavirus dashboard for August 16: some (relatively) “good” news, some bad news


- by New Deal democrat

Recently I’ve speculated in a few places that Delta may be acting as a backfire-type firebreak against Lamdba, which has been getting a lot of press as potentially evading vaccines.

Confirmation that this may in fact be the case comes from Dr. Eric Topol who writes:

The Lambda variant is going out like a lamb. (from the hard to find pandemic good news list) outbreak.info/situation-repo It can't compete with Delta.

and here is the graph (C.37 is Lambda):


Delta appears to be so infectious that it is preventing Lambda from getting a foothold anywhere beyond the west coast of South America.

Elsewhere in the (relatively) “good” news front, there is further confirmation that the Delta wave appears to be peaking or maybe even past peak in the earliest States that it hit:


Cases in California also appear to have plateaued, and even Texas has shown at least marked deceleration:


Meanwhile, deaths in the UK’s Delta wave also appear to have plateaued, as have new cases since its “Freedom Day” living all restrictions one month ago:


But in the “continued bad news” department, deaths in the US have continued to climb, and can be expected to continue to climb for at least the next 2.5 weeks:


And even in the most vaccinated States of New England and New York, the case count continues to climb:


In only 3 States - CT, MA, and VT - has over 60% of the total population been fully vaccinated. It appears that even this level of vaccination has not prevented a Delta wave. And there is no guarantee, especially as colder weather arrives in the north in the next 75 days, that a really bad situation, such as we have among the Gulf Coast States now, can’t happen.