Saturday, April 24, 2021

Weekly Indicators for April 19 - 23 at Seeking Alpha


 - by New Deal democrat

My Weekly Indicators post is up at Seeking Alpha.

I feel like a broken record . . . With pedal-to-the-metal fiscal and monetary stimulus, plus the opening up of pent-up demand with a large pool of vaccinated people, the economy is on fire, and is going to remain so for some time to come.

The question is, as we look out into next year, how much of an impact are higher interest rates and at least transitory higher inflation going to have?

Anyway, as usual clicking over and reading will bring you up to the virtual moment with what the data in all time-frames is showing, and reward me with a penny or two for lunch money for the effort I put in.

Friday, April 23, 2021

New and existing home sales vs. inventory


 - by New Deal democrat

I have a full plate in, you know, actual life today, so let me just drop this note here while we’re waiting for new home sales to be reported. I’ll update later when I have a chance.


The evidence is crystal clear that, as to new homes (which are by far more important than existing home sales in terms of the economy), sales lead prices, which in turn lead inventory.

Here are sales (red) vs. inventory (blue):


And here are prices (green) vs. inventory:


When it comes to existing homes, the NAR is very squirrelly about use of their data, but here is a long term look at sales vs. inventory:


Again, it’s crystal clear that sales led inventory through the housing boom, bubble, and bust. Note also that the secondary peak in sales in 2012 wasn’t reflected in a peak in inventory until one year later.

So, even while it is clear that record low inventory of existing homes is driving sales prices through the roof, sales appear to have already peaked, and I expect prices to follow before inventory turns up. 

More later as time permits.

Thursday, April 22, 2021

More new pandemic lows in jobless claims: April jobs report likely to show over 1,000,000 new jobs added


 - by New Deal democrat

Repeating my recent top-line mantra, new jobless claims are likely to the most important weekly economic data for the next 3 to 6 months. With the number of those vaccinated continuing to increase, I expect an ongoing big increase in renewed consumer and social activities, with a concomitant gain in monthly employment gains like we saw in the March jobs report.

Five weeks ago I set a few objective targets: new claims to be under 500,000 by Memorial Day, and below 400,000 by Labor Day. 

This week we continued our major advance towards those targets.

On a unadjusted basis, new jobless claims declined by 56,554 to 566,479. Seasonally adjusted claims declined by 39,000 to 547,000. The 4 week average of claims also declined by 27,750 to 651,000. 

At their worst one year ago, initial claims were in the range of 5 to 7 million per week! Here’s how the trend looks since last last August: 


One note of perspective: during the Great Recession, even at their *worst* level, new initial claims were 665,000.

Continuing claims, which are reported with a one week lag, and lag the trend of intitial claims typically by a few weeks to several months, also declined to new pandemic lows on both an adjusted and unadjusted basis. The unadjusted number declined 50,774 to 3,862,890, while after seasonal adjustment the decline was 34,000 to 3,674,000:


Seasonally adjusted continued claims are at levels last seen in late 2011, when weekly jobless claims were just under 400,000 and the unemployment rate was 8.5%.

In the last 5 weeks, since the March reference week for the jobs report, initial claims have declined on average by almost 100,000 m/m. This kind of decline only happened three times since data started to be collected almost 60 years ago until the pandemic, and was associated with strong monthly employment gains on the order of +350,000. Last year, when we had a similar decline in July, we gained 1,726,000 jobs. 

As a result, I now expect April’s jobs report to show a gains of well over 1,000,000 jobs, and possibly closer to 2,000,000. Additionally, my concern that new and more infectious variants of COVID might undercut progress with vaccinations is fading as the data has shown a plateau and even slight renewed decline in new cases.

Wednesday, April 21, 2021

The US may have crossed an important vaccination threshold


 - by New Deal democrat

On Monday I noted that in Chile, where there had been a severe renewed outbreak of coronavirus despite an aggressive vaccination program, cases had plateaued, and this had occurred “when over 35% of the population had received at least one dose of vaccine, and 20% were fully vaccinated.”


Well, the recent upturn in cases in the US also seems to have plateaued:


And guess what? The plateau in the US started to happen about 10 days ago, when the US also reached 35% of the population having received at least one dose of vaccine, and 20% were fully vaccinated:


N [number of examples] = 2, so take with a few bucket-loads of salt. But while we can’t be sure that neither in the US nor in Chile will there be renewed upturns in cases, it’s at least a reasonable hypothesis for consideration, that both countries may have crossed an important vaccination threshold sufficient to blunt new outbreaks.

Tuesday, April 20, 2021

A housing market quandary: two completely contradictory reports on renting vs. ownership


 - by New Deal democrat

There are three potential areas of concern for the economy in the next 12 to 24 months that I see:


1. Inflation - this looks temporary to me. Demand side effects will probably fade by the end of summer, and supply side bottlenecks should fade within the year.

2. Stock price evaluations - I strongly suspect these are near secular highs, and are subject to a serious pullback in the next several years.

3. Housing - The biggest reason I don’t see this as being in a bubble is the lack of “fog-the-mirror” mortgages being originated. Take away reckless lending spurring short term speculative demand, and there is only so much that the market can deviate from the norm. Which means that any downturn would probably be closer to the 4% downturn between 1990 and 1992:


Behind the scenes I’ve been working on all of these, but I don’t have any of them nailed down enough to post something more explicit.

To give you an example of what is bedeviling the data, let’s take a look at the choice of homeownership vs. renting - which is one of the drivers of new housing.

There are two primary government sources for rental prices: (1) the monthly CPI report, under the category “rent of primary residence;” and (2) the quarterly homeownership and vacancy report, which includes a measure of “median asking rent.”

You would think the two statistics would be reasonably close to one another.

You would be wrong.

Here is what the CPI measure (red) looks like compared with the FHFA house price index (blue), both normed to 100 as of January 1991:


You can see that house prices really took off compared with rents during the housing bubble, and have done so again in the past year. Here’s what that looks like when we divide median house prices by median rents, again norming the statistic to 1 as of January 1991:


The imbalance is about equal to early 2004. Rents have only gone up about 2% in the past year, while house prices have gone up 12%.

But now let’s take a look at median asking rents:


According to this report, YoY in 2020 rents went up 19%! Quite a difference from the CPI of 2%.

As a result, according to HUD, here’s what housing affordability looks like compared with rental affordability as of their most recent report in February:


According to this metric, relatively speaking housing is much more affordable than renting.

So the CPI report and the Quarterly affordability report are giving us completely contradictory results, with completely opposite implications for housing going forward.

Monday, April 19, 2021

Coronavirus dashboard for April 19: Much great progress, and some problem children


 - by New Deal democrat

As an initial note, there is no significant economic data until Thursday this week, so don’t be surprised if I play hooky for a day or two....


Today let’s take a look at the latest coronavirus information.

There’s much progress on the vaccination front. I’ll let the CDC’s numbers speak for themselves:


Here’s the information graphically by age group as of last week:


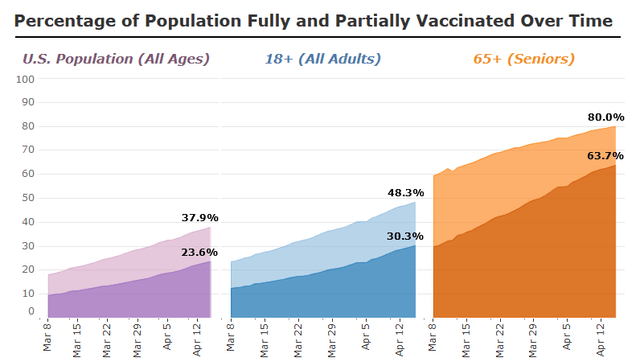
I’m encouraged by the fact that, despite many stories of vaccine hesitancy or refusal, over 80% of seniors already have had one dose. I suspect that widespread hesitancy is likely to be gradually overcome in younger demographics as well.

Cases in nursing homes and other adult residential facilities have all but disappeared, down 97% as of last week:


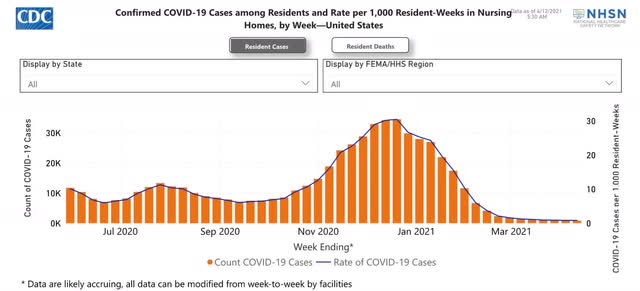
Deaths in those facilities are down 90%:


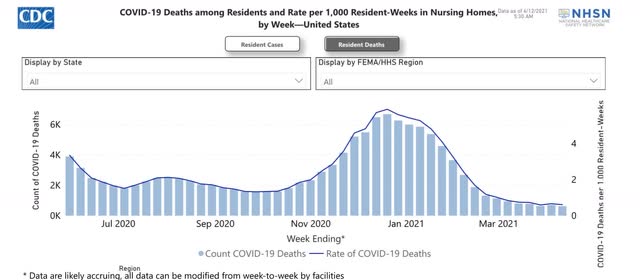
Hopefully these will decline further in coming weeks as well.

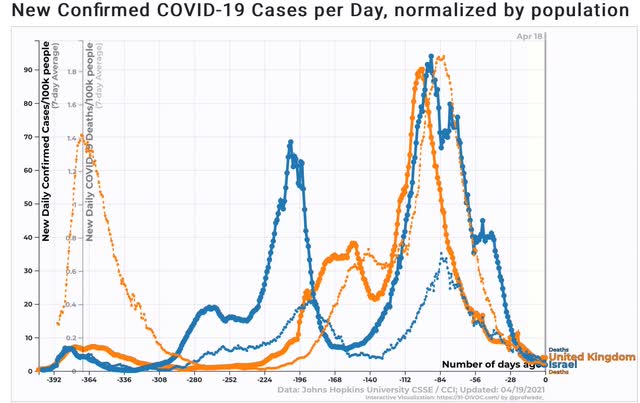
The news is also good on the international vaccination front, as both poster children for the combination of good vaccination programs coupled with temporary nationwide lockdowns, Israel and the UK, show declines in both cases and deaths of roughly 95%:


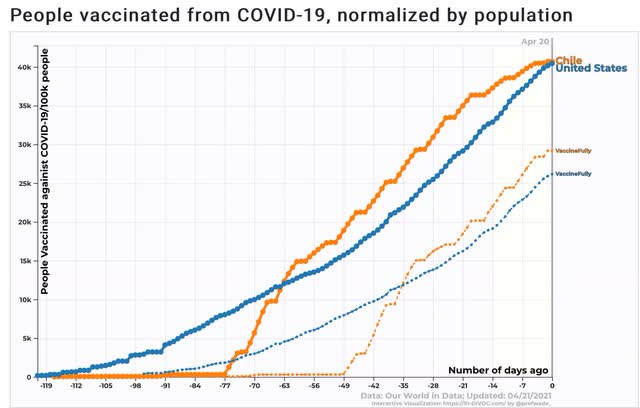
Meanwhile, the negative poster child of Chile at least seems to have hit a plateau in new cases, although deaths are still increasing at a similar rate as cases did recently:

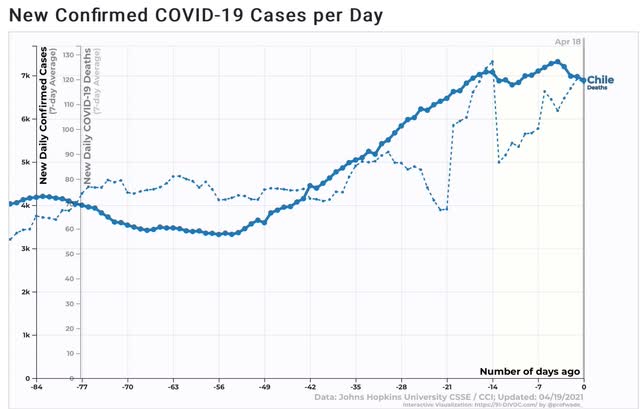
Perhaps coincidentally (not shown), cases in Chile plateaued when over 35% of the population had received at least one dose of vaccine, and 20% were fully vaccinated.

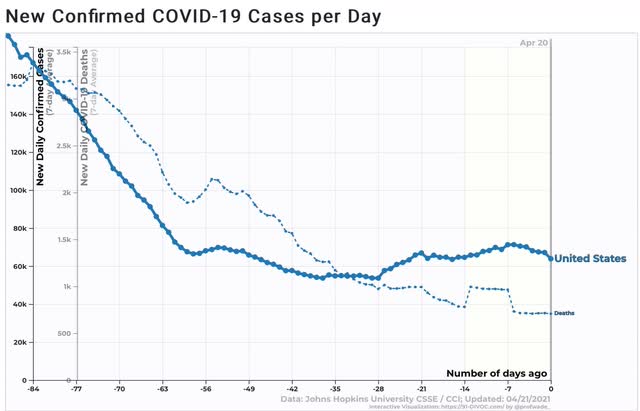
Turning to the US, the recent upturn in cases also looks like it may be plateauing, and deaths have still been declining slightly:


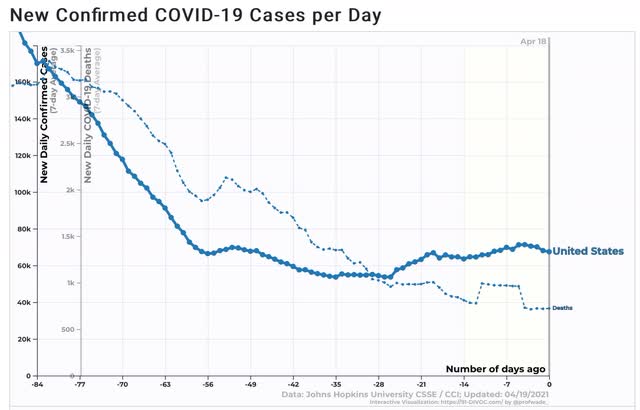
As we are nearly 28 days out from the upturn in cases, unfortunately I suspect deaths will shortly turn up as well.

The US’s mixed nationwide result belies the fact that about half the States are still showing huge declines in cases, while almost half have had a big increase.

Here are the bad boys and girls:


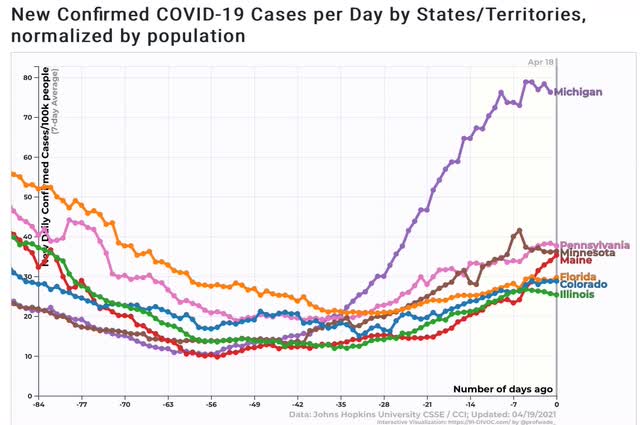
CT, DE, IN, MA, NH, and OR are almost as bad. Michigan is in a (bad) league of its own.

Here are the good boys and girls:


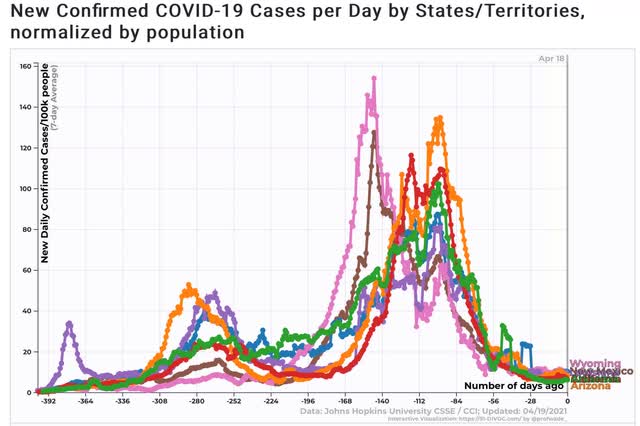
Similarly, I could also have included GA, ID, KS, KY, MS, MO, MT, NV, OK, TN, and UT.

Here are the 4 big States of CA, FL, NY, and TX:


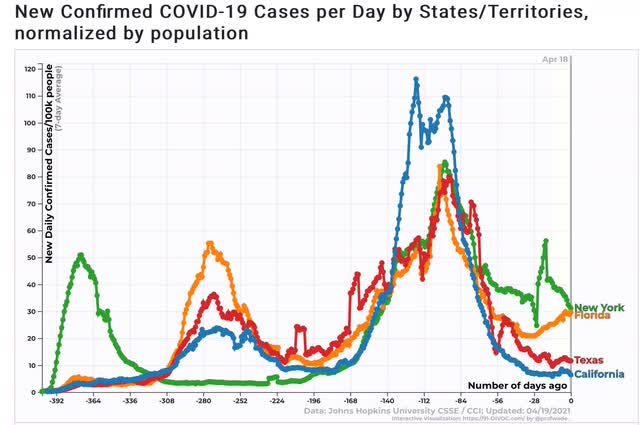
California, after a horrible winter, is doing excellent! Perhaps surprisingly, Texas is not far behind. Florida and to a lesser extent New York have been problem children.

If we can overcome vaccine reluctance, I am very hopeful that by the 4th of July the pandemic will be largely behind us.