Saturday, September 22, 2012
Weekly Indicators: the sharp bifurcation continues edition
- by New Deal democrat
The big monthly news this week was August's LEI, which declined -0.1. This index is only up 0.1 for the last 5 months. The Conference Board, which compiles the index, believes this indicates continued but very slow growth. While building permits, starts, and existing home sales continued to show a recovering housing market from very low levels, the Empire State and Philly Indexes added to the evidence that manufacturing is actually contracting.
The high frequency weekly indicators should show turns before they show up in monthly or quarterly data. These are quite mixed, which is a weakening from a few months ago.
Let's start once again with energy. The price of oil declined last week, but gasoline prices and usage still show the choke collar engaged:
Gasoline prices rose yet again last week, up $.04 from $3.85 to $3.89. Gas prices have risen $0.53 since their early July bottom, and are now only $0.05 cheaper than at their highest point this spring.Oil prices per barrel fell sharply from $99.00 to $92.89. Gasoline usage was slightly negative on a YoY basis. For one week, it was 8632 M gallons vs. 8818 M a year ago, down -2.1%. The 4 week average at 8892 M vs. 8973 M one year ago, was down -0.9%.
Employment related indicators were again mixed this week.
The Department of Labor reported that Initial jobless claims wre steady at 382,000 from the prior week's unrevised figure. The four week average rose another 3,000 to 378,000, about 4% above its post-recession low. If higher oil prices are again acting as a governor preventing fast economic growth, then this number, unforturnately, should continue to rise in coming weeks, and there is now evidence of at least some impact.
The American Staffing Association Index rose by one back to 93. This index was generally flat during the second quarter at 93 +/-1, and for it to be positive should have continued to rise from that level after its July 4 seasonal decline. It has not done so. This is a red flag, as the trend from spring into fall is worse than in 2007, 2009, 2010 and 2011. Only 2008 had a worse 6 month trend.
On the other hand, the Daily Treasury Statement showed that 13 days into September, $99.5 B was collected vs. $93.5 B a year ago, a $6.0 B or a 7% increase. For the last 20 days ending on Thursday, $134.0 B was collected vs. $127.4 B for the comparable period in 2011, a gain of $6.6 B or +5.2%.
Same Store Sales and Gallup consumer spending were all solidly positive:
The ICSC reported that same store sales for the week ending September 8 were down -2.5%% w/w (as is typical after school starts), but were up +2.1% YoY. Johnson Redbook reported another solid 2.4% YoY gain. The 14 day average of Gallup daily consumer spending as of September 20 was $72, compared with $65 last year for this period. Gallup's YoY comparison has been strongly positive for 7 of the last 9 weeks.
Bond yields rose and credit spreads were steady:
Weekly BAA commercial bond rates rose .12% to 4.94%. Yields on 10 year treasury bonds also rose .12% to 1.76%. The credit spread between the two remained at 3.18%, which is closer to its 52 week minimum than maximum, an improvement from several months ago.
Housing reports were all positive:
The Mortgage Bankers' Association reported that the seasonally adjusted Purchase Index fell about 4% from the prior week, but is up about 8% YoY. Generally these remain in the middle part of their 2+ year range. The Refinance Index also rose about +1% for the week.
The Federal Reserve Bank's weekly H8 report of real estate loans this week rose 20 to 3534. The YoY comparison rose to +2.2%, which was also the seasonally adjusted bottom. The raw number is an 18 month high, and the percentage gain is the best in 3 years.
YoY weekly median asking house prices from 54 metropolitan areas at Housing Tracker were up +2.2% from a year ago. YoY asking prices have been positive for almost 10 months.
Money supply remains quite positive:
M1 declined -0.6% for the week, but was up +2.3% month over month. Its YoY growth rate continued to rise sharply, to +14.3%. As a result, Real M1 also rose to +12.6%. YoY. M2 increased +0.3% for the week, and was up 0.6% month over month. Its YoY growth rate also rose again to +6.8%, so Real M2 rose to +5.1%. The growth rate for real money supply is still quite positive, despite the summer 2011 incoming tsunami of Euro-cash having disappeared from the comparison.
Rail traffic was completely flat YoY due primarily to coal, but 12 of 20 carload types had YoY negative comparisons:
The American Association of Railroads reported that total rail traffic was essentially unchanged YoY, up only +0.1%. Non-intermodal rail carloads were again off a substantial -2.9% YoY or -8,700, once again entirely due to coal hauling which was off -13,100. Negative comparisons expanded from 8 to 12 types of carloads. Intermodal traffic was up 8,400 or +3.9% YoY.
Turning now to the high frequency indicators for the global economy:
The TED spread declined sharply again to yet another new 52 week low of 0.27. The one month LIBOR also declined sharply to 0.2165, and also set another new 52 week low. Both are well below their 2010 peaks and in the middle (TED) or low end (LIBOR) of teir respective 3 year ranges.
The Baltic Dry Index rose shaprly from 662, which was a 52 week low, to 774. This is only a one month high and the declining trend in shipping rates for the last 3 years is fully intact. The Harpex Shipping Index fell yet again, down 4 from 390 to 386, and is now only 11 above its February 52 week low.
Finally, the JoC ECRI industrial commodities index was essentially steady at 124.65 only up .01 from last week. It is still down YoY. This number has improved sharply over the last month.
The sharp bifurcation in the numbers continued. Housing sales, prices, and mortgage refinancing are all positive at this point. Consumers are yet again holding up like champions. Money supply remains strongly positive. It looks like Oil and gasoline prices may have temporarily peaked. Remember the Euro crisis? The TED spread and LIBOR say it is back to simmering on the back burner.
At the same time manufacturing and employment indicators continue to falter, as measured by increasing first time jobless claims and a stalled temporary staffing index (although treasury deposits have turned quite positive again). Gasoline usage is negative again. Rail traffic looks poor, with no YoY growth and 12 of 20 carload groups negative. Shipping rates remain poor.
So long as housing, cars, and consumer spending hold up I remain very cautiously optimistic. At the same time it is apparent that the global slowdown or contraction is dragging down US manufacturing, and that plus the Oil choke collar have begun to affect employment. As usual, I will continue to focus on gasoline prices and the consumer.
Have a good weekend.
Friday, September 21, 2012
Weekend Weimar, Beagle and Pit Bull


NDD will be here tomorrow with the weekly numbers; I'll be back on Monday. Until then...
Housing Rebound Continues
NDD and I have written pretty extensively about the housing market and how both of us think it's one of the possible bright spots for the economy going forward. Earlier this week, we hear more news about the rebound (from Marketwatch):
Sales of existing homes surged 7.8% in August to the best level in more than a year as low interest rates and a slowly improving jobs market help fuel a rebound in activity.
Sales of existing homes surged 7.8% in August to the best level in more than a year as low interest rates and a slowly improving jobs market help fuel a rebound in activity.
The National Association of Realtors said sales rose to a seasonally
adjusted annual rate of 4.82 million from July’s 4.47 million, which was
better than the 4.6 million expected in a MarketWatch-compiled
economist poll.
The level was the highest since May 2010 and the percentage gain was strongest since August 2011. U.S. stocks
SPX
-0.05%
saw a quick spike after the data was released, and have moved in a see-saw manner ever since.
Read Market Snapshot.
Compared to the same period of 2011, sales were up 9.3%, the 14th straight month of year-on-year gains.
Each of the four major regions saw monthly gains in the order of 7% to 8%.
About a third of homes were sold in a month and the median time it took
to sell a house was 70 days, up slightly from 69 days in July but down
from 92 days at the same time last year.
Fueled by low interest rates and pent-up demand, home sales have
improved considerably from their recession-era lows, but still are well
below the 2005 peak of just over 7 million.
Morning Market Analysis


On the SPYs daily chart (bottom chart) we see that prices have consolidated in a downward sloping pennant pattern, moving into the 10 day EMA for technical support. This is a standard consolidation move after a move higher. The top chart (which is a 30 minute chart) shows the consolidation in more detail. The underlying technicals on the lower chart are still positive -- all the EMAs are moving higher, the MACD is bullish and the CMF is positive.

The IEF chart shows that the treasury market is consolidating in a pennant pattern. However, notice the weakening MACD and very negative CMF reading. Also notice that the EMAs now have a slightly lower trend to them.


Like the equity market, gold has been consolidating its gains this week. The top chart -- the 30 minute chart -- shows that prices have rallied three times in the last month, followed by periods of consolidation. We see the same situation on the daily chart in the lower chart. Also note the very bullish orientation of the lower chart -- rising EMAs, rising MACD and strong CMF position.

The weekly copper chart shows that prices are still consolidating at low levels. There is a slightly rising trend line on the bottom. I've drawn a horizontal line on the top because we don't know where the exact trend line is right now -- it would be just as appropriate to draw a rectangle around the the last years worth of price action.
Thursday, September 20, 2012
The Bank of Japan's Action
First, let's start with the BOJ's opinion about the economy:
The pick-up in Japan's economic activity has come to a pause.
Exports and industrial production have been relatively weak as overseas economies have moved somewhat deeper into a deceleration phase. On the other hand, domestic demand has been resilient, mainly supported by reconstruction related demand. Specifically, public investment has continued to increase. Business fixed investment has been on a moderate increasing trend with improvement in corporate profits. Private consumption has been resilient with the employment situation on an improving trend. Housing investment has generally been picking up.
With regard to the outlook, Japan's economy is expected to level off more or less for the time being, and thereafter, it will return to a moderate recovery path as domestic demand remains resilient and overseas economies gradually emerge from the deceleration phase.
The analysis starts with a simple sentence: the economy has come to a pause. From a central bank writing perspective, that's a bold statement, and one that is remarkably blunt. However, it's also accurate.
 After the 1.9% bump four quarters ago, Japan has stalled, which is of obvious concern to the BOJ.
Also note the bank focuses on the inter-relationship between Japan and the rest of the world. Remember -- Asia has built its economy through exports; when the rest of the world slows down, Asia gets a cold. That is clearly happening now. As exports have slowed, industrial production has also decreased.
Domestically, things are fair; we see that demand is moderate and business investment is OK. But growth is clearly not going gangbusters. It's also dependent (still) on reconstruction related efforts, not intrinsic growth and the resultant demand.
Also consider this analysis of the possible policy outcomes:
Regarding risks, there remains a high degree of uncertainty about the global economy, including the prospects for the European debt problem, the momentum toward recovery for the U.S. economy, and the likelihood of emerging and commodity-exporting economies simultaneously achieving price stability and economic growth. Furthermore, attention should be paid to the effects of financial and foreign exchange market developments on economic activity and prices.
While we know full well about the EU and US situation, consider the points the bank is making about the emerging, export-oriented economies. As the world economy heats up, two things happen simultaneously: these economies grow from the increase in export orders and prices increase as commodity prices rise due to increased demand. Hence the inherent problem facing these economies of "price stability and growth."
From a policy perspective, other central banks have started to increase their monetary easing. This, by definition, should lower the value of their respective currencies in relation to the yen. Hence, the real need to the BOJ to announce this:
The Bank decided to increase the total size of the Program by about 10 trillion yen, from about 70 trillion yen to about 80 trillion yen. The increase in the size of the Program corresponds with the size of additional purchases of treasury discount bills (T-Bills) by about 5 trillion yen and Japanese government bonds (JGBs) by about 5 trillion yen.
The pick-up in Japan's economic activity has come to a pause.
Exports and industrial production have been relatively weak as overseas economies have moved somewhat deeper into a deceleration phase. On the other hand, domestic demand has been resilient, mainly supported by reconstruction related demand. Specifically, public investment has continued to increase. Business fixed investment has been on a moderate increasing trend with improvement in corporate profits. Private consumption has been resilient with the employment situation on an improving trend. Housing investment has generally been picking up.
With regard to the outlook, Japan's economy is expected to level off more or less for the time being, and thereafter, it will return to a moderate recovery path as domestic demand remains resilient and overseas economies gradually emerge from the deceleration phase.
The analysis starts with a simple sentence: the economy has come to a pause. From a central bank writing perspective, that's a bold statement, and one that is remarkably blunt. However, it's also accurate.

Also note the bank focuses on the inter-relationship between Japan and the rest of the world. Remember -- Asia has built its economy through exports; when the rest of the world slows down, Asia gets a cold. That is clearly happening now. As exports have slowed, industrial production has also decreased.
Domestically, things are fair; we see that demand is moderate and business investment is OK. But growth is clearly not going gangbusters. It's also dependent (still) on reconstruction related efforts, not intrinsic growth and the resultant demand.
Also consider this analysis of the possible policy outcomes:
Regarding risks, there remains a high degree of uncertainty about the global economy, including the prospects for the European debt problem, the momentum toward recovery for the U.S. economy, and the likelihood of emerging and commodity-exporting economies simultaneously achieving price stability and economic growth. Furthermore, attention should be paid to the effects of financial and foreign exchange market developments on economic activity and prices.
While we know full well about the EU and US situation, consider the points the bank is making about the emerging, export-oriented economies. As the world economy heats up, two things happen simultaneously: these economies grow from the increase in export orders and prices increase as commodity prices rise due to increased demand. Hence the inherent problem facing these economies of "price stability and growth."
From a policy perspective, other central banks have started to increase their monetary easing. This, by definition, should lower the value of their respective currencies in relation to the yen. Hence, the real need to the BOJ to announce this:
The Bank decided to increase the total size of the Program by about 10 trillion yen, from about 70 trillion yen to about 80 trillion yen. The increase in the size of the Program corresponds with the size of additional purchases of treasury discount bills (T-Bills) by about 5 trillion yen and Japanese government bonds (JGBs) by about 5 trillion yen.
A Week Of Central Bank Action
Last week, several central banks set policy for the month.
Let's start with the Central Bank of New Zealand's global outlook:
New Zealand’s trading partner outlook remains weak. The Bank continues to predict below-Consensus global growth. The risk of a more severe outcome remains. The cost of bank funding relative to the 90-day interest rate is expected to remain elevated over the projection due to ongoing strains in overseas funding markets.
In the euro area, while developments over the past three months have been interpreted by markets as relatively positive, it is by no means clear that the risk of significant economic deterioration has been eliminated. Until euro-area government debt is on a sustainable medium-term path the risk of rapid changes in marketsentiment will persist. The Bank continues to expect euro-area activity to contract over the coming year. Beyond this, only modest recovery is forecast (figure 2.2).
Growth in the United States economy continues to be modest. However, its near-term outlook is subject to considerable uncertainty and downside risk, related to the substantial fiscal tightening that is currently legislated to occur at the start of next year.
In China, economic data continue to soften, with GDP growth falling further. Falling investment growth has reduced global demand for industrial commodities, with Australia’s terms of trade suffering as a result.
Importantly, the ability to support global activity using conventional policy levers is quite limited. Many advanced economies already have policy interest rates at or near zero, and public debt has already increased markedly since the global financial crisis.
While the markets have interpreted the recent EU moves positively (The German high court ruling, the ECB's recent) the entire continent is mired in a recession right now, which has spread out to the UK. There is little reason to think this situation will improve in the near future. The bank also correctly analyzes the US' situation -- we're in a weak position with the possibility of a major policy shock should the fiscal cliff materialize.
They also make an important observation: there isn't much more most central banks can do at this point. That's a big problem.
Let's turn to the South Korean Central Bank's recent policy statement:
Based on currently available information, the Committee considers the economic recovery in the US to have weakened somewhat and the sluggishness of economic activities in the euro area to have deepened. Growth has continued to slow in emerging market countries as well, due mostly to the impact of the economic slumps in advanced countries. The Committee expects the pace of global economic recovery to be very modest going forward and judges the downside risks to growth to be large, owing chiefly to the spillover of the euro area fiscal crisis to the real economy and to the possibility of the so-called fiscal cliff materializing in the US.
We see a similar analysis, although from a cause and effect perspective; the slowdown in the large economies is driving the slowdown in emerging economies. Also note the second mention of the US' fiscal cliff.
The Central Bank of Chile also issued its policy report. They made the following observations about the international economy:
World growth has not changed significantly on aggregate, as compared to June;
however, its composition has changed somewhat. The most remarkable change is
that large emerging economies are slowing down more markedly than expected,
while developed economies have evolved as forecast, showing a meager and
slow recovery. Accordingly, world growth projections are revised downward, but
this time, the main adjustments come from the emerging world. Growth of our
trading partners as well as of the PPP-weighted world for 2012 have been revised by one tenth of a point at 3.5 and 3.1%, respectively (table I.1).
The main emerging economies are now feeling the effects of the complex
international scenario. The GDP of China grew 7.6% y-o-y in the second quarter
of the year, as compared to the 8.1% of the first quarter and the 9.2% of 2011,
which evidences the slowdown it is undergoing. The most recent indicators show
that this slowdown has continued. Exports to the European market show a year-on-year drop, and retail sales and loans have also slowed down (figure I.1).
This outlook has resulted in a sharp downward adjustment of growth projections
in this country. While the projection included in the September Monetary Policy
Report stated an 8.3% and 8.7% expansion of the Chinese economy in 2012
and 2013, respectively, this Report projects 7.8% and 8.1% for those same
years (box I.1). Other Asian economies record increasingly lower y-o-y growth
rates —even negative in some cases— greatly affected by the performance of
their main trading partners, particularly, developed economies and other Asian
countries. In India, the the slowdown is also related to fiscal and energy problems, among other factors.
One distinctive aspect in the last few months in several developed and emerging
economies has been the weak performance of their manufacturing industries.
Surveys of purchasing managers in several of these countries indicate that this
will extend into the following months (figure I.2).
In Latin America, the outlook is still rather heterogeneous. The most remarkable
fact is Brazil’s significant slowdown, whose size largely accounts for the
downward revision of the growth forecast for the region for this and next year.
However, a recovery is expected going forward, resulting from the expansionary measures implemented by its authorities. These measures include the reductionv of its monetary policy interest rate by 350 basis points in the year to date and a fiscal stimulus plan amounting to US$65 billion. Colombia and Argentina have also evidenced slowdown signs. However, other economies in the region, such as Peru and Mexico, are still growing strongly. Peru’s growth is being driven by forces similar to those driving the Chilean economy and by an important effect of mining investments. In turn, Mexico’s growth during the first half of the year exceeded expectations; however, the effects of its weakened external sector will become more clearly visible in the near future, which is now being suggested by the slowdown signs of its manufacturing industry.
The developed world is following a slow recovery path. In the United States,
although some indicators from the real estate industry and the labor market show a somewhat more positive margin, the overall assessment continues to be fragile. Add to this the discussion to prevent fiscal adjustments from being triggered in 2013. The market estimates suggest that, if attempts to reach agreements are unsuccessful, the cuts in expenses that would be implemented could reduce the growth of this economy by more than two percentage points in 2013. Besides, the discussion is being hindered by the proximity of the elections. Although the growth projections for the United States for 2012 are revised slightly upwards, this results from a correction of historical figures that is habitually done at this time of the year, rather than from a more favorable outlook for this economy.
The situation of the United Kingdom is also cause for concern, since its output fell for the third quarter running, as a result of a weakened external demand and a domestic demand that has been depleted by restrictive credit conditions and the fiscal consolidation program. In Japan, output in the last quarters has been favored by the reconstruction works, although more recent figures show degraded expectations.
In the Eurozone, output will continue to ail, with significant differences among its member countries. Peripheral economies have been contracting for several quarters now, while others, including Germany, are still growing (table I.2). However, the weakness of some recent indicators from Germany is cause for concern, particularly those related to domestic consumption, this compounded by the weak performance of its exports and manufactures, could imply a slowdown in the coming months. Nevertheless, some countries in the region have had to apply fiscal adjustment plans, credit conditions are still undergoing a continuing restriction, uncertainty restrains investment plans and, the deleveraging process also continues. The meager growth of this area weakens the intra-regional trade, but it helps to solve the imbalances within the region while exchange rate and wage rigidities persist.
Again, there is more or less unanimous agreement about the overall state of affairs.
Morning Market Analysis

Over the last three trading sessions, oil has sold off sharply; it has fallen through all the shorter EMAs and is now trading below support established in mid-July. This occurred on a fairly sharp rise in volume. The MACD has also giving a sell signal (and has been declining for a few months), while the CMF is printing negative.

Yesterday, the Bank of Japan announced further easing measures. The above chart is a good part of the reason why. The yen has been consolidating a fairly high levels for most of the last 4-5 months. The reason is that Japan has developed a safe haven status in the current turbulent EU world. However, as Japan is still an export oriented economy, this is not a situation the BOJ wants to see continue, hence the easing.

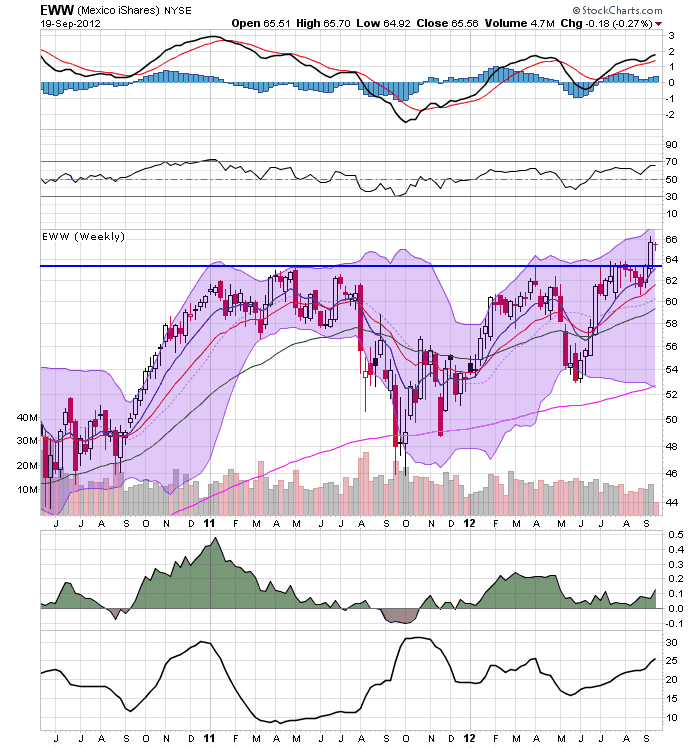
Over the last few trading sessions, the Mexican market has broken out on both the daily (top chart) and weekly chart (lower chart). Overall, the Mexican economy has performed fairly well over the last few years. But the reason for the break-out is most likely tied to their oil exporter status and oils until recent rise.

The weekly chart of the Canadian market shows consolidation between the ~25.5 and 29 price level -- which also happens to be right around the 200 week EMA. The key for this chart is (obviously) whether it moves higher. The underlying technicals support that move -- the MACD is moving higher and has given a buy signal, while the CMF is positive. If we do see break-out expect a continued move; there is plenty of real estate to cover.
Wednesday, September 19, 2012
Bonddad Linkfest
- When the US sneezes at the edge of a cliff, the world gets a cold (Alphaville)
- FedEx trims years revenue forecasts (BB)
- Reserve Bank of India's interest rate decision (RBI)
- Empire state manufacturing index has second negative month (NYFed)
- RBA minutes (RBA)
- Romney Woes Jangle GOP (Politico)
- Romney RIP? Not so fast (Politico)
John Taylor; the Dumbest "Smart" Person Alive
Just when you think someone can't prove that their politics have completely blinded them to reality ...
From his latest blog posting:
Here is an update of the chart that compares the change in the employment to population ratio in this recovery with the recovery from the deep slump of the early 1980s. This percentage dropped a little in August, but the big story is that there has never been a lift off.

First, notice that again he's comparing the latest expansion to 1980, despite the fact this is an apples to oranges comparison. The 1980s recovery was from a Fed induced slowdown to cool inflation (which worked, by the way), while the current recovery is a debt-deflation recovery, which, by definition is far slower. The reason he's doing this is obvious -- his primary readership worships at the alter of St. Reagan.
Second, let's look at the employment to population ratio over the long-term.

Notice that starting in the 1980s the trend continually increases until just after 2000 when it starts to decline. In other words, something started in the early 1980s that was larger than simply the beginning of an expansion. Why was that happening?
1.) Women entered the labor force.

Notice that the percentage of women working has been increasing for most of the length of series, falling only over the last 10-12 years. You may remember a movement called the "women's liberation movement" which opened the door to women in the workplace? That's a big reason for the increase.
Secondly, starting in the 1980s we get the baby boomers hitting their professional stride. Starting around 1980, the baby boomers were about 40 years old, and as they hit their prime working years, they entered the labor force, hence a second reason for the increase in the employment to population ratio.
So -- why the decline now?
1.) As the baby boomers have moved through the labor force, they are now just starting to retire. This was the conclusion of a report issued by the Chicago Federal Reserve earlier this year.
2.) Younger people are staying in school longer and not working -- hence the reason for the decline among teenagers. Consider this chart of unemployment for the 16-19 age group:

Yes -- it's high. But these people are supposed to be students.

The LPR for the 16-19 year old age group has been declining for the last decade. This is not something we should be wringing out hands about; people in this age group are not the primary breadwinners in their respective families for the most part.
Once again, Taylor has sacrificed his professional reputation in order to make a political argument -- and one which is not backed by the facts (yet again). I realize this doesn't mean anything to most of his readers, but at some point someone in his department should ask him what in the hell he's writing about.
Morning Market Analysis

The German market has rebounded from the lows over the early summer and are now right at the 61.8% Fib level. Prices have been trading around the 200 week EMA for the last year, so we need to see a continued move higher before declaring a bull run. But, the underlying technicals are strong with a rising MACD and CMF.


Both the Italian markets (top chart) and Spanish markets (bottom chart) have rallied from their mid-summer lows. Both had strong volume surges in the early summer sell-off, which could be considered a selling climax. This makes sense, given the fundamental events of the last few months. However, prices are still below the 200 week EMA, so we're not out of the woods yet. But -- markets are leading indicators.

The french market is still trading in a range from the sell-off last year. Prices need to move beyond the 23 price handle for the market to break out.

The euro has continued its move higher after breaking out from the downward sloping, year-long channel. Prices are now at the 61.8% Fib level of the multi-year channel.
For all of these charts, don't be surprised to see some profit taking over this and next week. All these markets have moved quickly in response to a change in the fundamental events, but there is still profound weakness in these economies.
Tuesday, September 18, 2012
Recession Watch
Last week, in addition to my post on the ISM manufacturing index's latest anecdotal data, NDD posted on the weak industrial production number. He also mentioned the work "recession," which got me thinking about where we are in the business cycle.
So, let's turn to the NBER's recession information webpage to see what they look for.
The NBER's Business Cycle Dating Committee maintains a chronology of the U.S. business cycle. The chronology comprises alternating dates of peaks and troughs in economic activity. A recession is a period between a peak and a trough, and an expansion is a period between a trough and a peak. During a recession, a significant decline in economic activity spreads across the economy and can last from a few months to more than a year. Similarly, during an expansion, economic activity rises substantially, spreads across the economy, and usually lasts for several years.
In both recessions and expansions, brief reversals in economic activity may occur-a recession may include a short period of expansion followed by further decline; an expansion may include a short period of contraction followed by further growth. The Committee applies its judgment based on the above definitions of recessions and expansions and has no fixed rule to determine whether a contraction is only a short interruption of an expansion, or an expansion is only a short interruption of a contraction. The most recent example of such a judgment that was less than obvious was in 1980-1982, when the Committee determined that the contraction that began in 1981 was not a continuation of the one that began in 1980, but rather a separate full recession.
The Committee does not have a fixed definition of economic activity. It examines and compares the behavior of various measures of broad activity: real GDP measured on the product and income sides, economy-wide employment, and real income. The Committee also may consider indicators that do not cover the entire economy, such as real sales and the Federal Reserve's index of industrial production (IP). The Committee's use of these indicators in conjunction with the broad measures recognizes the issue of double-counting of sectors included in both those indicators and the broad measures. Still, a well-defined peak or trough in real sales or IP might help to determine the overall peak or trough dates, particularly if the economy-wide indicators are in conflict or do not have well-defined peaks or troughs.
The same webpage also has an Excel spreadsheet of data which contains GDP, employment, real income less transfer payments and manufacturing sales.
First, let's look at what caused concern on NDDs part -- the chart of industrial production.

While the number rebounded from it's recession lows, the number has been near a fairly constant level for the last 8 months. We've seen some moderate increases, but the data series has clearly lost upside momentum.
Let's look at some of the other data the NBER uses to date recessions.

After leveling off for most of 2011, real personal income less transfer payments has been increase smartly over the last few months.


The top chart shows the percentage change from the previous year in real GDP. Notice the rate of growth is right around 2%. This is not a great rate of growth, but at least it's positive. The bottom chart shows total GDP which is now higher than recession levels.


The top chart shows total civilian employment as expressed in the household survey. Notice that it has been steady (right around 142,000) for the last seven months. The lower chart shows the establishment survey, which has been inching higher.


The NBER also likes to look at "real manufacturing and trade sales." Unfortunately, there isn't a good, single statistic for this. The top chart shows new orders for machine orders, which has been at a steady level for awhile (at least a year, if not longer). The second chart shows the ISM new orders index, which has printed below 50 for the last three months. However, real investment in equipment and software as expressed in the quarterly GDP reports shows a continual increase. I don't like total durable goods orders as they are way too volatile thanks to transportation orders.
The above data shows there is weakness, primarily in the manufacturing area. This is largely due to the weakening situation in the EU and Asia. Additionally, there are mixed signals in the employment reports. The household survey shows a stagnating employment picture while the establishment survey shows growth, albeit at a slow rate. These two areas of weakness line-up with the overall weak GDP growth rate of about 2% Y/O/Y. The good news above is in the income less transfer payments category, which is increasing.
Put another way, the US economy is barely growing and is susceptible to shocks.
So, let's turn to the NBER's recession information webpage to see what they look for.
The NBER's Business Cycle Dating Committee maintains a chronology of the U.S. business cycle. The chronology comprises alternating dates of peaks and troughs in economic activity. A recession is a period between a peak and a trough, and an expansion is a period between a trough and a peak. During a recession, a significant decline in economic activity spreads across the economy and can last from a few months to more than a year. Similarly, during an expansion, economic activity rises substantially, spreads across the economy, and usually lasts for several years.
In both recessions and expansions, brief reversals in economic activity may occur-a recession may include a short period of expansion followed by further decline; an expansion may include a short period of contraction followed by further growth. The Committee applies its judgment based on the above definitions of recessions and expansions and has no fixed rule to determine whether a contraction is only a short interruption of an expansion, or an expansion is only a short interruption of a contraction. The most recent example of such a judgment that was less than obvious was in 1980-1982, when the Committee determined that the contraction that began in 1981 was not a continuation of the one that began in 1980, but rather a separate full recession.
The Committee does not have a fixed definition of economic activity. It examines and compares the behavior of various measures of broad activity: real GDP measured on the product and income sides, economy-wide employment, and real income. The Committee also may consider indicators that do not cover the entire economy, such as real sales and the Federal Reserve's index of industrial production (IP). The Committee's use of these indicators in conjunction with the broad measures recognizes the issue of double-counting of sectors included in both those indicators and the broad measures. Still, a well-defined peak or trough in real sales or IP might help to determine the overall peak or trough dates, particularly if the economy-wide indicators are in conflict or do not have well-defined peaks or troughs.
The same webpage also has an Excel spreadsheet of data which contains GDP, employment, real income less transfer payments and manufacturing sales.
First, let's look at what caused concern on NDDs part -- the chart of industrial production.

While the number rebounded from it's recession lows, the number has been near a fairly constant level for the last 8 months. We've seen some moderate increases, but the data series has clearly lost upside momentum.
Let's look at some of the other data the NBER uses to date recessions.
After leveling off for most of 2011, real personal income less transfer payments has been increase smartly over the last few months.


The top chart shows the percentage change from the previous year in real GDP. Notice the rate of growth is right around 2%. This is not a great rate of growth, but at least it's positive. The bottom chart shows total GDP which is now higher than recession levels.


The top chart shows total civilian employment as expressed in the household survey. Notice that it has been steady (right around 142,000) for the last seven months. The lower chart shows the establishment survey, which has been inching higher.


The NBER also likes to look at "real manufacturing and trade sales." Unfortunately, there isn't a good, single statistic for this. The top chart shows new orders for machine orders, which has been at a steady level for awhile (at least a year, if not longer). The second chart shows the ISM new orders index, which has printed below 50 for the last three months. However, real investment in equipment and software as expressed in the quarterly GDP reports shows a continual increase. I don't like total durable goods orders as they are way too volatile thanks to transportation orders.
The above data shows there is weakness, primarily in the manufacturing area. This is largely due to the weakening situation in the EU and Asia. Additionally, there are mixed signals in the employment reports. The household survey shows a stagnating employment picture while the establishment survey shows growth, albeit at a slow rate. These two areas of weakness line-up with the overall weak GDP growth rate of about 2% Y/O/Y. The good news above is in the income less transfer payments category, which is increasing.
Put another way, the US economy is barely growing and is susceptible to shocks.
Morning Market Analysis


The good news here is that grain prices may be moving lower.

The dollar chart shows that prices are now below an important trend line, moving lower in response to the Fed's actions last week. Prices hit the 200 week EMA over the summer and have been moving lower since. Now we see the shorter EMAs moving lower as well. The next logical price target is 21.

The Brazian real has traded with a slight, upward trajectory since the beginning of the summer. This was after a fairly severe sell-off as markets realized that the Brazilian economy was slowing down. However, now with more stimulus actions in place, the market is warming to the fact that the worst, at least. could be over. But, there really isn't a reason to move a lot of money into this market yet. While the bleeding has stopped, there are still fairly major problems for the economy to overcome.

After bottoming just below the 16 price level, the industrial metals market has moved sharply higher. However, moves of this severity are usually followed by a pullback as traders question the underlying reasons for the move -- and take profits. Also note that there are strong fundamental reasons for traders to question this latest move -- we're seeing a broad-based slowdown in the manufacturing sector which is the primary consumer of industrial metal.
Monday, September 17, 2012
Bonddad Linkfest
- US retail sales up .9% (Census)
- PPI up 1.7% (BLS)
- CPI up .6% (BLS)
- Singapore in danger of recession (FT)
- US files WTO complaint against China (FT)
- MBS yields tumble (FT)
- Paul Ryan calls for fewer jobs and higher unemployment (DeLong)
- Do tax cuts lead to economic growth (NYT)
- Why is Romney losing? (TPM)
- Inside the Romney Plan (Politico)
Four Key Market Breakouts Last Week

The energy sector ETF -- which has been consolidating for about a year and a half -- has broken through resistance.

The financial ETF broke through resistance the week before last; last week confirmed the move.

Technologies move last week confirmed a previous break-out.

The consumer discretionary sector moved higher for a second week.
Why Is the Fed Acting Now? And Why the MBS Market?
From the Fed's latest policy statement:
To support a stronger economic recovery and to help ensure that inflation, over time, is at the rate most consistent with its dual mandate, the Committee agreed today to increase policy accommodation by purchasing additional agency mortgage-backed securities at a pace of $40 billion per month. The Committee also will continue through the end of the year its program to extend the average maturity of its holdings of securities as announced in June, and it is maintaining its existing policy of reinvesting principal payments from its holdings of agency debt and agency mortgage-backed securities in agency mortgage-backed securities. These actions, which together will increase the Committee’s holdings of longer-term securities by about $85 billion each month through the end of the year, should put downward pressure on longer-term interest rates, support mortgage markets, and help to make broader financial conditions more accommodative.
So, why is the Fed acting Now?
First, remember that many people are of the opinion the Fed should have been acting a long time ago. Krugman and Thoma are both examples of people who have been calling for Fed action pretty consistently for at least a year, if not longer. I think you can also put DeLong in that camp.
Personally, I'm less inclined to think action is a good thing. Not because it's bad, but because I think we're seeing diminishing returns from the Fed's actions. While the first QE was helpful, we're seeing less bang for the buck from operation twist. And while expanding into the MBS market should help to suppress rates across a wider spectrum of markets, the low rates from the Treasury market are already helping in the mortgage area (treasuries and MBS are linked in the market to a certain extent). Consider this chart:

I also don't think the expectations game is that important -- that is, for the Fed to say, "we'll keep rates low until this date." And, frankly, I don't think that GDP targeting would really make that big an impact on the market or the economy. I think most market participants currently accept the fact that the Fed will be very loose with policy for a long time and that's enough.
The real problem we're facing is fiscal and not monetary. There is a large output gap in the economy that can really only be closed by fiscal spending which we're clearly not going to do. And Washington is run by a bunch of idiots -- we have the Republicans who live in a completely alternate universe and the Democrats who have no spine. As a result, the Fed's hand has been more or less forced by the market and the government's overall inaction.
I do think the Fed is acting now because they see a pronounced slowdown in employment over the last few months which runs against half of their duel mandate. Consider this graph:

Notice how the arc is slowing. In the last 5 months, we've seen less than 600,000 jobs created which is terrible and indicates there is something wrong in the economy. And in the latest BLS report, previous months figures were revised lower. I also think that Fed is aware that the power of their ammunition is decreasing with each move, so they are trying to time their actions to have the most impact possible.
That being said, I think Ben's choice of action is very interesting. As both NDD and I have noted, the housing market has bottomed and is moving higher. Granted, this is from a low base. But, we are seeing a turnaround. In addition, housing has been a primary driver of a majority of post-WWII recoveries. By buying MBS, the Fed is trying to maximize it's impact. Despite my reservations, it will work.
Morning Market Analysis


All three equity markets have now moved through key areas of resistance. The IWMs (top chart) did so last week, while the QQQs (middle chart) and SPYs (bottom chart) did so two weeks ago. In addition, all markets have been in a rally since the end of May. We also see rising MACDs, strengthening prices and rising EMAs which are also bullishly aligned. In short, what we have here is a rally.


The weekly treasury market charts are also indicating a bullish orientation. All have broken long-term trend lines and all show declining momentum. Note especially the weak bar on the TLTs (bottom chart) -- which represent the long end of the market.
Subscribe to:
Comments (Atom)