Friday, May 19, 2023

Housing update: sales have bottomed, prices in process


 - by New Deal democrat


No important economic news today. Yesterday existing home sales were released, but their economic impact isn’t all that important, except as it can confirm what has been happening with new houses under construction. And confirmation is what it gave us.


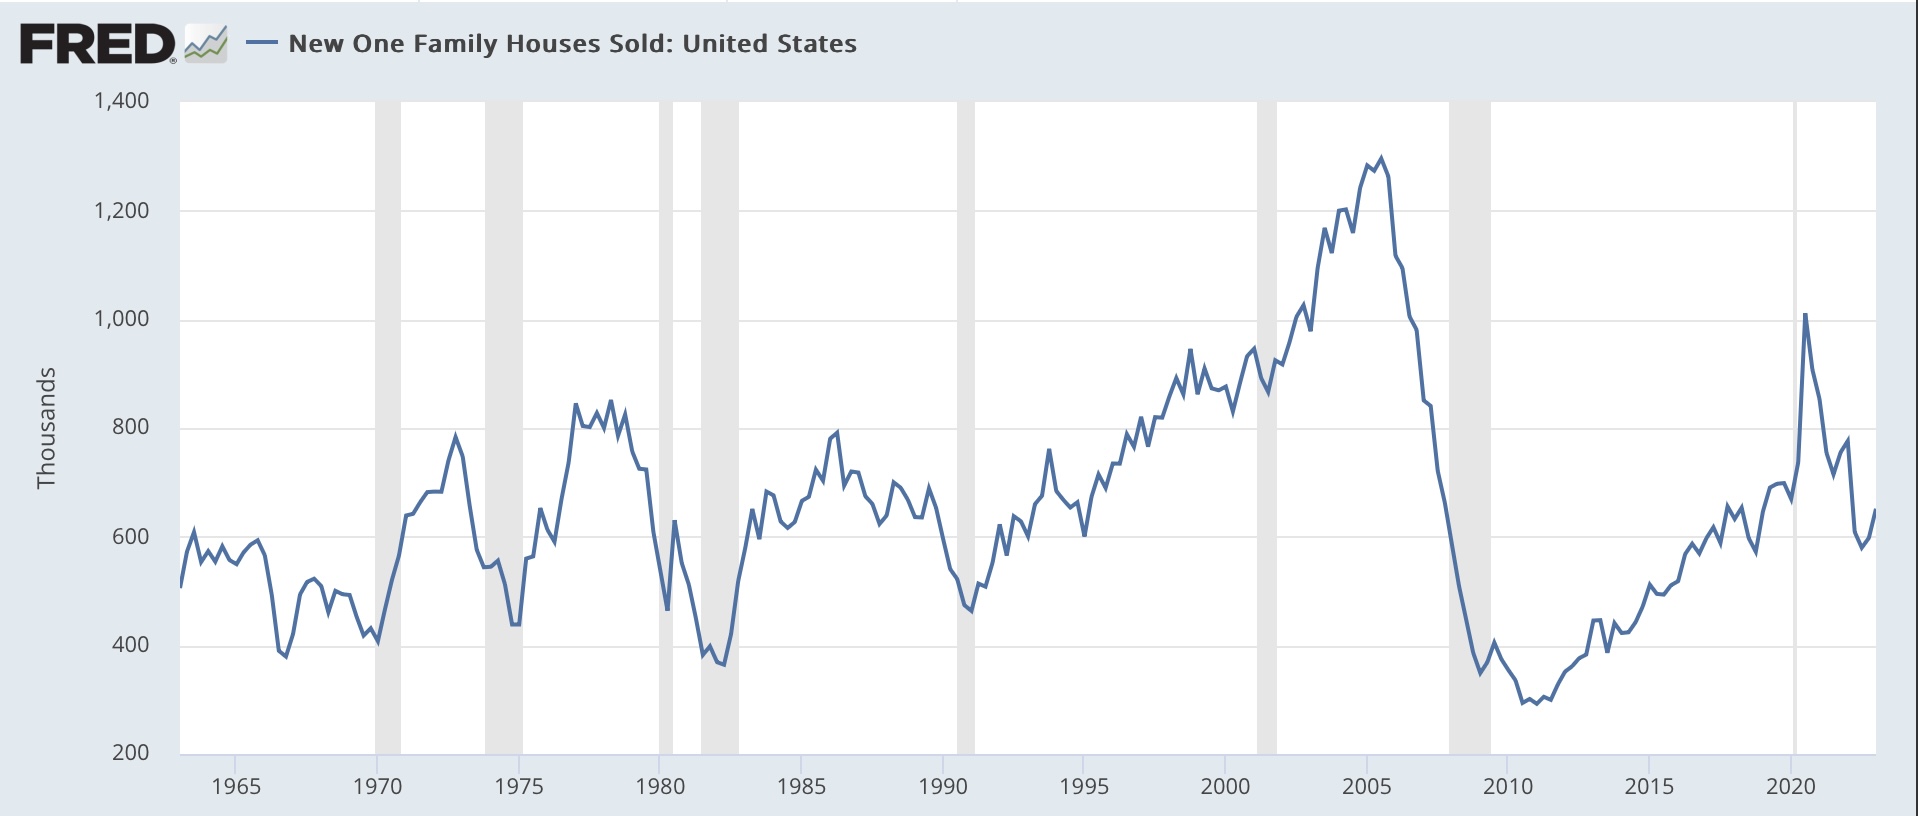
First, *sales* of houses have bottomed, following the peak in mortgage rates over 7% at the end of last October.

New home sales (which will be released for April on Monday) as is often the case, were the first to turn, having bottomed last July:


Existing home sales yesterday remained above their January bottom by a substantial margin:


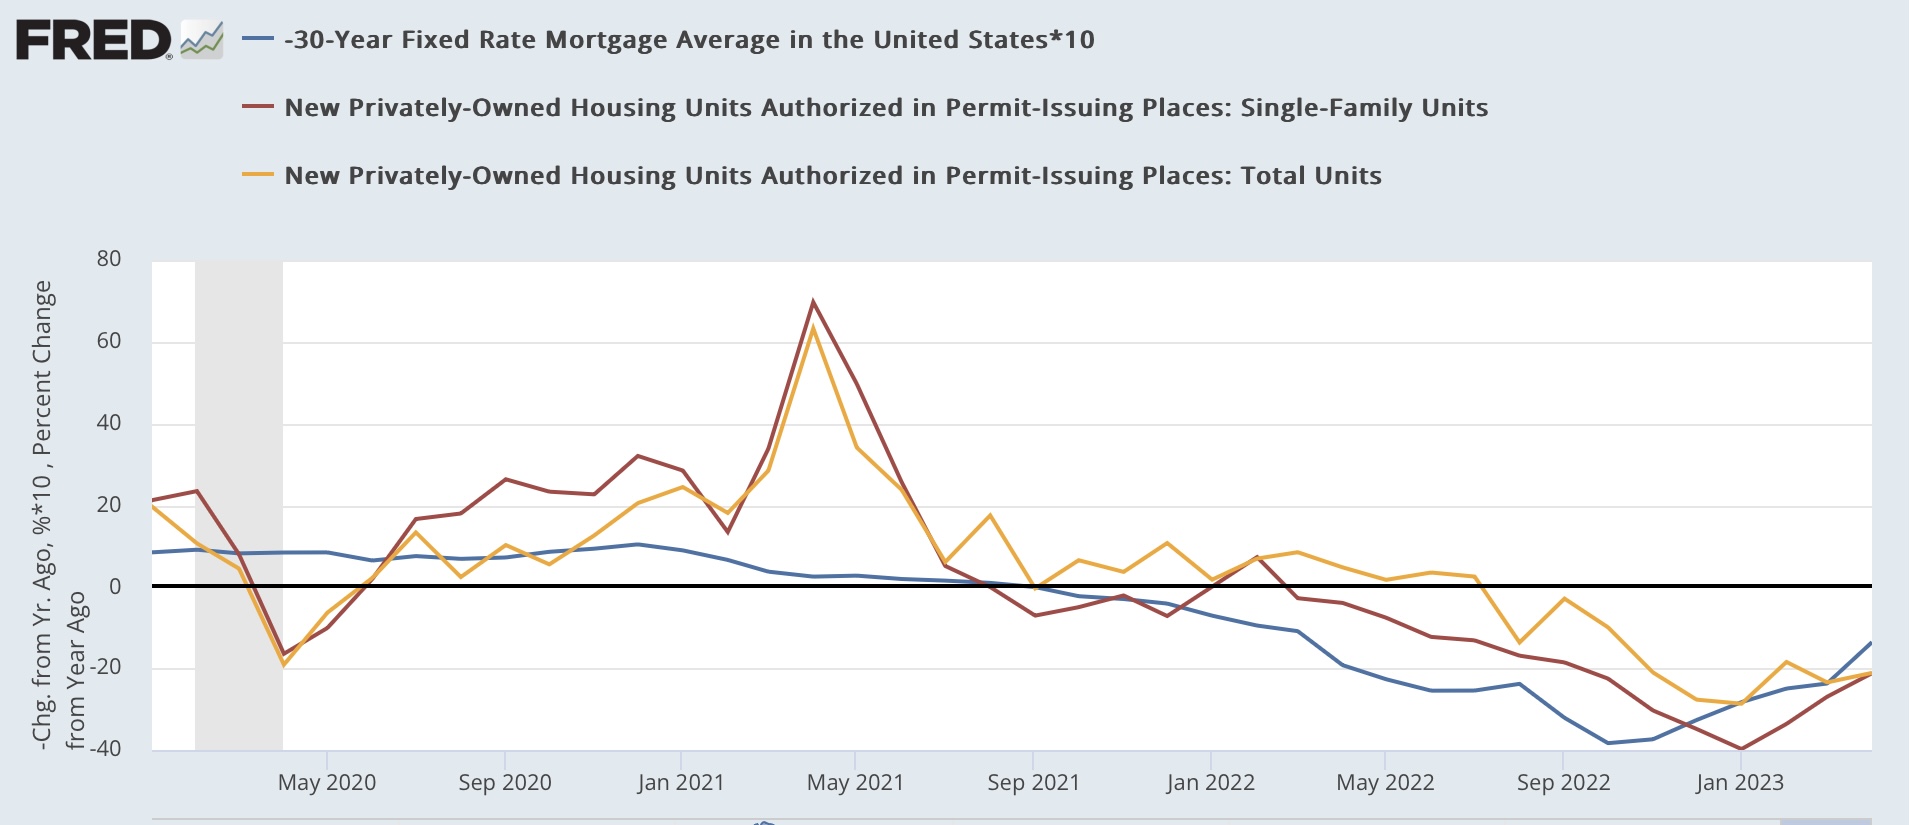
With one exception, housing permits and starts, as reported earlier this week, also bottomed in January:


As shown above, the big bounce came in single family units. While starts in multi-family units have continued to slowly increase, permits for multi-family units made a new low:


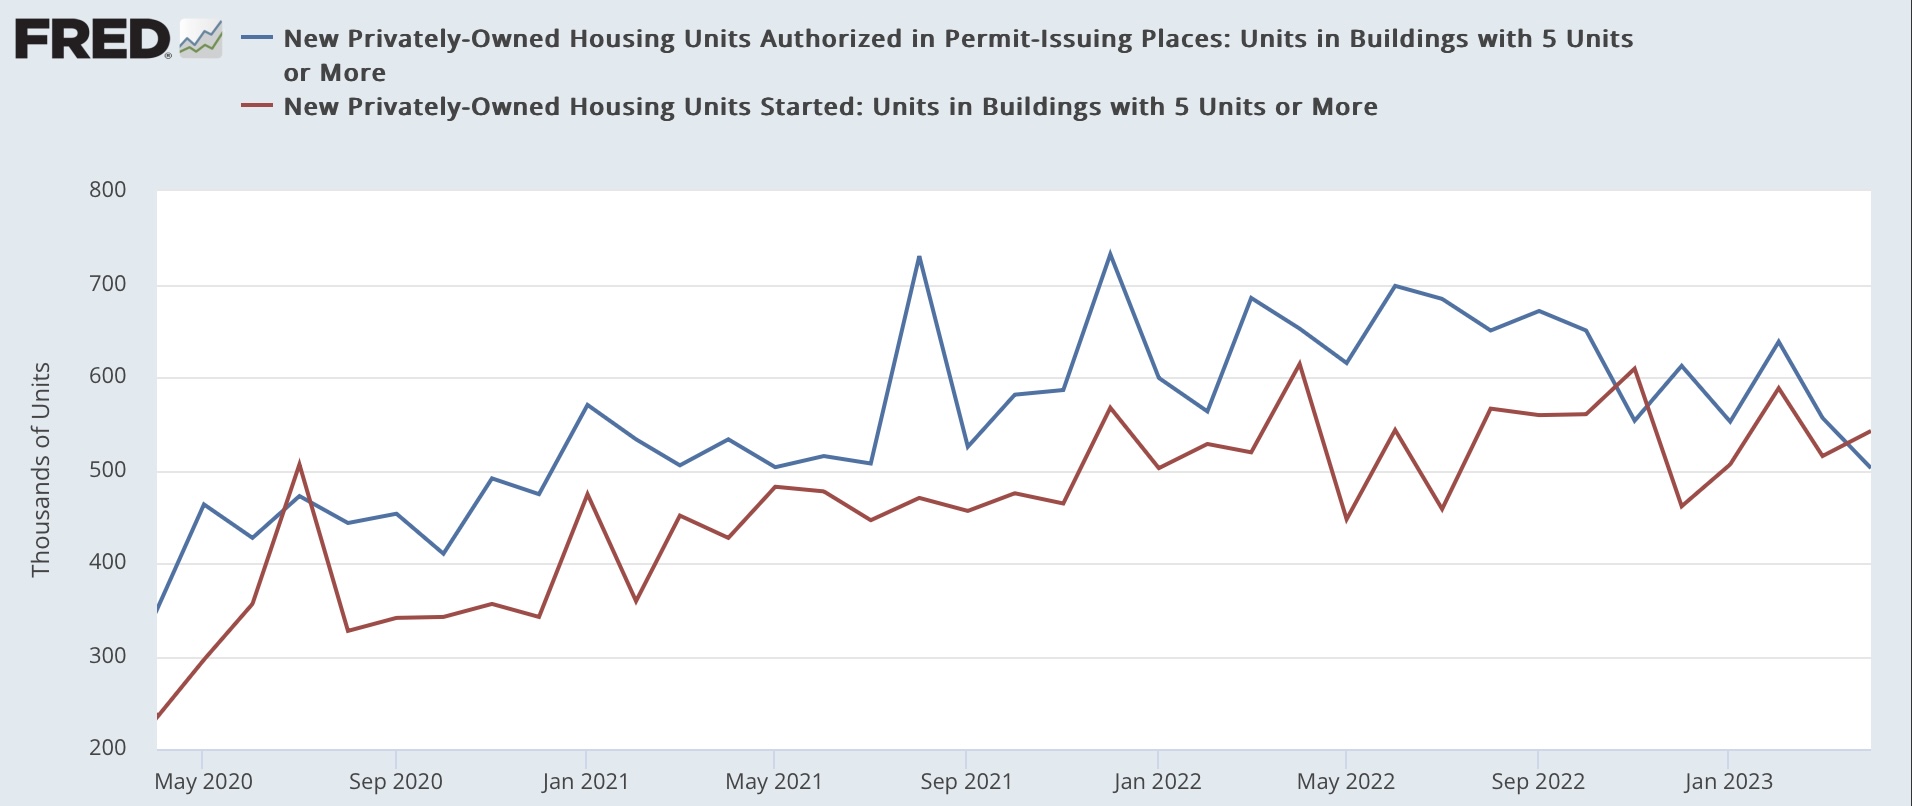
This suggests that multi-family units under construction have a ways to go before they turn down. As indicated the other day, total units under construction have turned down, but not by much:


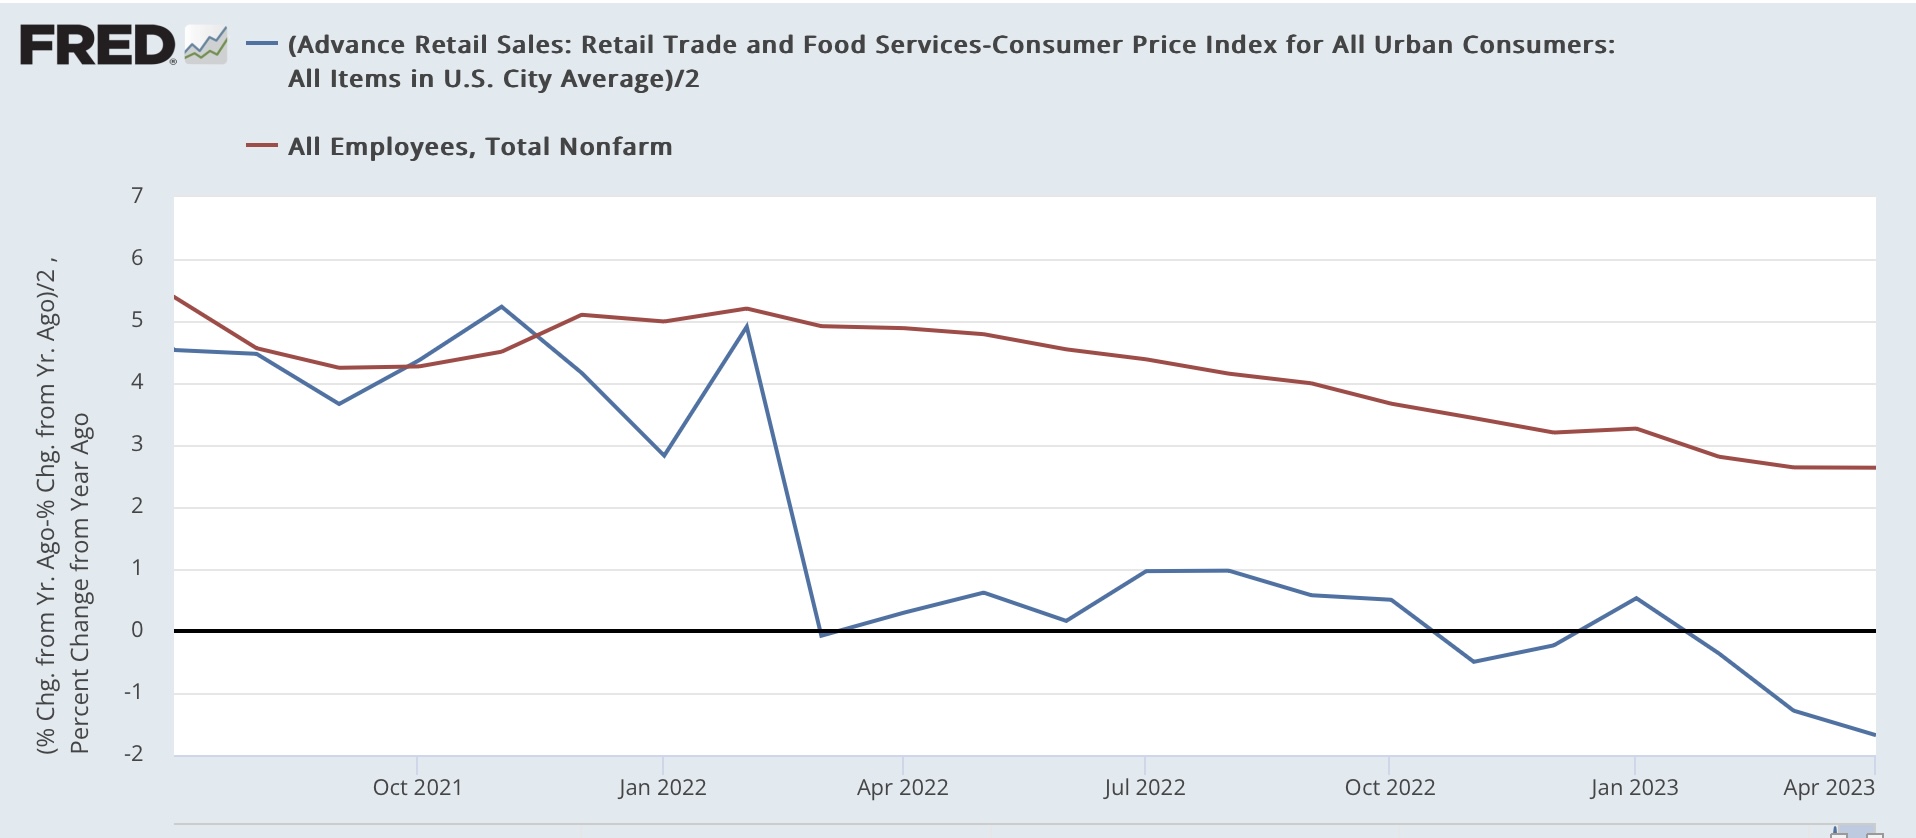
Turning to prices, we mainly have to measure YoY, since little of the data is seasonally adjusted.

Yesterday prices for existing homes were reported to have declined by -1.7%. The past two months have been the first YoY declines since the end of the housing bust over 10 years ago:


YoY median prices for new homes rose to +3.2%, after a single month of YoY decline in January. The below graph is averaged quarterly to cut down on noise:


Here the number is +1.4%.

The FHFA and Case-Shiller repeat sales indexes have only been updated through February, and show sharp YoY deceleration, but still increases of 4.0% and 2.0%, respectively:


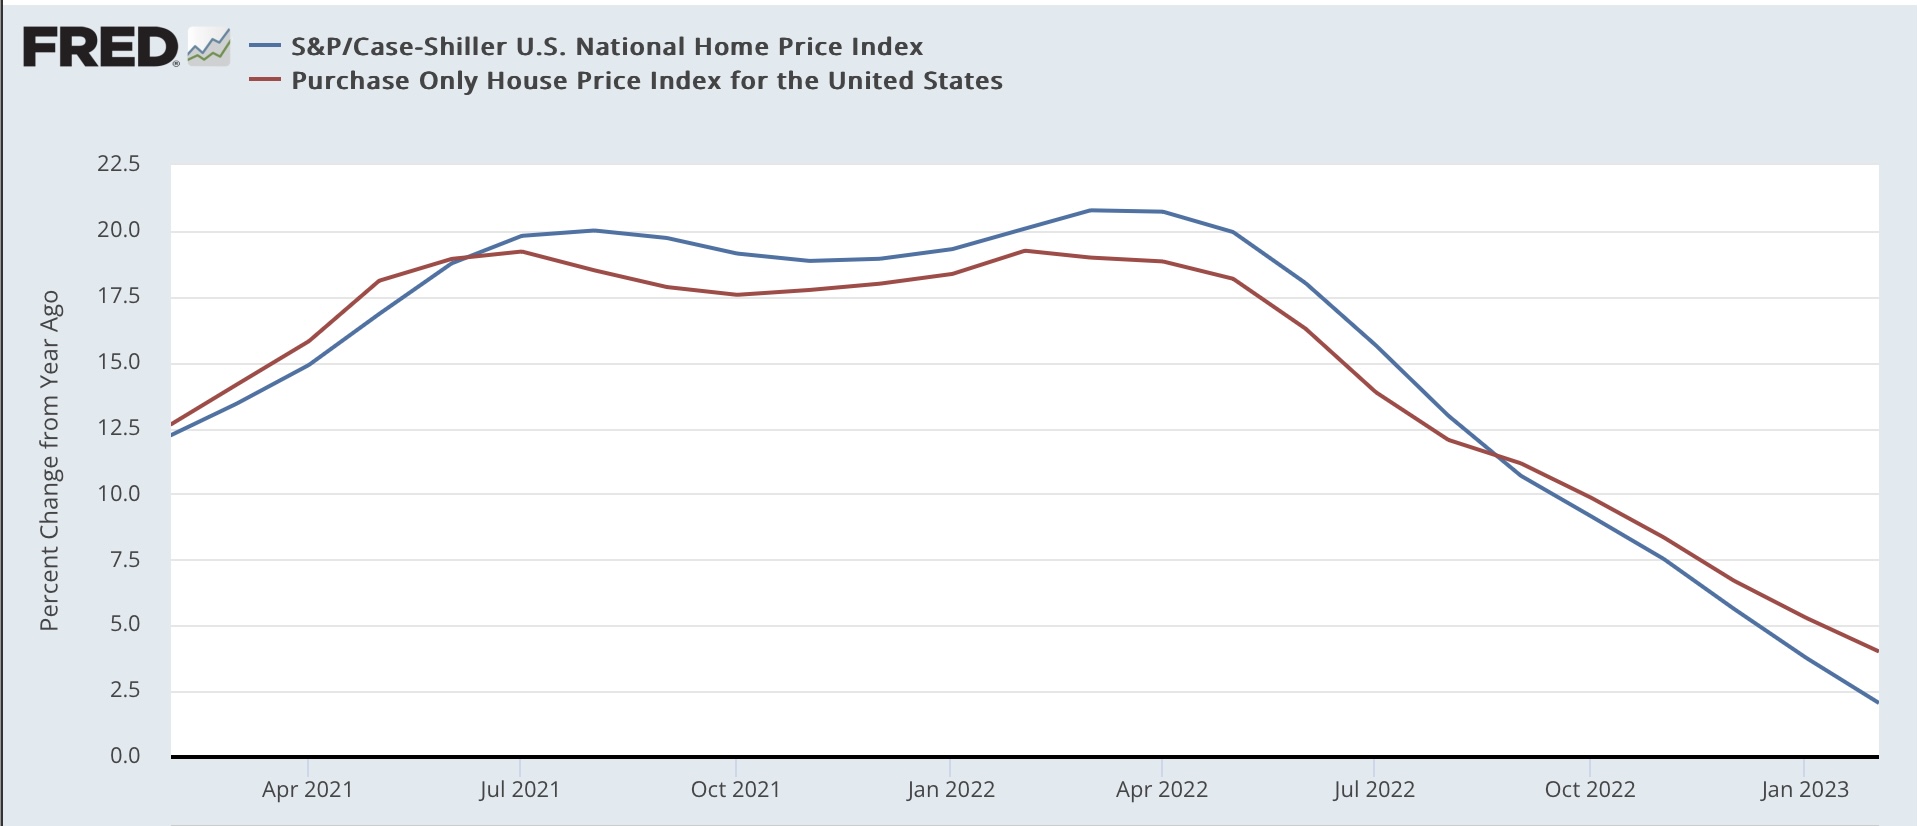
These two repeat sales indexes are seasonally adjusted, and show very minor declines of less than 1% and less than 3% respectively:


In absolute terms, prices may have bottomed as well.

The repeat sales indexes will be updated for March on May 30.

Thursday, May 18, 2023

Jobless claims: yellow caution flag persists


 - by New Deal democrat


In response to last week’s big jump in new jobless claims to 264,000, I wrote that it might be an outlier vs. the beginning of a rising trend. This morning claims fell back to their previous average range, at 242,000. The 4 week average declined -1,000 to 244,250, while continuing claims from the previous week declined -8,000 to 1.799 million:


I’ve been paying particular attention the YoY% change, since that is what triggers a recession warning from this metric: specifically 2 months in a row of claims higher YoY than 12.5%.

With this morning’s update, the weekly number is 9.0% higher YoY, and continuing claims are higher by 25.5%. The most important 4 week average is higher by 14.0%:


The 4 week average has hit the %age marker, but hasn’t remained above it long enough to generate the red flag. In the past (not shown), as often as not readings of this sort, that have not persisted, have been false positives. So for now, the yellow flag caution persists.

Wednesday, May 17, 2023

A Fed nightmare? Housing permits and starts confirm improvement from bottom, multi-unit construction sets new record high


 - by New Deal democrat


Housing construction is perhaps the single most important method by which the Fed seeks to translate its interest rate policy into effects on the economy. 


To be blunt, the Fed’s sledgehammer attempt via one of the most aggressive rate hike campaigns in its history appears to be on the verge of failure. That’s because housing construction, more than a year after the Fed started its campaign, is not meaningfully cooperating.

Let’s go to the numbers . . .

In April housing starts increased by 30,000 at an annualized rate to 1.401 million. Permits declined -21,000 to 1.416 million, and single family permits, which are the least volatile among the leading metrics, increased 26,000 to 855,000. These are 87,000, 76,000, and 107,000 units, respectively, higher than their January lows:


This is unsurprising, since mortgage rates made their highs of just over 7% at the end of November. Below is the update of the graph I have run for over a decade showing the YoY% changes in mortgage rates (inverted, *10 for scale), total and single family permits:


I wrote last month that it appeared the bottom was in, and today’s report gives us more confirmation of the same.

But perhaps the biggest news is what happened with total units under construction. They *increased* by 7,000, and are only -2% lower than their peak half a year ago. While single family units under construction did decline by -10,000, that was more than offset by the continued rise, by 16,000, in multi-family units under construction:


The 959,000 multi-family units under construction is a new all-time high.

The Fed has been raising rates in order to get its preferred metric of inflation down to 2% YoY. I have been pointing out for months that the only important sector that has not decelerated sharply towards that figure is shelter. Total housing under construction only -2% below its all-time peak is not creating meaningful slack in construction prices, and so far housing prices as measured by both Case-Shiller and the FHFA (not shown) are only -5% and less than -1% from their all-time highs as well. 

So the good news is, housing is not killing the economy. Not by a long shot. The bad news is, this is going to give continued ammunition to Fed hawks either not to pause, or worse to continue the interest rate hikes, until the economy begs for mercy.

Tuesday, May 16, 2023

March total business sales strongly suggest that real total sales have entered a downturn


 - by New Deal democrat


Today’s final significant economic report was total business sales for March. This is a nominal figure; the “real” number won’t be updated until personal income and spending is reported for April in two weeks.


And here, the report was a clear negative. Not only did total March sales decline -1.1%, but January was revised down by -0.1% and February down by -0.3% (blue below, vs. real sales in red):


This will make real manufacturing and trade sales for January unchanged from December, deepen February’s decline, and because producer inflation for March was down on average about -0.3% and consumer inflation increased slightly, the March “real” number when reported is likely to be negative on the order of -0.9%, as shown in the below graph which estimates the real number by averaging producer and consumer price deflators:


For April real sales, which won’t be reported until the end of June, we can at least create an opening estimate by averaging real retail sales (which are about 1/3rd of the total sales number) and industrial production. This estimate misses wholesale sales completely and also doesn’t account for manufacturing inventory changes, so is less reliable - but as indicated, it’s a start. The long term YoY view shows that it captures the trend about 90% of the time, even if it misses the mark monthly often:


Here’s a close-up on the YoY change since the pandemic, again showing that this method captures the trend if not the exact monthly number:


And here’s the monthly view for the past 2 years:


This method also forecasts a significant decline in March, and a small increase in April.

Taken all together, this morning’s three reports suggest that both manufacturing and real sales have turned down since late or the end of last year, respectively. If so, then the producer side of the economy has begun a mild recession. We will have to await April’s personal income and spending report in two weeks to see if real consumer income has also begun to trend down.

April industrial production looks great! - until you account for the March revisions


 - by New Deal democrat


The second of this morning’s three significant economic releases was April industrial production, and here the revisions were very important.


In April total production increased 0.5% from March, but March itself was revised downward by -0.5%, so the net result was unchanged. Manufacturing production increased 0.9% from March, but March was revised downward by -0.6%, for a net increase of 0.3%:


Both measures remain below their respective September and October 2022 peaks, by -0.5% and -0.9% respectively.

On a YoY basis, total production (including mining and utilities) is only up 0.2%, while manufacturing production is down -0.8%. Here’s what that looks like in comparison with the last 50 years:


Typically this kind of YoY decline in manufacturing has been associated with a recession, or at very least a slowdown. Because so much manufacturing was offshored beginning in 2000, note that we had steep downturns twice in the last decade before the pandemic without the economy going into recession. 

This is because consumer income and spending held up well. But as we saw from this morning’s retail sales report, that has not been the case over the past year.

Because manufacturing production goes into sales or inventories, it also gives us a clue about real manufacturing and trade sales one month before the official number comes out. I’ll update this once the March nominal number is reported later today.

Real retail sales for April are flat, off sharply YoY, and near the bottom of their 2 year range


 - by New Deal democrat


The first of today’s three significant economic releases was retail sales, which were up +0.4% nominally for the month of April. There were inconsequential small revisions to February and March. After April inflation of +0.4% is taken into account, real retail sales were unchanged. 


Here’s what the last 2.5 years look like:


After the 2021 spring stimulus spending spree, except for one month last year real retail sales failed to make any meaningful new high. Indeed their present level is close to their lows ever since.

On a YoY basis real retail sales are down -3.4%. This is a very negative number. To show you why, I’ve added 3.36% to the YoY calculation for the last 21 months below:


And here is the identical calculation going all the way back 75 years up until the pandemic:


With the exception of one year during the Korean War, the 1966-67 near-recession, and one month in 2002, YoY% changes this negative only occurred in the depths of deeper recessions.

As I’ve also written many times, real retail sales (/2 YoY) are a good if noisy short leading indicators for jobs, as shown over the recent short term below:


We can expect further deceleration in job gains in the months ahead. In fact, the only reason I suspect jobs have not started contracting already is the pent-up shortages in workers needed to accommodate the huge increase in spending that began with the stimulus spending spree back in 2021.

Finally, real retail sales make up about 1/3rd of real manufacturing and trade sales, one of the “big four” monthly coincident indicators most relied upon by the NBER in determining if the economy is in expansion or recession. Nominal real manufacturing and trade sales for March will be released later today.

Monday, May 15, 2023

The question for tomorrow: is the producer side of the economy rolling over?


 - by New Deal democrat


There’s no important economic news today, but tomorrow there will be several important updates, including real retail sales and industrial production for April, as well as non-deflated total business sales (manufacturing, wholesale, and retail together) for March. These will give us important updates on the production side of the economy, so let me provide an overview now.


The consumer side of the economy has continued to expand, as jobs (red) and real income excluding government transfers (blue) have continued to grow, albeit at decelerating rates:


The big coincident indicators for the production side are industrial production (red in the graphs below) and real manufacturing and trade sales (blue), the Quarterly % changes (to reduce noise) in which I show below, together with the manufacturing subset of industrial production (gold) for the 50+ years before the pandemic:


Usually quarterly growth rapidly turns into quarterly contraction as we head towards a recession. The exceptions have been several oil price shocks (1974, 1990) and Volcker’s Fed engineered recession (1981).

Here is the monthly % change update for the past 18 months (yes, it’s noisy):


I show this monthly since we do not have full Q1 2023 data yet. Note that industrial production and its manufacturing component have stayed in the vicinity of zero on a monthly basis, while real sales were negative during last spring, and rebounded somewhat subsequently.

The reason for the decline and rebound in real total sales has everything to do with oil and gas prices, the recent course of which are this:


With that in mind, now let’s look at the same monthly data for production and total sales, normed to 100 as of just before Russia’s invasion of Ukraine. Note I also include gas prices (gray, with volatility reduced for scale) to show its impact on real total business sales of the big run-up in prices due to Russia’s invasion of Ukraine, and then the big decrease as the West adapted:


Both total and manufacturing production may have peaked late last year, while total real sales declined in February (the last data available) from their January peak.

Real retail sales form about 1/3rd of real total sales, so tomorrow’s retail sales report will give us our first indication for April, while the nominal total business sales report, adjusted for both producer and consumer inflation, will give us more detailed information about March.

Tomorrow I will be looking to see if there are more definitive signs that production and real sales have been rolling over, as I suspect the producer side of the economy will decline before the consumer side, and in particular employment, does.