Saturday, September 19, 2020

Weekly Indicators for September 14 - 18 at Seeking Alpha


 - by New Deal democrat


My Weekly Indicators post is up at Seeking Alpha.

While the forecasts and the nowcasts remain positive, for the second week in a row one measure of consumer spending has turned down.

As usual, clicking over and reading brings your right up to date on the economy, and helps me out with a penny or two for my work.

Friday, September 18, 2020

August housing permits and starts bode well for 2021 economy


 - by New Deal democrat

As I mentioned yesterday, August housing starts and permits were reported. Since they are important long leading indicators, I promised an update.

And here it is, up at Seeking Alpha.

As usual, clicking over and reading should be educational for you, and helps reward me with a penny or two for my efforts.

Thursday, September 17, 2020

2019: the year that the late economic expansion finally bore fruit for nearly all of society


 - by New Deal democrat


Yesterday the Census Bureau released its 2019 information concerning median household income and poverty rates. Unfortunately, this data is always released in September of the following year, so is already somewhat stale. Just for example, since the information is collected between February and April of the following year, we may not get complete information about the impact of the coronavirus until two years from now!


Also, since the information is across *all* households, not just wage- or salary-earning households, but includes, for example, retirees as well as the unemployed, it should not be used to infer information about wages.

That being said, in 2019 the economy was doing very well, and both un- and under-employment were reaching repeated new lows, and inflation remained subdued, real median household income rose significantly - up 6.8% over 2018:


As is obvious from the graph, this was a new all-time high.

As a result of the same factors, the poverty rate (the percentage of households living in poverty) declined to 10.5% - also a series low:


The earnings of men, which last made a new high way back in 1973, finally set another new high. Because women’s income also rose, but slightly more sharply, the female to male earnings ratio also rose to yet another new high:


These are all very good statistics. And not just “good” economically, but while obviously not perfect, are very good for broad society as well. Had the pandemic not happened, or if there had been a coherent response to it as occurred in neighboring Canada and virtually all other industrialized countries, it wouldn’t be a one-off that almost certainly has been sharply reversed.

Weekly jobless claims: “less worse” trend resumes


 - by New Deal democrat


This morning’s jobless claims report indicated that the trend of “less worse” news, which had temporarily ended, has resumed - but at a snail’s pace, and at levels worse than the worst weekly levels of the Great Recession.

On a non-seasonally adjusted basis, new jobless claims declined by 75,974 to 790,021. After seasonal adjustment (which is far less important than usual at this time), claims declined by 33,000 to 860,000, their new “best” reading since the pandemic began. The 4 week moving average declined by 61,000 to a new pandemic low of 912,000:


Continuing claims also declined on both a non-adjusted basis by 1,034,052 to 12,321,395, and on a seasonally adjusted basis by 916,000 to 12,628,000, both new pandemic lows:


This remains almost exactly half of their worst levels at the beginning of May, and more than 4 million higher than the worst level of continuing claims during the Great Recession.

There has been only slow downward movement in new jobless claims over the past six weeks. As a result, the pandemic shock recession is gradually turning into something much more chronic at very depressed levels. 

NOTE: Housing permits and starts were also reported this morning, and the annual report on median household income was released yesterday. I’ll post notes on both of these later on.

Wednesday, September 16, 2020

Real retail sales gains join industrial production in sharp deceleration


 - by New Deal democrat

Yesterday we saw that gains in industrial production had decelerated sharply in August. This morning we saw the same thing with real retail sales, one of my favorite indicators.

Nominal retail sales were up +0.6% in August. Meanwhile July’s reading was revised downward by -0.3%. Since in July and August consumer inflation was up +0.6% and +0.4%, respectively, that means revised *real* retail sales rose +0.3% in July and +0.2% in August. Which means that the net result over two months was lower than previously thought for the month of July alone.

 Nevertheless real retails sales did establish a new record high, above any reading from before the pandemic:


Historically consumption has led employment (/2) by several months (albeit with lots of noise), and has an even closer relationship with aggregate hours (all shown YoY below):


Here is the short-term view of the past 9 months:


Because sales have made a full recovery, I expect employment and hours worked to continue to show gains for the next several months, although at a slower pace, particularly if employers suspect - as most economic watchers including myself appear to - that the end of the emergency Congressional relief will lead to a renewed downturn in spending.

Tuesday, September 15, 2020

Industrial production improves in August, but with sharp deceleration


 - by New Deal democrat

If the jobs report is the Queen of Coincident Indicators, industrial production is the King. It, more than any other metric, is found at the turning points where recessions both begin and end.

This morning’s report of industrial production for August shows that the recovery from the bottom of the coronavirus recession has come close to stalling out.

Overall industrial production grew by 0.4%, while July was revised higher by 0.5%. Manufacturing production grew just under 1.0%.  July was likewise revised higher by 0.6%. Here are the overall totals:


The good news is that manufacturing production has gained back almost 70% of its decline from March. Overall production has gained a little over half of its decline.

The bad news, as is easily seen from the trajectories of the recoveries, is that there has been a sharp deceleration in them since June.

Since production generally follows consumption (but is considerably more volatile), it is not a surprise that industrial production (blue) has continued to recover in the face of a total recovery in real retail sales (violet) (shown YoY):


But with the expiration of supplemental Congressional unemployment aid, like most observers I am expecting that consumption rebound to end - and that will likely show up in the ending of the industrial rebound as well in several months.

Monday, September 14, 2020

Coronavirus dashboard for September 14: cases in the Midwest surge; the Northeast still lags Canada


 - by New Deal democrat

Total US cases: 6,519,573
Average cases last 7 days: 34,744
Total US deaths: 194,071
Average deaths last 7 days: 733

Source: COVID Tracking Project

I continue to expect the pandemic to wax and wane in relative terms at least until next January 20, as the public reaction in various States varies between panic and complacency.

Let’s start by comparing the rates of cases and deaths in the US with the North American standard - Canada: 


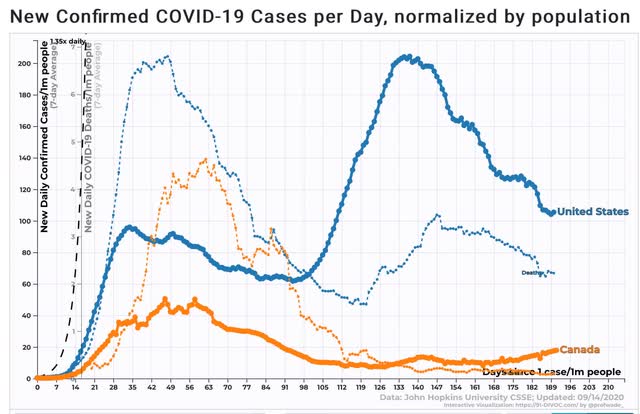
In contrast with the US, Canada averaged 18 cases per day per million people in the last 7 days (vs. 105 for the US), and 0.1 deaths (vs. 2.2 for the US). That is what we could have as well, if there were competent Federal leadership.

The Top 10 States for infections have shifted to the Midwest:


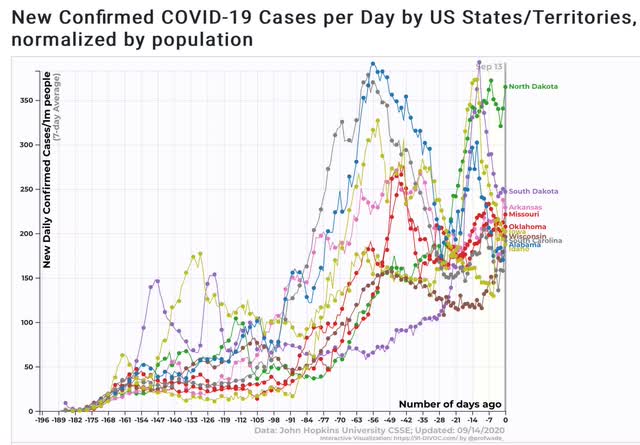
These are rates that are virtually out of control (the worst was about 500 cases per day for NY and Arizona at their peaks).

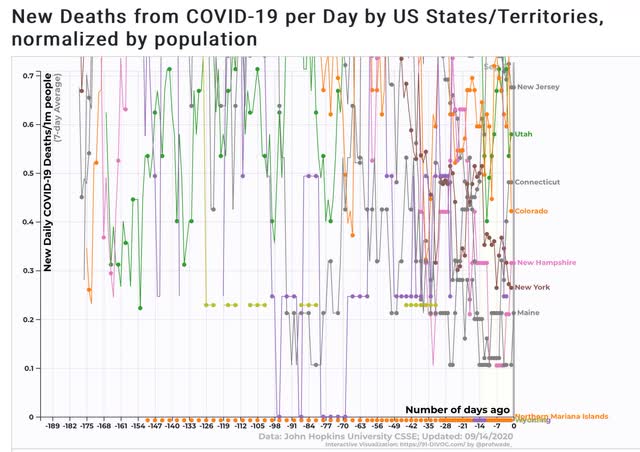
The South (and the territories of Guam and the Virgin Islands) is still leading in deaths per capita:


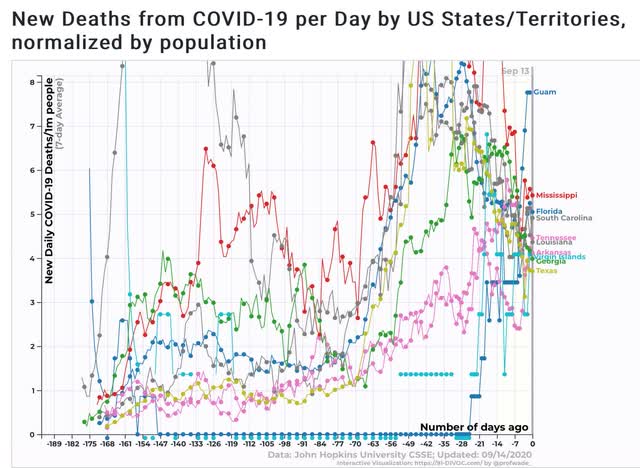
Since the rate of infections in the South, at least officially, has declined, this can be expected to shift to the midwest as well in the next several weeks.

The Bottom 10 States for infections remain dominated by the Northeast, plus several Mountain States:


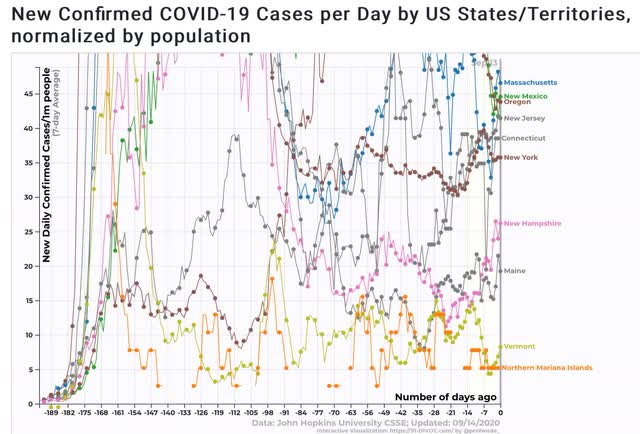
The Bottom 10 for deaths are almost exclusively in the Northeast:


But even the Northeast is stubbornly not doing as well as Canada, as shown in the below graph comparing the rate of NY infections and deaths with Canada’s:


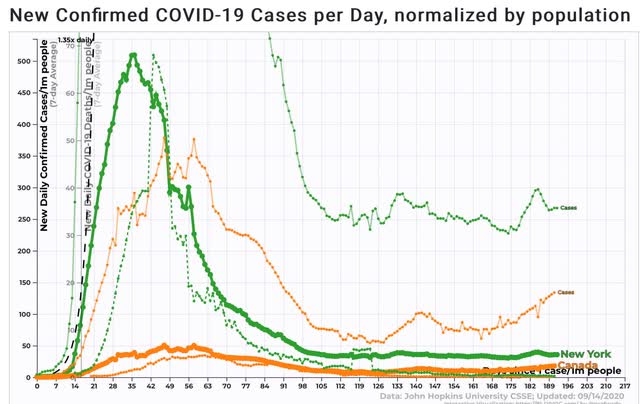
This is depressing, and as I stated at the outset, I do not expect it to change for at least 4 more months.

Sunday, September 13, 2020

The 2020 Presidential and Senate nowcast: the races congeal


 - by New Deal democrat

Here is my weekly update on the 2020 elections, based on State rather than national polling in the past 30 days, since that directly reflects what is likely to happen in the Electoral College. Remember that polls are really only nowcasts, not forecasts. They are snapshots of the present; there is no guarantee they will be identical or nearly identical in early November.

Let’s begin with Trump’s approval. After several weeks of improvement, this week Trump’s approval eroded very slightly - but remains right in its normal range for the past 3 1/2 years:


It is safe to say that Trump’s post-convention, “law and order” bounce has plateaued (note there have not been any big BLM demonstrations in the past week that have  produced pictures of burned out businesses).

In any event, here is the updated map through September 5. To refresh, here is how  it works:

- States where the race is closer than 3% are shown as toss-ups.
- States where the range is between 3% to 5% are light colors.
- States where the range is between 5% and 10% are medium colors.
- States where the candidate is leading by 10% plus are dark colors.


The only changes are that Nevada moved back from “likely” to “lean” Biden, while Arizona improved from “lean” to “likely.” Maine also improved to solid Biden, while New Hampshire declined to “likely” Biden. With the exception of Arizona, all of these have been on the basis of skimpy polling. I continued to be surprised that so little polling attention has been paid to Nevada.

While Biden’s “solid” plus “likely” Electoral College votes have declined from their peak of  302 six weeks ago, this week they improved from 279 to 284. Absent a *legitimate* “October surprise,” i.e., nothing that has been telegraphed in bright shining neon lights by the likes of William Barr, or a dramatic further explosion of social unrest, Trump is going to need to resort to thoroughgoing vote shenanigans to avoid a likely defeat.  I believe the public’s perception of both the economy and Trump’s handling of the pandemic have congealed. I do expect some further incremental improvement in Trump’s position as voters who were leaning GOP “come home.”

There have also been several changes in the Senate map this week, in opposite directions, all based on light polling:


Iowa reverted back to toss-up from “lean Democrat.” New Mexico declined to “likely Democrat,” and Maine to “lean Democrat.” By contrast, Montana moved from “likely” to “lean GOP.”

At current polling, if Democrats win all those seats rated “solid” and “likely,” they will have 49 Senate seats; 50 with “lean Democrat” Maine; up to 54 with the “toss-ups,” and 56 if they were to capture the 2 “lean GOP” seats.