Friday, August 12, 2022

The long leading outlook through mid year 2023 at Seeking Alpha


 - by New Deal democrat

I posted this last week at Seeking Alpha, and seeing as there is no big economic news today, this might be a good day to bring you up to speed.

My long leading outlook for 12 months from now can be found by clicking here.

These indicators have been sufficiently negative that I am actually looking to see when they begin to forecast a positive outlook again.

Thursday, August 11, 2022

Jobless claims: once again, a relentless uptrend


 - by New Deal democrat

I feel like a broken record at this point, as every week the trend seems more and more relentless.


Initial jobless claims rose once again, by 14,000 (seriously revised down by 12,000 from last week’s reading of 260,000) to 262,000. More importantly, the 4 week average rose another 4,500 as well to 252,000, a (revised) 8 month high.  Continuing claims also rose 8,000 to 1,428,000, the highest since April:


Claims remain on track to turn higher YoY in November, which would signal an imminent recession.

Wednesday, August 10, 2022

July consumer inflation: a tale of two disparate trends


 - by New Deal democrat

Consumer prices were unchanged in July, as two very disparate trends canceled out one another. YoY prices increased 8.5%, below June’s multi-decade record of 9.0%:


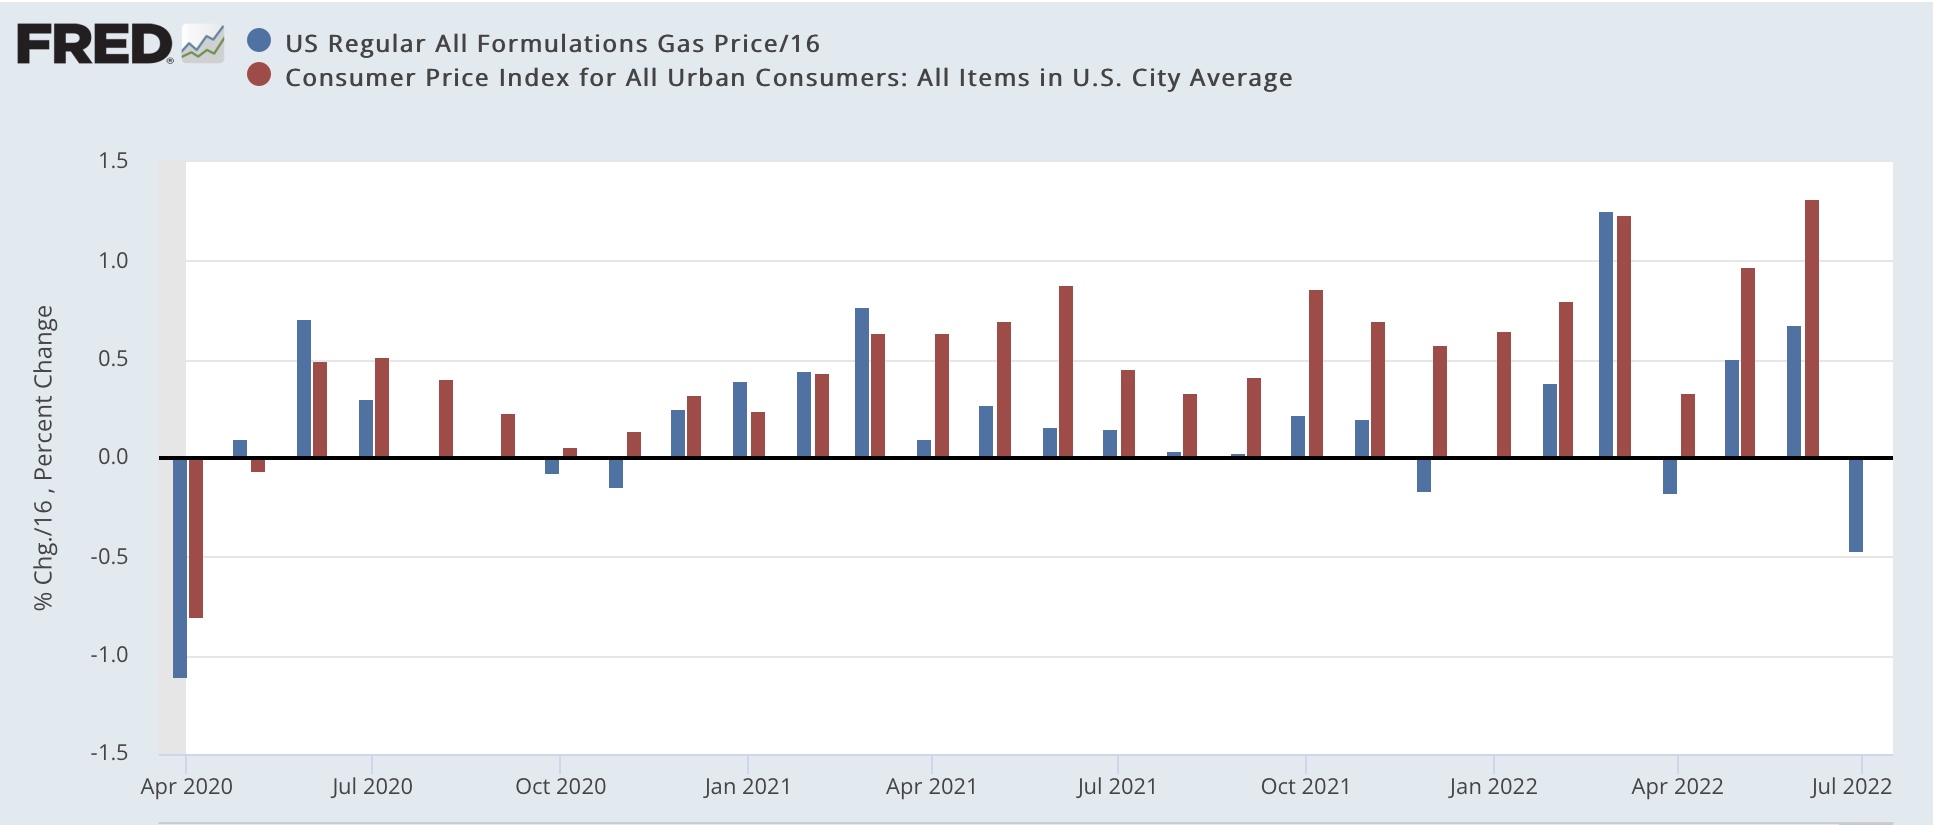
The two disparate trends are shown in the below bar graph of monthly changes since the end of last year. On the one hand, energy prices (red) declined -4.6% in July; but owner’s equivalent rent (gold) - which is 1/4 of the entire index - increased 0.6%. Motor vehicle prices (purple) were unchanged, as was total inflation (blue):


July’s decline in energy prices was the steepest since 2015-16, with the exception of the pandemic lockdown months:


But YoY energy prices are still up 32.9%:


But as indicated above, that was completely counterbalanced by housing, as shown below by the YoY% changes in the FHFA house price index (blue) vs. owner’s equivalent rent (red):


OER has continued to accelerate on a YoY basis, up 5.8% in the last 12 months, the highest since September 1990, clearly following house prices with roughly a 12 month lag. Since house prices had not meaningfully decelerated through May, the last month measured in the index, it is still likely that OER has not hit its YoY peak. We are likely to see the highest YoY% increase for OER ever before this episode is over.
 

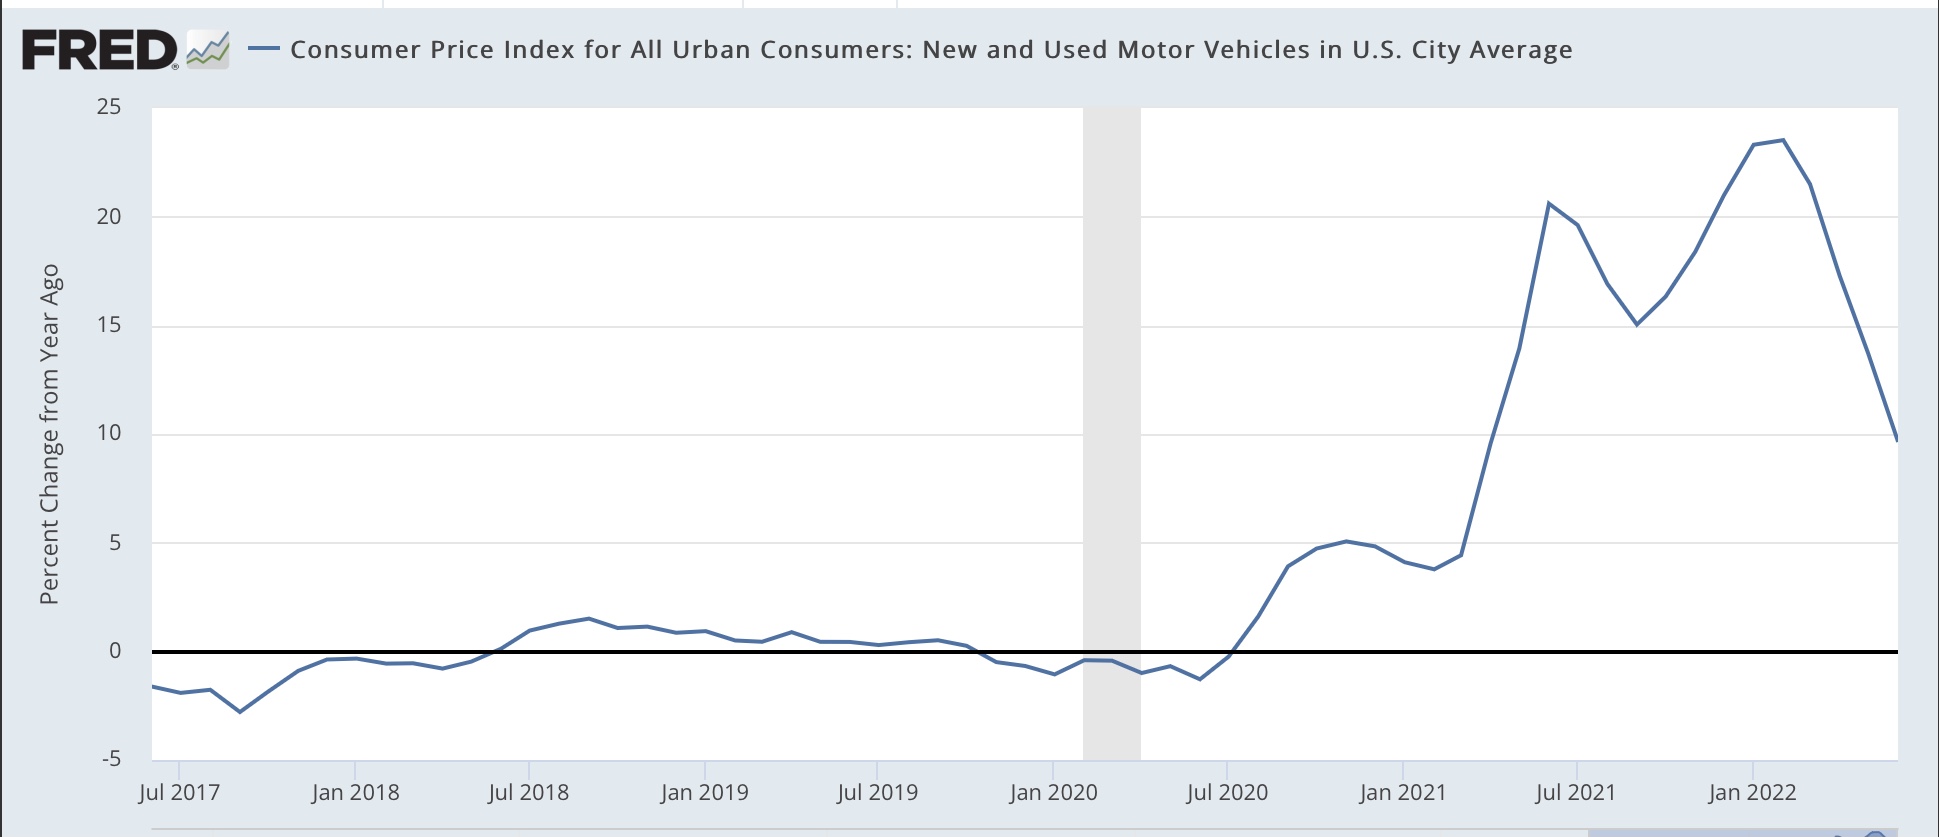
While vehicle prices were unchanged overall, the situation was slightly different for new cars, which increased 0.6% in July, and are up 10.4% YoY, vs. used cars, which declined -0.4% for the month, and are up 6.6% YoY:


Finally, since average hourly earnings for nonsupervisory employees increased 0.4% in July, after rounding real average hourly wages increased 0.3% for the month. Real wages are nevertheless down 3.0% from December 2020:


While so far energy prices are continuing to decline in August, they will almost certainly not decline by as much as they did in July. Meanwhile OER, as indicated above, is likely to continue to increase. So I am not expecting an abrupt cooling off of consumer inflation.


Tuesday, August 9, 2022

Coronavirus dashboard for August 9: BA.5 dominant, with a slow waning; a model for endemicity


 - by New Deal democrat


BIobot’s most recent update, through last week, shows a decline of 15% of COVID in wastewater, consistent with about 460,000 “real” new infections per day:


All 4 Census regions (not shown) are participating in the decline.

Confirmed cases (dotted line below) have declined by a roughly similar percent, to 105,500. Deaths (solid line) are close to a 4 month peak at 489:


Hospitalizations have plateaued for the past 3 weeks at about 44-47,000, and were 44,800 yesterday (the last year is shown for comparison purposes):


Meanwhile, the CDC has updated its variant information. BA.4,4.6, and 5 now account for 98% of all infections. BA.5 has slightly increased its share from 84.5% to 87%. BA.4.6 has not meaningfully increased its share:


It does not appear that BA.4 or BA.4.6 are going to make substantial inroads into BA.5’s dominance, although BA.4.6 makes up over 10% of infections in the High Plains (regional map not shown). BA.2.75 does not appear at all.

With no new variant ready to overtake BA.5, I continue to suspect in the immediate future there is further slow waning in cases, that will show up shortly in lower hospitalizations, and then lower deaths.

Finally, Trevor Bedford has a very informative thread about what endemic COVID is likely to look like, based on the rate of mutations and the period of time that previous infection makes a recovered person resistant to re-infection.

Here are a few highlights:

“Based on the experience in winter 2020/2021, seasonal influence on SARS-CoV-2 transmission is quite clear …

“we can gain some intuition from simple epidemiological models…

“In particular, we can use an SIRS system in which individuals go from Susceptible to Infected to Recovered, and then return to the Susceptible class due to immune waning / antigenic drift of the virus…

“ with flu-like ~5 year rate of waning (in blue), we get winter epidemics and summer troughs, while with faster waning we see greater levels of circulation and less variation between winter and summer (in yellow and red)…


“If what we've seen with Omicron evolution in 2022 becomes largely the norm, then this result would imply waning of ~24% in the span of ~6 months, or very roughly waning from R→S on a ~1.8 year time horizon, ie close to the yellow curve in the above SIRS model.”

He indicates he is not making a prediction, but rather to

“illustrate a scenario where we end up in a regime of year-round variant-driven circulation with more circulation in the winter than summer, but not flu-like winter seasons and summer troughs.”

Monday, August 8, 2022

Previewing July CPI: good news and bad news about gas, housing, and vehicle prices


 - by New Deal democrat

While July’s consumer inflation is likely to be less intense than in recent months, I don’t see it coming back down to more “normal” levels. The good news is gas; the bad news is vehicles and housing.


To begin with, gas prices have fallen about 25% from their peak at the end of June to this past weekend. To get to their “real” price, I divide by average hourly wages of nonsupervisory workers. Here’s what that looks like, with the peak of June 2008 set at 100:


In June of this year, gas prices divided by average hourly nonsupervisory wages were 79.8% of their peak. By the end of July, that had fallen to 73.5%. This is more typical of the 2005-07 period, and also the 2010-14 period of the “oil choke collar,” where gas prices backed off every time they hit a threshold that threatened to cause a consumer recession. It looks like that has happened again.

Turning to the CPI, in usual times, the price of gas is the biggest component of CPI volatility. And that is likely to be the case with this Wednesday’s report as well. My rule of thumb is to take the change in the price of gas, and divide it by about 16, and add .15% for normal background “core” inflation, to figure the most likely monthly inflation reading.  Here’s what that looked in the 10 years before the pandemic:


Now here is the past 2+ years since the onset of the pandemic:


If this were “normal” times, gas would drag July consumer prices down by roughly 0.5%. Add in the background “core” inflation, and I’d expect a reading of -0.3% or -0.4%.

But these aren’t normal times, and the biggest culprit is housing inflation. A number of times in the past year I’ve run YoY% comparisons of the FHFA and Case Shiller house price indexes vs. Owners’ Equivalent Rent, the official CPI measure. Below I’ve instead used month over month changes to show how house prices have gradually fed into owners’ equivalent rent in the past two years:


Additionally, let me re-up this graph from Bill McBride, showing that measures of apartment lease inflation have a similar issue:


Since rents are typically increased only once a year for each tenant, it takes a full year for rent increases to filter through to the total metric.

For July, owners’ equivalent rent is likely to clock it at about +0.7%, and since it is almost 1/3rd of the entire CPI index, this is going to dwarf the impact of lower gas prices.

Finally, because of microchip production issues out of China, vehicle prices have also been a significant component of inflation, as shown in the YoY graph below:


But unfortunately in the past few months there’s been no sign of further deceleration in the monthly readings:


This suggests that increases in vehicle prices are likely to persist.

So, while I expect July inflation to back off from its most recent 1%+ monthly increase, an increase in the 0.5%-0.9% ballpark seems likely.