- by New Deal democrat
The big news this week, as usual for the first week of the month, was the 103,000 initial estimate of jobs added in December, and the decline of the unemployment rate to 9.4%. Had there not been people leaving the workforce, the unemployment rate still would have declined back down to 9.6%. Interestingly, almost every commentary on this morning's report headlined it as "disappointing" -- even though, only a week ago, expectations were for about 125,000 new jobs to be added. Likely the blowout ADP report so boosted expactations that a 6-digit initial BLS estimate perversely was a letdown.
Meanwhile, under the radar, October was revised up - again - to 210,000 jobs added (initially it was 151,000). Had that been the initial report there would have nearly been dancing in the streets. And remember last month's gut-punch of 39,000? As I predicted, that too was revised up - 31,000 - to 70,000. The odds are very good it will be revised upward again next month, and it is further likely that this month's number will wind up somewhere around 150,000 - which would of course have been in line with estimates and not a "disappointment" at all! But because it will be two months later, it will be all but ignored in the sturm und drang about the first estimate for February jobs, which will be the then-currently "disappointing" number.
In other news, it is worth noting that income and spending were once again up, that residential investment was up, and that the slide in nonresidential investment is slowing considerably.
Now here are this week's other high frequency data:
Gas at the pump went up 2 more cents to $3.07 a gallon last week, and Oil declined back below the $90 a barrel mark to ~$87.60. Gasoline usage was slightly above (1%) last year's levels. This will become a number to watch more closely.
The Mortgage Bankers' Association did reported for the last two weeks of 2010, a net decrease of 1.6% in seasonally adjusted mortgage applications. This number has been generally stable for several months now. Refinancing decreased about 3.3% further for the combined two weeks. Increased mortgage rates are killing refinancing. This is likely to impact consumer spending down the road.
The ICSC reported that same store sales for the week ending new Year's Day increased 3.6% YoY, and increased 0.4% week over week - not too shabby for a week that included a big snowstorm in the northeast. Shoppertrak was stronger, reporting that sales rose 6.1% YoY.
Railfax declined in all areas last week again, for seasonal reasons. It nevertheless remained steady in its comparative improvement over last year. Shipments of waste and scrap metal and auto shipments are no better than last year's levels.
The American Staffing Association Index fell 7.8% to 92 for the week ending December 26, entirely for seasonal reasons. This index will probably decline further for one more week, before it again gives reliable information.
The BLS reported initial jobless claims of 408,000, the third lowest initial estimate since the onset of the recession. The 4 week moving average fell to 411,000. (I will update the scatter graph of initial claims vs. payrolls on Monday).
M1 was up 2% for the week, down -0.4% month over month, and up 7%+ yoY, meaning "Real M1" was up 6%. M2 was up +0.16% for the week, +0.24% month over month, and +3.2% YoY, meaning "Real M2" was up ~2.2%. These numbers have told the same story for months on end. Real M1 is up sharply, Real M2 can't seem to improve above the red zone of +2.5%.
Weekly BAA commercial bond rates fell slightly to 6.07% last week from 6.10%. This compares with a .01% increase in the yields of 10 year treasuries. There is no sign of deflationary fear amound B grade corporate bonds.
The Daily Treasury Statement showed receipts in the first 3 reporting days of January of $39.2 B vs. $40.0 B a year ago, for a loss of $0.1 B. Over the last 20 reporting days, this year shows $164.4 B collected vs. $158.3 B one year ago. With the "temporary" reduction in Social Security payroll taxes of 2% capitulated to - I mean, negotiated - by President Obama in 2011, this metric will have to be approached very carefully to try to at least get a comparative handle on the data.
In summary, with the very real problem of gas prices, the economy continues to pick up steam, but this will be a very long and painful slog.
Have a nice weekend!
Friday, January 7, 2011
Unemployment Drops; Establishment Up 103,000
From the BLS:
First, let's loook at why the unemployment rate dropped. This data is from the household survey, and is a simple fraction of the total number of unemployed over the total civilian labor force. The good news is the total number of unemployed fell from 15,041,000 to 14,485,000. In addition, the civilian labor force also decreased from 153,950,000 to 153,690,000 (remember, a decrease in denominator increases the resulting percentage). Assuming that some people will argue the decrease is all due to people leaving the labor force, consider this: the number of unemployed decreased by 556,000 while the civilian labor force decreased 260,000. Even if the drop in the labor force is due to people giving up looking, there is still a drop of 296,000 in the total unemployed that is not due to people giving up. In addition, the total number of employed in the household survey increased from 138,909,000 to 139,206,000 (+297,000 which is in line with the ADP report) So, overall, the household report is actually pretty good.
In the establishment survey all the gains same in the service sector, as goods producing industries lost 2,000 jobs. Services added 115,000 jobs, with the bulk of the gains coming in education and health care (+44,000) and leisure/hospitality (+47,000). Average weekly hours were steady, but average hourly earnings increased by 3 cents, which led to an increase in average weekly earnings.
Finally, we have the following revisions:
In other words, an upward revision to this report is a strong possibility.
Overall, I'd give this report a 5.5 on a 1-10 scale.
The unemployment rate fell by 0.4 percentage point to 9.4 percent in December, and nonfarm payroll employment increased by 103,000, the U.S. Bureau of Labor Statistics reported today. Employment rose in leisure and hospitality and in health care but was little changed inother major industries.
First, let's loook at why the unemployment rate dropped. This data is from the household survey, and is a simple fraction of the total number of unemployed over the total civilian labor force. The good news is the total number of unemployed fell from 15,041,000 to 14,485,000. In addition, the civilian labor force also decreased from 153,950,000 to 153,690,000 (remember, a decrease in denominator increases the resulting percentage). Assuming that some people will argue the decrease is all due to people leaving the labor force, consider this: the number of unemployed decreased by 556,000 while the civilian labor force decreased 260,000. Even if the drop in the labor force is due to people giving up looking, there is still a drop of 296,000 in the total unemployed that is not due to people giving up. In addition, the total number of employed in the household survey increased from 138,909,000 to 139,206,000 (+297,000 which is in line with the ADP report) So, overall, the household report is actually pretty good.
In the establishment survey all the gains same in the service sector, as goods producing industries lost 2,000 jobs. Services added 115,000 jobs, with the bulk of the gains coming in education and health care (+44,000) and leisure/hospitality (+47,000). Average weekly hours were steady, but average hourly earnings increased by 3 cents, which led to an increase in average weekly earnings.
Finally, we have the following revisions:
The change in total nonfarm payroll employment for October was revised from +172,000 to +210,000, and the change for November was revised from +39,000 to +71,000.
In other words, an upward revision to this report is a strong possibility.
Overall, I'd give this report a 5.5 on a 1-10 scale.


Thursday, January 6, 2011
Food Prices Are Under Pressure
From the NY Times:
World food prices continued to rise sharply in December, bringing them close to the crisis levels that provoked shortages and riots in poor countries three years ago, according to newly released United Nations data.
Prices are expected to remain high this year, prompting concern that the world may be approaching another crisis, although economists cautioned that many factors, like adequate stockpiles of key grains, could prevent a serious problem.The United Nations data measures commodity prices on the world export market. Those are generally far removed from supermarket prices in wealthy countries like the United States. In this country, food price inflation has been relatively tame, and prices are forecast to rise only 2 to 3 percent this year.
But the situation is often different in poor countries that rely more heavily on imports. The food price index of the United Nations Food and Agriculture Organization rose 32 percent from June to December, according to the report published Wednesday. In December, the index was slightly higher than it was in June 2008, its previous peak. The index is not adjusted for inflation, however, making an exact comparison over time difficult.
Adding to the problem is this:
The winter wheat crop in Kansas looks increasingly a market "flashpoint" in the making thanks to the dry start to the season, which has left its condition already well below average with a freeze on its way.
The decline in the condition of the winter crop in America's top wheat-producing state - where officials this week rated only 27% of the crop in "good" or "excellent" condition, less than half the recent average – has stoked expectations that a three-year run of above-average yields is at an end
"Increasingly, the current Kansas winter wheat crop looks to be tracking conditions similar to the three worst years in recent times – 1989, 1996 and 2002," Australia & New Zealand Bank said.
Such a comparison implies a steep drop in the harvest this year, with production tumbling by 34% in 1989, 11% in 1996 and 18% in 2002.
Economic News Prints Impressive Numbers
From ADP:
The reports internals are very strong as well: small business added 117,000 jobs and medium sized businesses added 144,000. Most of the gains were in the service industries which accounted for 270,000 jobs. This report puts that much more pressure on Friday's jobs report.
ISM prints solid gain:
Let's look at the anecdotal quotes from the report:
1.) The economy is picking up steam, leading to
2.) An increase in pricing pressures.
These two reports -- in conjunction with the ISM manufacturing report -- are very good news and a great way to start the new year.
Private-sector employment increased by 297,000 from November to December on a seasonally adjusted basis, according to the latest ADP National Employment Report® released today. The estimated change of employment from October to November was revised down, but only slightly, from the previously reported increase of 93,000 to an increase of 92,000. This month’s ADP National Employment Report suggests nonfarm private employment grew very strongly in December, at a pace well above what is usually associated with a declining unemployment rate. After a mid-year pause, employment seems to have accelerated as indicated by September’s employment gain of 29,000, October’s gain of 79,000, November’s gain of 92,000 and December’s gain of 297,000. Strength was also evident within all major industries and every size business tracked in the ADP Report.
The reports internals are very strong as well: small business added 117,000 jobs and medium sized businesses added 144,000. Most of the gains were in the service industries which accounted for 270,000 jobs. This report puts that much more pressure on Friday's jobs report.
ISM prints solid gain:
The report was issued today by Anthony Nieves, C.P.M., CFPM, chair of the Institute for Supply Management™ Non-Manufacturing Business Survey Committee. "The NMI (Non-Manufacturing Index) registered 57.1 percent in December, 2.1 percentage points higher than the 55 percent registered in November, and indicating continued growth in the non-manufacturing sector. The Non-Manufacturing Business Activity Index increased 6.5 percentage points to 63.5 percent, reflecting growth for the 13th consecutive month at a faster rate than in November. The New Orders Index increased 5.3 percentage points to 63 percent, and the Employment Index decreased 2.2 percentage points to 50.5 percent, indicating growth in employment for the fourth consecutive month, but at a slower rate. The Prices Index increased 6.8 percentage points to 70 percent, indicating that prices increased significantly in December. According to the NMI, 14 non-manufacturing industries reported growth in December. Respondents' comments vary by company and industry, but overall are mostly positive about business conditions."
Let's look at the anecdotal quotes from the report:
Notice two themes:
- "Overall business climate remains reasonably positive." (Management of Companies & Support Services)
- "Pricing pressures are starting to heat up." (Construction)
- "Outlook for 2011 is positive with an increase in spending." (Finance & Insurance)
- "Looks like more budget reductions are coming in the next year." (Educational Services)
- "Cotton prices are moving upward, but prices are being kept in line as the overall Asian market cools somewhat."(Retail Trade)
- "Business picking up for holiday — above expectations." (Transportation & Warehousing)
1.) The economy is picking up steam, leading to
2.) An increase in pricing pressures.
These two reports -- in conjunction with the ISM manufacturing report -- are very good news and a great way to start the new year.
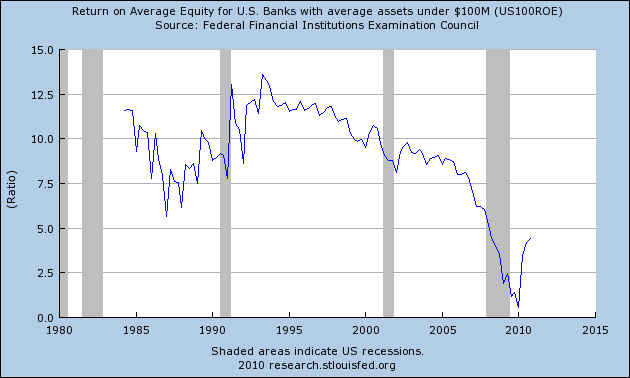
A Closer Look At Banks; $1 Billion to $10 Billion
Let's continue our look at financial institutions by focusing on the larger banks -- $1 billion to $5 billion in size.

Total non-performing loans are at 20 year highs.

Commercial charge-offs peaked, and have moved lower. However, the overall level is still high by historical measures.

Interestingly, non-performing commercial loans were higher during the S&L crisis. However, their current level is still high and is still increasing.

Total net loan charge-offs appear to have peaked, but these are also at very high levels.

The net interest margin is at near 20 year lows.
 The return on average assets was at a 20 year low, but has since rebounded. However, this number is still low by historical standards.
Average return on equity is also at low levels by historical standards.
Despite their size, these institutions are facing the same problems smaller banks are: high non-performing loans and low earning power.
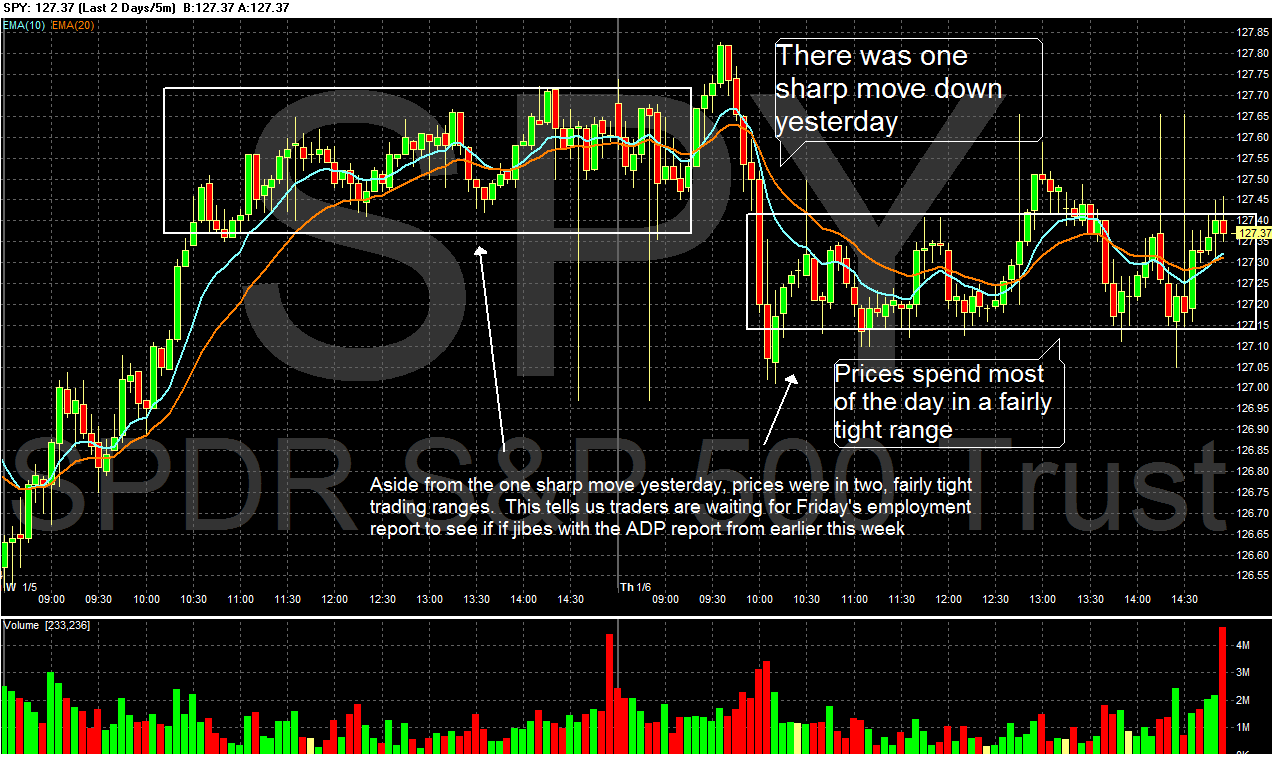
Yesterday's Market


The above charts paint the following picture:
1.) Equities are rallying on the strength of recent economic numbers
2.) The bond market, after a long sell off, is looking for direction. The EMAs indicate the overall trend is still lower, however. This would make sense given the recovery appears to be gaining steam
3.) The dollar's EMAs indicate a continued sideways move
Wednesday, January 5, 2011
Auto Sales Gain in December
From Auto Week:
Fueled by holiday and year-end discounts, as well as the introduction of new models, automakers finished 2010 on a high note by posting the year’s best monthly sales in December.
A Closer Look At Financial Institutions; $300 million to $1 billion
Let's continue out look at the nation's banks with a look at institutions
 Net loan losses as a percentage of total loans appear to have peaked, but are still very high.
 Commercial loan charge-offs are also high.

As a result of higher losses, banks are having to set aside near record amounts of funds for their loan loss reserves.

Finally, non-performing loans are near 25 year highs.

First, note return on average assets is low by historical norms, as is

Return on equity. In addition,

The net interest margin is also near low levels by historical standard.
So, like the smaller banks, the larger banks are getting hit by higher loan losses which is forcing them to set aside more funds for loan loss reserves. As for their money making side, we're seeing a low return on assets and equity and a low interest rate spread.
 Net loan losses as a percentage of total loans appear to have peaked, but are still very high.
 Commercial loan charge-offs are also high.
As a result of higher losses, banks are having to set aside near record amounts of funds for their loan loss reserves.

Finally, non-performing loans are near 25 year highs.

First, note return on average assets is low by historical norms, as is

Return on equity. In addition,

The net interest margin is also near low levels by historical standard.
So, like the smaller banks, the larger banks are getting hit by higher loan losses which is forcing them to set aside more funds for loan loss reserves. As for their money making side, we're seeing a low return on assets and equity and a low interest rate spread.
Housing: the Great Recession vs. the Great Depression
- by New Deal democrat
Several commentators, notably Calculated Risk, believe that residential investment will probably increase - finally - late in 2011, thus going from a drag on the economy to a contributor to GDP growth. Since the housing bubble of the first part of last decade helped lead the economy into the "Great Recession", there has been consternation as to whether it could lead the economy out of the recession -- or at least finally contribute.
Several years ago, Prof. David Leamer helpfully noted that there was a housing bubble in the 1920s as well - that burst several years before the actual nonset of the Great Depression, and bottomed in 1933. Following up on that, I was able to find the data for "non farm housing starts" in the Statistical Abstract of the United States. I posted the results a year and a half ago in Housing during the Roaring Twenties and Great Depression. Included then was a chart that converted the equivalent housing starts to our time, by multiplying the data proportionate to the population for each year compared with our modern population of 300 million.
Adjusting for population makes a significant difference in how one looks at the data. Building 2 million new houses a year means something quite different in 2005 with a 300 million population, than in 1960 with a 160 million population. So adjusted, the 2000's housing bubble does not look so extreme:

Adjusting for population alone doesn't tell the whole story. There remain the issues of demographics and immigation -- in other words, one must consider the factors behind household formation. I discussed this more thoroughly here, but to summarize for this post, young people begin to move out of their parents' homes at about age 20. Those who marry very young form their own household, while young singles live with roommates. By age 25, new household formation rapidly accelerates, and continues through age 35, by which time close to the maximum percentage of people are living in their own or spouse's household.
Thus Boomer household formation coincided with the 1970's-1980's peaks, and the smaller cohort of Gen X coincides with 1990's lower numbers of housing starts. Gen Y, or the "Millenials" have already begun to form households, just as the housing bust hit.
With another year's passage of time and additional data, I am republishing the chart from my original post about housing during the Roaring Twenties and Great Depression, but I have expanded it. Not only does it adjust the 1920's figures to the current era by population, but also I am comparing the equivalent year from the Roaring Twenties and Great Depression with the last decade of housing starts, normed to the peak year, which are averaged on an annual basis to make an apples to apples comparison. All data is in 1000's:
In reviewing this chart, keep in mind that in 1930, 25% of the US population lived on farms, compared with only 2% today. Also be mindful that back then, the typical mortgage was a 5 year note that frequently included a balloon payment at the end.
The data shows that if anything, the 1920s boom was much more of a bubble than the recent one, and the ensuing eight year decline from 1925-1933 was more gradual but also sank to a lower level before bottoming.
At this point, according to recent Case-Shiller data, some housing markets are at near quarter century lows in prices. For example, here are Charlotte (green), Las Vegas (red), and Cleveland (purple) (CPI inflation in blue):

In all three of these cases, prices are actually lower now in real terms than they were 23 years ago or at any time since.
All of the above doesn't tell us that housing starts *will* increase this year, but it certainly suggests that if not this year, then either next year or the year after will see a significant increase. Further, the odds appear favorable that in at least some metropolitan areas, we will see an increase in building at some point this year.
Several commentators, notably Calculated Risk, believe that residential investment will probably increase - finally - late in 2011, thus going from a drag on the economy to a contributor to GDP growth. Since the housing bubble of the first part of last decade helped lead the economy into the "Great Recession", there has been consternation as to whether it could lead the economy out of the recession -- or at least finally contribute.
Several years ago, Prof. David Leamer helpfully noted that there was a housing bubble in the 1920s as well - that burst several years before the actual nonset of the Great Depression, and bottomed in 1933. Following up on that, I was able to find the data for "non farm housing starts" in the Statistical Abstract of the United States. I posted the results a year and a half ago in Housing during the Roaring Twenties and Great Depression. Included then was a chart that converted the equivalent housing starts to our time, by multiplying the data proportionate to the population for each year compared with our modern population of 300 million.
Adjusting for population makes a significant difference in how one looks at the data. Building 2 million new houses a year means something quite different in 2005 with a 300 million population, than in 1960 with a 160 million population. So adjusted, the 2000's housing bubble does not look so extreme:
Adjusting for population alone doesn't tell the whole story. There remain the issues of demographics and immigation -- in other words, one must consider the factors behind household formation. I discussed this more thoroughly here, but to summarize for this post, young people begin to move out of their parents' homes at about age 20. Those who marry very young form their own household, while young singles live with roommates. By age 25, new household formation rapidly accelerates, and continues through age 35, by which time close to the maximum percentage of people are living in their own or spouse's household.
Thus Boomer household formation coincided with the 1970's-1980's peaks, and the smaller cohort of Gen X coincides with 1990's lower numbers of housing starts. Gen Y, or the "Millenials" have already begun to form households, just as the housing bust hit.
With another year's passage of time and additional data, I am republishing the chart from my original post about housing during the Roaring Twenties and Great Depression, but I have expanded it. Not only does it adjust the 1920's figures to the current era by population, but also I am comparing the equivalent year from the Roaring Twenties and Great Depression with the last decade of housing starts, normed to the peak year, which are averaged on an annual basis to make an apples to apples comparison. All data is in 1000's:
| Year | 1920's-1930's Nonfarm housing starts (actual) | 1920's-1930's adjusted for population | 2000's housing starts adjusted for population |
|---|---|---|---|
| 1920/2000 | 247 | 699 | 1689 |
| 1921/2001 | 449 | 1236 | 1701 |
| 1922/2002 | 716 | 1953 | 1799 |
| 1923/2003 | 371 | 994 | 1932 |
| 1924/2004 | 893 | 2350 | 2014 |
| 1925/2005 | 937 | 2423 (high) | 2121 (high) |
| 1926/2006 | 849 | 2177 | 1837 |
| 1927/2007 | 810 | 2042 | 1347 |
| 1928/2008 | 753 | 1867 | 895 |
| 1929/2009 | 509 | 1252 | 546 |
| 1930/2010 | 330 | 805 | 592 |
| 1931 | 254 | 615 | --- |
| 1932 | 134 | 322 | --- |
| 1933 | 93 | 221 | --- |
| 1934 | 126 | 300 | --- |
| 1935 | 221 | 522 | --- |
| 1936 | 319 | 748 | --- |
| 1937 | 336 | 781 | --- |
| 1938 | 406 | 937 | --- |
| 1939 | 515 | 1179 | --- |
| 1940 | 602 | 1368 | --- |
In reviewing this chart, keep in mind that in 1930, 25% of the US population lived on farms, compared with only 2% today. Also be mindful that back then, the typical mortgage was a 5 year note that frequently included a balloon payment at the end.
The data shows that if anything, the 1920s boom was much more of a bubble than the recent one, and the ensuing eight year decline from 1925-1933 was more gradual but also sank to a lower level before bottoming.
At this point, according to recent Case-Shiller data, some housing markets are at near quarter century lows in prices. For example, here are Charlotte (green), Las Vegas (red), and Cleveland (purple) (CPI inflation in blue):
In all three of these cases, prices are actually lower now in real terms than they were 23 years ago or at any time since.
All of the above doesn't tell us that housing starts *will* increase this year, but it certainly suggests that if not this year, then either next year or the year after will see a significant increase. Further, the odds appear favorable that in at least some metropolitan areas, we will see an increase in building at some point this year.


Tuesday, January 4, 2011
ISM Increases
From the ISM:
Just as important, consider the following data points from the report:
The report was issued today by Norbert J. Ore, CPSM, C.P.M., chair of the Institute for Supply Management™ Manufacturing Business Survey Committee. "The manufacturing sector continued its growth trend as indicated by this month's report. We saw significant recovery for much of the U.S. manufacturing sector in 2010. The recovery centered on strength in autos, metals, food, machinery, computers and electronics, while those industries tied primarily to housing continue to struggle. Additionally, manufacturers that export have benefitted from both global demand and the weaker dollar. December's strong readings in new orders and production, combined with positive comments from the panel, should create momentum as we go into the first quarter of 2011."
PERFORMANCE BY INDUSTRY
Of the 18 manufacturing industries, 11 are reporting growth in December, in the following order: Apparel, Leather & Allied Products; Primary Metals; Fabricated Metal Products; Machinery; Computer & Electronic Products; Food, Beverage & Tobacco Products; Textile Mills; Plastics & Rubber Products; Transportation Equipment; Electrical Equipment, Appliances & Components; and Chemical Products. The four industries reporting contraction in December are: Nonmetallic Mineral Products; Paper Products; Printing & Related Support Activities; and Miscellaneous Manufacturing.
So -- we have an industry that is growing, and one that has upward momentum going into the new year. 11 of 18 industries are expanding; only four industries are contracting.
Here are the quotes from survey participants:
The main issue going forward for manufacturing are input prices, which will continue to increase because of high demand and a weakening dollar.
- "Company outlook looks positive into 2011. Solid revenue growth across the globe driven by strong volume in Q3 and Q4 2010." (Chemical Products)
- "We continue to see strong demand for our product in Europe and Asia." (Electrical Equipment, Appliances & Components)
- "The end of the year is surprisingly busy." (Computer & Electronic Products)
- "Business remains slow, while vendors clamor for increases that should have no foundation in economics." (Nonmetallic Mineral Products)[NOTE: this area contracted in the previous month]
- "Strong pressure still exists on raw material prices in almost every area. It is unclear as to whether they can get them." (Plastics & Rubber Products)
Just as important, consider the following data points from the report:
ISM's New Orders Index registered 60.9 percent in December, which is an increase of 4.3 percentage points when compared to the 56.6 percent reported in November. This is the 18th consecutive month of growth in the New Orders Index. A New Orders Index above 50.2 percent, over time, is generally consistent with an increase in the Census Bureau's series on manufacturing orders (in constant 2000 dollars).
The 10 industries reporting growth in new orders in December — listed in order — are: Apparel, Leather & Allied Products; Primary Metals; Furniture & Related Products; Computer & Electronic Products; Machinery; Electrical Equipment, Appliances & Components; Fabricated Metal Products; Miscellaneous Manufacturing; Food, Beverage & Tobacco Products; and Transportation Equipment. The four industries reporting decreases in new orders in December are: Nonmetallic Mineral Products; Paper Products; Chemical Products; and Printing & Related Support Activities.
That's a big increase. Additionally, a majority of industries are printed increased orders.
ISM's Production Index registered 60.7 percent in December, which is an increase of 5.7 percentage points from the November reading of 55 percent. An index above 51 percent, over time, is generally consistent with an increase in the Federal Reserve Board's Industrial Production figures. This is the 19th consecutive month the Production Index has registered above 50 percent.
The nine industries reporting growth in production during the month of December — listed in order — are: Apparel, Leather & Allied Products; Computer & Electronic Products; Primary Metals; Furniture & Related Products; Fabricated Metal Products; Food, Beverage & Tobacco Products; Machinery; Transportation Equipment; and Chemical Products. The six industries reporting a decrease in production in December — listed in order — are: Nonmetallic Mineral Products; Paper Products; Textile Mills; Electrical Equipment, Appliances & Components; Miscellaneous Manufacturing; and Printing & Related Support Activities.
Again, we have a big increase and a majority of industries printing higher numbers.
ISM's Employment Index registered 55.7 percent in December, which is 1.8 percentage points lower than the 57.5 percent reported in November. This is the 13th consecutive month of growth in manufacturing employment. An Employment Index above 49.8 percent, over time, is generally consistent with an increase in the Bureau of Labor Statistics (BLS) data on manufacturing employment.
Of the 18 manufacturing industries, nine reported growth in employment in December in the following order: Apparel, Leather & Allied Products; Primary Metals; Fabricated Metal Products; Food, Beverage & Tobacco Products; Computer & Electronic Products; Transportation Equipment; Machinery; Electrical Equipment, Appliances & Components; and Paper Products. The five industries reporting a decrease in employment during December are: Nonmetallic Mineral Products; Furniture & Related Products; Miscellaneous Manufacturing; Printing & Related Support Activities; and Textile Mills.
This is the one weak point of the report; employment decreased.
Overall, this is a very strong showing and indicates the economy is on track to expand in the new year.
A Closer Look At Banks; $100 - $300 Million
Let's continue our look at financial institutions by examining banks with assets between $100-$300 million.

First note the net interest margin (the difference between what banks pay their customers and what they charge for loans) is near a 25 year low, indicating that making money from the spread is the hardest it's been in a long time.

The average return on assets for these banks is very low by historical norms, as is

Return of average equity.

Total non-performing loans as a percentage of all loans is very high. While the number may have recently peaked, it has just done so. In addition, note the current percentage is higher than the levels seen in the S and L crisis, indicating this category of bank is experiencing an incredibly difficult climate.

Finally, the loan loss reserve is the highest its been in over 25 years.
Like the banks under $100 million in size, institutions between $100 -$300 million are also facing strong headwinds. Earnings ability as measured by the net interest margin, return on assets and average return on equity are all low, indicating that making money is difficult. In addition, loan losses are high and these institutions are having to set aside a fairly large amount of money to cover losses.


Monday, January 3, 2011
Will We Ever Return to Full Employment?
From Bloomberg:
As the U.S. economy gains momentum heading into 2011, small-business employment is lagging behind other drivers of the recovery. While past rebounds were led by companies with fewer than 500 people adding full-time workers, some owners say they’ll rely on part-time help and push their staffs to be more productive as they wait as much as a year for demand to improve. This has helped keep unemployment near a quarter-century high, even as household purchases have risen for five straight months.
“I’m not sure we’ll ever return to the type of full employment we’ve had in the past,” said Charles McMillion, president and chief economist at forecasting firm MBG Information Services in Washington, who has studied labor markets for 30 years. Employment conditions like those of 1999, when the jobless rate was as low as 4 percent, won’t occur “for a very long time, if ever,” he said.
Investors are “rewarding” the efficiencies small businesses adopted to battle the recession because the changes have gone “hand and hand with better profitability,” said Michael Shaoul, chief executive officer of New York-based Oscar Gruss & Son Inc., which provides research to institutional investors.
A Closer Look at Smaller Banks; Banks Under $100 million
Let's start the new year with a look at smaller financial institutions. The Federal Reserve's St. Louis Branch breaks these down into banks under $100 million, banks between $100 - $300 million and total banks under $300 million.

The average return on equity is still low, but it has moved higher over the last bit of time, as has

the average return on assets. In addition,

the net interest margin is near 20 year lows.
The above three charts indicate that earnings power is currently low.

First, note the total non-performing loans as a percentage of all loans is high, but was actually higher in the middle of the S and L crisis.

Also note that net loan losses as a percentage of average assets is also lower than the heights reached in the S and L crisis.

Finally for the under $100 million banks, the total loan loss reserve is increasing and nearing the post S and L crisis level, but isn't at highest point yet (although it could reach that level pretty easily).
The smaller banks have headwinds going forward. First, their net interest margin, return on assets and return on equity are all low, indicating that earnings power is weak. In addition, total non-performing loans are high, although not as high as levels attained in the S&L crisis, nor are total losses as a percentage of average total loans near 20 year highs. But these banks are also having to set aside some of the largest loan loss reserves of the last 20 years. All of these factors add up to a stressed area of the banking industry.
My Reading List From 2010.
This is SilverOz. I have decided in a less economically related post to give a very brief synopsis of the books I have read this year in case anyone has similar interests. The title of each book will be a link to the amazon page.
Crucible of War by Fred Anderson. This book is a fantastic read about the French and Indian War (aka The Seven Years' War) and should be required reading for anyone interested in the founding of our country and/or the American Revolution for without the French and Indian War, our revolution would not likely have happened (at least at the time it did). Without giving too much away, an interesting anecdote from the book is that George Washington helped to start/escalate the war when he lead a massacre of French forces at Jumonville's Glen (while leading British troops and their Indian allies), which of course eventually leads to Washington commanding the American troops in the Revolution and becoming our first president. Overall this book is a fantastic read on a subject that is often overlooked in American history.
The Glorious Cause by Robert Middlekauff. The Glorious Cause is a very detailed and well written account of the American Revolution and the general time period of 1763-1789. The time period overlaps that from the Crucible of War by about three years and is again helpful in understanding the root causes of our Revolution from the British Empire and also goes into detail about what was happening in England (and Parliament) during the period. Another excellent read and well worth the time for anyone interested in the American Revolution (although I would absolutely recommend reading Crucible of War first).
The Ascent of Money by Niall Ferguson. Ferguson weaves a very quick, but interesting read on the financial history of the world (well as much as one can put in about 350 pages). The book does a good job of providing a surface skimming history of the rise of financing, debt, and insurance and is able to tie them together to show the risks inherent to our financial system today.
American Economic Policy in the 1980's By Martin Feldstein et al (an NBER publication). I have actually done a more detailed review of this wonderful read here. Simply a wonderful economic history of the 1980's from the people who were intimately involved in it.
Rendezvous With Destiny by Craig Shirley. This book is an insider's tale of the Reagan campaign of 1980 and is an enthralling read (even if you are not a fan of Reagan). Shirley does a magnificent job of describing both the good and bad from the campaign and even sheds some light on what was happening on the Democratic side as well. The book's best feature in my opinion though, is that it doesn't place Reagan on a pedestal, but treats him (and the campaign) relatively fair throughout. This book is a great read for anyone interested in insider campaign politics or the 1980 election in general.
Politics and Economic in the Eighties edited by Alberto Alesina and Geoffrey Carliner (an NBER publication). This book is a project report by the NBER that examines research on the political economy by political scientists. The book covers topics that include monetary policy, deficits, tax policy, and the savings and loan scandal among others. The book is definitely more wonkish and is substantially more based on the research of political scientists than economics, but it is an interesting read nonetheless (if political science or the eighties are your interests).
Transforming America by Robert Collins. As you can see by now, I was on an eighties kick with my reading this year (as a child of the eighties I hear that can happen). This book by Collins is an examination of the politics and culture of the Reagan years and while Collins is definitely an admirer of Reagan, he does an excellent job of showing both sides of a given issue and includes criticism of many of the policies and actions of the time.
Revolution 1989 by Victor Sebestyen. This was the last book I read this year and was quite honestly the most captivating, as I could hardly put the book down. The book is about the fall of the Soviet Empire and specifically the Warsaw pact countries (ie Eastern Europe) that culminated in 1989. Sebestyen is a marvelous writer who provides amazing insight into what was happening during this period in the Soviet Empire and the people and events that brought about the collapse of the Soviet Bloc. This is a book I would highly recommend to just about anyone regardless of interests.
Yesterdays Market


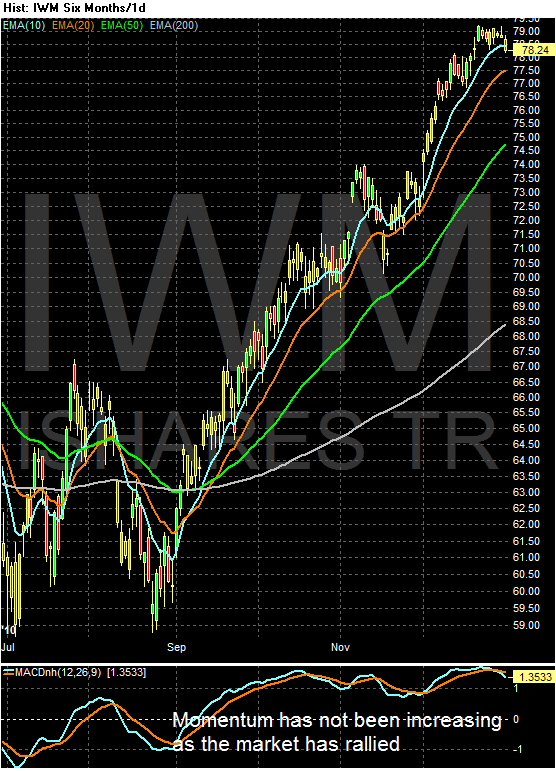

The above five charts indicate momentum is leaving the stock market and may be ready to move back into the bond market. If that is the case, the first 1-3 months of the year would be a consolidation period, where stocks consolidate gains and bonds consolidate losses. Assuming that is the course the markets will take, look at the EMAs as retracement level possibilities.

Subscribe to:
Posts (Atom)