Saturday, November 11, 2023

Weekly Indicators for November 6 - 10 at Seeking Alpha


 - by New Deal democrat


My Weekly Indicators post is up at Seeking Alpha.


How long can the short term outlook stay positive in the face of some of the worst financial background conditions in the past 40 years? Apparently, as long as commodity prices keep declining.

Clicking over and reading will bring you up to the virtual moment as to the condition of the economy, and reward me a very little bit for my efforts.

Friday, November 10, 2023

Consumption leads (longer term) unemployment, too


 - by New Deal democrat


Once again there is no new economic data, so let me follow up some more on the issue of longer term unemployment.


Earlier this week I pointed out that just as initial claims lead continuing claims, so does short term unemployment (under 5 weeks) lead long term unemployment (15 weeks and over). Think of unemployment as a pipeline, and the intake flows before the main body of the pipeline.

Yesterday I followed up by noting that just as initial claims lead the unemployment rate, so continuing claims lead long term unemployment.

Because one of my persistent themes over the years has been that consumption leads employment, let me take a little time and briefly examine a variant of this: does consumption lead *unemployment* as well?

The answer is, generally speaking, yes it does.

First, let’s look at the YoY% change in real retail sales going back 75 years to the inception of the series in 1948 (red) and compare it with the YoY% change in unemployment for 15 weeks and over (inverted, blue):


With the sole exception of the 2001 recession, where the consumer barely participated at all, the answer is pretty clear: while real retail sales are noisier, they clearly turn up and down before longer term unemployment turns.

Now let’s look at the post-pandemic record:


Once again real retail sales turned down YoY about 6 - 9 months before longer term unemployment rose. 

Next, let’s compare real retail sales with continuing claims, which as noted above, lead longer term unemployment as well:


Although sales are much noisier than continuing claims, and there is clearly no one-to-one relationship, in general sales turn up or down coincident with to slightly before the turn in  continuing claims.

Here is the post-pandemic look at that relationship as well:


Sales decayed first, although both crossed the zero line coincidentally. 

YoY real sales have been getting “less negative” and turned slightly positive in September. October’s retail sales will be reported next Wednesday. If the recent improving trend continues, this would be more confirmation suggesting that long term unemployment is not going to significantly worsen in coming months, contra the historical pattern highlighted by Cullen Roche and others.

Thursday, November 9, 2023

Initial claims continue tame YoY; why continuing claims indicate that elevated longer-term unemployment is not signaling recession


 - by New Deal democrat


Initial jobless claims declined -3,000 to 217,000 last week. The 4 week average increased 2,000 to 212,750. With a one week delay, continued claims increased 22,000 to 1.834 million:


More importantly for forecasting purposes, YoY both weekly initial claims and their 4 week average were up 4.8%. Continuing claims remained very elevated, up 27.4%:


So far for the month of November, initial claims are up 3.8% YoY, which forecasts that in coming months the unemployment rate may go back down to 3.6%:


In the meantime, since between March and September claims averaged about 11% higher YoY, the unemployment rate could tick higher by another 0.1% to 4.0% - which could be just barely enough to trigger the “Sahm rule” if it averaged 4.0% for 3 months, since it would be 0.5% higher than the 3 month average low in the unemployment rate of 3.5% for December 2022-February 2023:


But I think this is unlikely, since initial claims never quite passed the threshold for signaling recession, which would require a 12.5% or higher YoY comparison for a full 2 months.

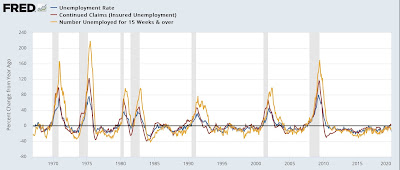
Additionally, I wanted to follow up further on the issue of continuing claims and longer term unemployment. This is because several commentators including Cullen Roche have pointed out “when long term unemployment [for 15 weeks or more] rise by 15% or more year over year we are either in a recession or nearing recession 100% of the time.” Here’s his accompanying graph:


But, just as there is a 50+ year reliable history that initial jobless claims lead the unemployment rate, there is a similar leading relationship between continuing claims (red in the graph below) and the number of long term unemployed (gold). And there is also a coincident relationship between continued claims, averaged monthly, and the unemployment rate (blue):


Here’s the post-pandemic update of that graph:


Although continued claims are very elevated YoY, they have plateaued for the past 4 months. That suggests that the unemployment rate is already at or near its short term high (because it is coincident to continuing claims) and also forecasts that long term unemployment will not significantly worsen, unlike the past episodes Roche highlights, in which continuing claims continued to worsen YoY, as shown above.

Tuesday, November 7, 2023

Rays of sunshine in the supply and demand for credit?


 - by New Deal democrat


Access to and the supply of credit is a long leading indicator. The results of tightening or loosening don’t usually hit the economy for at least a year, sometimes two. The report on that credit for Q3 was just released yesterday, and it contained some positive (or at very least less negative) surprises.


There are two series in the Senior Loan Officer Survey that go back over 30 years: banks tightening or loosening credit, and reporting stronger or weaker demand for that credit. Let’s take a look at each.

The data for tightening standards is one where a positive number is a negative for the economy, since it means more banks are tightening rather than loosening lending standards. And here, the news was “less bad,” which is actually a positive. More banks than not continued to tighten lending standards in Q3, but at a lower rate:


What is interesting about this is that this sort of decline is what we have seen in the past 30 years as the economy is coming *out* of recession, not going into one - with the possible exception of the 1991 recession, where unfortunately the data started just before the brief recession began. We can’t put too much weight on this, given the limited data set, and it may simply be a reflection of the fact that interest rates went down between last winter and summer. Nevertheless, with economic data “good” news starts with “less bad” news, and that’s what this reflects.

This quarter for the first time the Survey broke down demand for credit not just between larger and smaller firms, but between larger and smaller banks as well. To keep the presentation cleaner, I’ve broken this down into two graphs.

First, smaller banks reported reduced demand for credit both from larger and smaller firms:


This is a negative, although once again note that the percentage of the decline has bottomed out, which is very similar to what we saw in the latter part or just after the last two recessions.

But interestingly larger banks reported an *increase* in the demand for credit from larger firms:


This is almost exactly what we have seen coming out of the last two recessions - again, with one important exception. Early in the Great Recession, when it was very shallow and focused on the housing market, a similar pattern occurred, only to be completely reversed when the banking crisis hit.

In other words, as to the demand for credit, once again the news is “less bad.” I am very much hedging my bets on what this means, given the limited history of this series. But it is of a piece with the recent increase in another long leading indicator, corporate profits, so I am keeping an open mind. This might just be a pause in a longer downward trend, or it might be the beginning of an actual turnaround in the long leading indicators.

Monday, November 6, 2023

Scenes from the October jobs report: soft landing vs. continued slow deceleration


 - by New Deal democrat


First, an editorial note: economic news is light this week, so don’t be surprised if I play hooky for a day or two.


That being said, let’s take a look at the most important trends, as I see them, from Friday’s employment report. The Big Question is, are we having a proverbial “soft landing?” Or is that just an illusory phase on the path of deceleration to something worse? Let’s take a look.

Jobs Growth

The 2023 record on job creation is susceptible to both interpretations. Since, alas, one shortcoming of FRED is that it does not have a setting for 3 month moving averages, I am outsourcing this graph to Harvard economist Jason Furman:


If we start from July 2021, there’s a clear pattern of continuous deceleration through this July. But if we start with March on the monthly numbers, or April in the 3 month average, the trend is sideways. It could just be a pause in the longer term trend, or it could be an inflection point. Since nonfarm payrolls themselves are a coincident indicator, we want to look at more leading indicators to see if a more likely answer becomes clearer.

The Leading Metrics in the Report

With a few exceptions, the leading jobs sectors have not turned down yet. Here’s the group of such leading sectors I highlight for each jobs report, plus truck transportation, all normed to their highs at 100:


With the exception of temporary help services, which peaked early last year, and truck transportation, which peaked this past January, all the other sectors are either at their highs or within 0.1% of them.

Separately let’s also look at the manufacturing workweek, one of the 10 “official” leading indicators. I’ve subtracted 40 from the actual number, because before 1983, usually hours had to fall below that measure of full-time work in order to signal recession:


While the workweek has declined by almost 1 hour since its peak, notice that it has stabilized since last December at between 40.6 and 40.9 hours, and is currently at 40.7.

I would expect all of the above metrics to decline, or decline further, before any recession begins. At the moment they are consistent with both the “soft landing” and the “continued slow deceleration” scenarios.


The short and long term Unemployment rate

The unemployment rate is somewhat unique, in that it leads going into recessions and lags coming out. And as I point out each week, it follows initial jobless claims with a lag of several months. Here’s the update of that with Friday’s 3.9% rate included:


This is weak, but it does *not* trigger the Sahm rule, which requires a 0.5% increase from the lowest 3 month averag of the past year. Also remember it is reflecting the very elevated initial jobless claims of several months ago. As initial claims have come back down, I expect some relief in coming months as to the unemployment rate as well.

One “dark” point in Friday’s report was that long term unemployment has increased sufficiently so that in every prior case going back half a century, there was a recession (see TBPInvictus, who way back in the day used to post here, and Cullen Roche, both on the Bird Site]. I want to delve into this separately in another post, but for now I just want to point out that the trend in longer-term unemployment much more often than not follows that of shorter term unemployment. Unemployment for less than 5 weeks was one of the leading indicators highlighted by the late Prof. Geoffrey Moore as one of his leading indicators, and it is part of my regular monthly report as well.

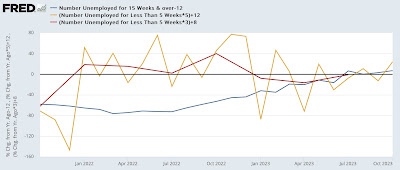
Here is the historical comparison of both short and longer term unemployment historically [I have normed the series so that their current readings = 0; also because short term unemployment (gold) is much more volatile than longer term unemployment (blue), I also include the quarterly average of short term unemployment, which distills signal from noise (red)]:


Once we distill signal from noise, over the long term, shorter term unemployment has almost always waxed and waned before longer term unemployment. Usually but not always they also turn up first before a recession begins as well. 

While longer term unemployment is indeed currently consistent with a recession, short term unemployment is not:


Unless and until both initial jobless claims and short term unemployment confirm the message of longer term unemployment, I am not treating it as anything beyond a caution signal.

Aggregate real payrolls

Finally, as you probably recall, I consider aggregate real payrolls for non-supervisory employees an excellent coincident indicator of recession, when the YoY change in payrolls is less than the YoY change in inflation. Here’s what that currently looks like:


It is likely when we get this month’s inflation report next week that the gap will narrow further, but will remain positive.

This indicator has been saying “soft landing” since the end of last year, but if as I suspect wages keep decelerating while headline inflation stabilizes, it will be more consistent with the “continuing slow deceleration” scenario.

In conclusion, the jobs report for October is convincing that there is no recession now. But it is not convincing for either the “soft landing” or “continued slow deceleration” scenario. If we are truly going to have a “soft landing,” I would expect to see continuing jobs growth of 100,000 or more each month, an unemployment rate below 4.0%, and no downturns in either construction jobs or goods producing jobs as a whole.

I’ll be paying heightene attention to those markers going forward.