Saturday, September 1, 2012
Weekly Indicators: recent trends continue to dominate edition
- by New Deal democrat
In the rear view mirror, 2nd quarter GDP was revised up to 1.7%. With the exception of consumer sentiment, which continued to sour, all of the other monthly data from July came in positive. Personal income and spending were up significantly both nominally and in real terms. The savings rate declined slightly. Factory orders were up more than expected. The Chicago PMI slowed but still showed expansion.
The high frequency weekly indicators are as close as we can reasonably get to observing economic trends in real time, as turns will show up here before they show up in monthly or quarterly data.
The energy choke collar has now re-engaged, and gasoline usage may be slightly weak.
Gasoline prices rose yet again last week, up $.04 from $3.74 to $3.78, and are now higher than a year ago. Oil prices per barrel also rose slightly, up $0.45 for the week at $96.47. Gasoline usage looks a little weak. On a one week basis, it was 9064 M gallons vs. 9227 M a year ago, down -1.8%. The 4 week average at 9073 M vs. 9169 M one year ago, was off -1.1%. This is actually slightly weak compared with a year ago, when gasoline usage had already plummeted on a YoY basis.
Employment related indicators were again mixed this week.
The Department of Labor reported that Initial jobless claims rose 2000 to 374,000 from the prior week's unrevised figure. The four week average rose 2,250 to 370,250, about 2.5% above its post-recession low. If higher oil prices are again acting as a governor preventing fast economic growth, then this number, unforturnately, should continue to rise in coming weeks.
The Daily Treasury Statement showed that for the first 22 days of August 2012, $137.6 B was collected vs. $135.2 B a year ago, a slight $2.4 B or 1.8% increase. For the last 20 days ending on August 30, $115.8 B was collected vs. $110.5 B for the same period in 2011, a solid gain of $5.3 B or +4.8%.
The American Staffing Association Index remained stalled at 93. This index was generally flat during the second quarter at 93 +/-1, and for it to be positive should have continued to rise from that level after its July 4 seasonal decline. That it has not done so is a real concern, as it is now performing worse than it did in 2007 and 2011.
Same Store Sales and Gallup consumer spending were again positive:
The ICSC reported that same store sales for the week ending August 18 gained +0.5% w/w, and rose +3.4% YoY. Johnson Redbook reported a 1.5% YoY gain. The 14 day average of Gallup daily consumer spending as of August 30 was $75, up $7 over last year's $68 for this period. This is the fifth straight week of real strength after six weeks in a row of weakness. This is very encouraging.
Bond yields fell as did credit spreads:
Weekly BAA commercial bond rates declined .06% to 4.96%. Yields on 10 year treasury bonds only .02% to 1.74%. The credit spread between the two narrowed to 3.22%, which is about halfway between its 52 week maximum than minimum, and a significant improvement from several monthsa ago.
Housing reports were modestly positive:
The Mortgage Bankers' Association reported that the seasonally adjusted Purchase Index rose 1.4% from the prior week, and were also up about +2.2% YoY. Generally these are in the middle part of their 2+ year range. The Refinance Index fell -5.7% for the week due to higher mortgage rates, to a 4 month low.
The Federal Reserve Bank's weekly H8 report of real estate loans this week fell 3 to 3512. The YoY comparison rose to +0.9%, which is also the seasonally adjusted bottom.
YoY weekly median asking house prices from 54 metropolitan areas at Housing Tracker were up + 2.0% from a year ago. YoY asking prices have been positive for 9 months now.
Money supply remains generally positive despite now being fully compared with the inflow tsunami of one year ago:
M1 was off a -0.9% last week, and was up a slight +0.2% month over month. Its YoY growth rate declined slightly to +10.0%, as comparisons with last year's tsunami of incoming cash are in full progress. As a result, Real M1 fell to +8.6%. YoY. M2 also fell -0.3% for the week, and was up 0.2% month/month. Its YoY growth rate declined slightly to +6.3%, so Real M2 grew at +5.0%. The growth rate for real money supply has slowed, but is still quite positive as the tsunami of cash arriving from Europe last summer disappears from the comparisons.
Rail traffic was positive while its diffusion index remained steady:
The American Association of Railroads reported a 1.8% increase in total traffic YoY, or +9,900 cars. Non-intermodal rail carloads was off a slight -0.8% YoY or -2,300, once again entirely due to coal hauling which was off -9,000. Negative comparisons remained at 10 types of carloads. Intermodal traffic was up 12,300 or +5.2% YoY.
Turning now to high frequency indicators for the global economy:
The TED spread remained at its 52 week low of 0.33. The one month LIBOR declined to 0.230, setting a new 52 week low. It remains well below its 2010 peak and is lower than at all time during the last 3 years with the exception of about 5 months. Even with the recent scandal surrounding LIBOR, it is probably still useful in terms of whether it is rising or falling.
The Baltic Dry Index fell from 717 to 703. It is now only 33 points above its February 52 week low of 670. The Harpex Shipping Index fell 2 from 398 to 396, and remains only 21 above its February low.
Finally, the JoC ECRI industrial commodities index rose slightly from 120.51 to 120.61. While it remains a strong sign that the globe taken as a whole has slumped, the suggestion albeit from one week's data only is that the slump may be bottoming, and so bears watching to see if the new uptrend continues.
Several recent themes remain dominant. While global shipping rates suggest weakness, the US data remains generally positive. The long leading indicators of bond rates and housing are slightly to signficantly positive. Consumers have rebounded from their early summer slump, despite higher gasoline prices. But those same higher gasoline prices may be impacting new staffing and initial jobless claims for the worse, and gasoline usage is slightly down. Given the positive YoY and growth rate reading for the ECRI Weekly Leading Index, recession concerns are abating, but the Oil choke collar remains a threat for near term weakness.
The last summertime beers and brats await me. You have a nice long Labor Day weekend too!
Friday, August 31, 2012


The Beige Book Summary
The Federal Reserve released the Beige Book this week. Below is the summary of its findings. It provides a great, near real time "you are here" explanation of the where the US economy is.
Begin Excerpt:
Reports from the twelve Federal Reserve Districts suggest economic activity continued to expand gradually in July and early August across most regions and sectors. Six Districts indicated the local economy continued to expand at a modest pace and another three cited moderate growth; among the latter, Chicago noted that the pace of growth had slowed from the prior period. The Philadelphia and Richmond Districts reported slow growth in most sectors and declines in manufacturing, while Boston cited mixed reports from business contacts and some slowdown since the previous report.
Most Districts indicated that retail activity, including auto sales, had increased since the last Beige Book report, although Cleveland, Chicago, St. Louis, Dallas, and San Francisco noted the retail improvements were small. Atlanta said that retail growth had slowed, while Philadelphia indicated growth in retail sales was somewhat faster than in the previous report. Boston, New York, Richmond, Atlanta, Minneapolis, and San Francisco recorded strong performance in tourism. Many Districts reported some softening in manufacturing, either a slowdown in the rate of growth or a decline in the level of sales, output, or orders; among those with declining shipments and orders, Philadelphia noted that the rate of decline was tempering.
Districts mentioning nonfinancial services noted increased activity, although at a slowing pace in Boston, softening in New York, and "flattening" in Philadelphia; Kansas City reported that sales of high-tech services declined slightly. Several Districts cited declining demand for staffing services. According to District reports, bankers in New York, Philadelphia, Cleveland, Atlanta, Chicago, and Kansas City saw increases in demand for most loan types in recent months; by contrast, St. Louis, Dallas, and San Francisco indicated that loan demand was mixed, softening, or slightly weaker.
Real estate markets were generally said to be improving. On the residential side, all 12 Districts cited increases in home sales, home prices, or housing construction. Reports on commercial real estate markets were also generally positive, although San Francisco noted stable demand, Boston indicated conditions were not much changed since the last report, and Richmond, Chicago, and St. Louis said commercial real estate conditions were mixed.
District reports indicated that energy and mining activity was generally high and increasing. However, Cleveland noted softening demand for coal, while Minneapolis and Kansas City had some energy sectors up and some down. The Midwest drought has reduced actual and expected farm output, especially cotton, soybean, and/or corn crops in the Chicago, Kansas City, and St. Louis Districts.
Most Districts reported that the selling prices of manufacturing and retail products were largely stable. By exception, several Districts noted concerns about rising agricultural commodity prices, and Richmond mentioned a small uptick in retail prices. Hiring was said to be modest across the Districts, and wage pressures were characterized as contained.
Consumer Spending and Tourism
Most Districts reported that retail spending in July and early August was up compared with the previous Beige Book. New York and San Francisco noted strengthening sales compared with a softer May and June, although in San Francisco's case, the rise was only "a bit further." Philadelphia, Richmond, Minneapolis, and Kansas City reported stronger retail sales, while Cleveland, Chicago, St. Louis, and Dallas all said that sales were up "slightly." In the Atlanta District, most retail contacts reported slower sales, while Boston's retail contacts provided a mixed assessment. The Atlanta and San Francisco reports noted that discount retailers performed better than traditional department stores, while the Chicago report attributed the pace of growth in consumer spending to heavy discounting by retailers clearing space for back-to-school items. Boston and Chicago reported continuing weakness in furniture sales; Boston also reported weak sales of electronics, but Chicago noted some improvement in this category. Adult clothing sold well in Boston, Chicago, and Dallas. The Atlanta District said that luxury goods merchants, while still largely positive, provided more mixed reports compared with earlier this year; Kansas City cited weaker sales for high-end jewelry. For the remainder of 2012, Boston retailers have mixed sales expectations, Philadelphia retailers are cautiously optimistic, and those in Atlanta are conservative; retail contacts in Minneapolis, Kansas City, and Dallas expect sales to rise through the end of the year.
Automobile sales are up in the New York, Philadelphia, Atlanta, St. Louis, Minneapolis, and Kansas City Districts, flat in Cleveland, Chicago, and Dallas, and a bit slower paced in Richmond and San Francisco; nonetheless, vehicle demand in the latter two Districts is still strong, especially for used cars. The New York District reported that new car sales are "particularly robust" and Kansas City cited a sharp increase in new vehicle sales. Atlanta, St. Louis, and Kansas City indicated that car dealers in their Districts expected these strong automobile sales to continue, while the Philadelphia and Dallas Districts reported concerns that consumer uncertainty might depress vehicle sales in coming months.
Respondents in the Boston, New York, Richmond, Atlanta, Minneapolis, and San Francisco Districts reported that tourist industry performance remains strong. The Atlanta District mentioned that Florida contacts reported a drop in European travelers, but said this decline was offset by an increase in business from Central and South America. Contacts in Boston noted some concern that weakness in Europe could soften tourist activity and that rising gas prices could affect leisure travel. The San Francisco District reported that the pace of growth had slowed in Las Vegas and other areas.
Manufacturing and Related Services
The picture in manufacturing was mixed. The Boston, Chicago, Kansas City and San Francisco Districts reported increasing demand and sales since the previous Beige Book, although the improvement was generally small and uneven, with two of these four Districts reporting that demand growth, while positive, was slowing. Six Districts reported that demand for manufactured goods was actually falling, although none reported a dramatic fall. The outlook was somewhat more positive, with six Districts reporting that manufacturers expected increasing demand and only two reporting the opposite.
Areas of strength were varied. The Cleveland and Philadelphia Districts both pointed to the revolution in natural gas production in the United States as a driver of demand, but the Chicago District said that a contact blamed cheap natural gas for weakness in demand for coal. Several Districts noted that improvements in residential construction boosted demand for products such as lumber, PVC, cement, and home goods. The Chicago and Philadelphia Districts said that auto production was positive, but Richmond said the opposite.
Weakness overseas remains a problem for U.S. manufacturing. Reports from the Boston, Atlanta, and Chicago Districts explicitly mentioned it. Although Europe represented one notable problem, several Districts also mentioned weakness in demand in Asia as an issue. In general, District reports indicate that the cost and availability of raw materials has not been an issue for manufacturers recently, especially as compared with the situation in previous years. Four Districts
reported lower input costs, but contacts in New York reported a slight increase.
On the employment front, there was little movement. Across all Districts, few manufacturing firms reported any major hiring or layoffs, and the ones that did usually attributed it to idiosyncratic factors like new products or restructuring related to a merger. The Cleveland District reported that firms continued to have trouble finding skilled workers. Capital spending also showed little change; in addition, several Districts reported that contacted manufacturers had not revised their investment plans.
Nonfinancial Services
Activity in nonfinancial services generally picked up since the previous report, although results were mixed across Districts and service industries. New York and Philadelphia reported that overall service-sector activity was flat to down slightly, whereas Minneapolis and San Francisco noted expanding activity. Several Districts, including Boston, Richmond, and San Francisco, reported steady to increasing demand for information technology services; Kansas City, by contrast, cited decreased sales at high-tech services firms. Reports from the healthcare sector were also somewhat mixed, with Philadelphia and St. Louis reporting positive results and San Francisco noting a drop in the frequency of elective procedures. Advertisers in the Philadelphia and San Francisco Districts continued to report strong revenues. In the Dallas District, legal firms reported continued increases in demand for services, while accounting firms cited seasonal slowness. Demand for staffing services was generally lower than expected, with decreases reported by Boston, New York, Richmond, and Dallas. Even so, demand remained strong for highly skilled IT personnel in the Boston and Richmond Districts.
Reports on transportation services were generally positive. Rail contacts reported continued increases in intermodal shipments in the Atlanta District and increased cargo volumes in the Dallas District, with both Districts recognizing gains in lumber shipments. Atlanta and Dallas also reported steady to increasing demand for trucking services, whereas logistics firms and carriers in the Philadelphia District reported a relatively sluggish start to the traditional "freight season."
Banking and Financial Services
Credit conditions have improved over the reporting period according to District reports. Credit spreads were lower and competition for high-quality borrowers among lending institutions has increased. The New York District noted that shrinking spreads were observed particularly in commercial and industrial loans as well as in commercial mortgages. Some bankers in the Cleveland District mentioned a moderate loosening of lending guidelines. The New York, St. Louis, and Kansas City Districts reported unchanged credit standards; New York and Cleveland cited declining delinquency rates.
The direction and magnitude of changes in loan demand varied among the Districts and also with respect to type of loan. The Richmond and Atlanta Districts reported generally low demand for loans, but some pockets of growth. The Chicago District noted that growth in business loan demand was generated mostly from small and mid-size firms and for the purpose of refinancing rather than financing capital expenditures. Cleveland, St. Louis, and San Francisco mentioned small positive or negative changes in business credit demand, and relatively strong demand for consumer credit. The Kansas City District reported stable demand for commercial and industrial loans and commercial real estate loans, while Dallas noted softer demand for loans overall; however, both Districts cited increases in demand for residential real estate loans. The New York and Philadelphia Districts observed growth in most lending categories.
Real Estate and Construction
Housing markets across most Districts exhibited signs of improvement, with sales and construction continuing to increase. Dallas reported significant levels of buyer traffic, Richmond noted strong pending sales, and Minneapolis and St. Louis mentioned increases in building permits. New York, Philadelphia, and Chicago indicated improvements as well, but characterized the progress as slow and modest. Declines in inventory levels were reported in Boston, New York, Philadelphia, Atlanta, Dallas, and San Francisco; these declining inventories put some upward pressure on prices according to Boston, Atlanta, and Dallas. A reduction in the stock of distressed properties was mentioned in New York, Richmond, and San Francisco. In Philadelphia and Kansas City, the possibility of shadow inventory entering the market remains a concern. In general, outlooks were positive, with continued increases in activity expected, although the projected gains were more modest in Boston, Cleveland, and Kansas City.
Commercial real estate market conditions held steady or improved in nearly all Districts in recent weeks. New York, Philadelphia, Minneapolis, and Kansas City all reported that commercial leasing increased and vacancy rates fell. New York and Kansas City reported increases in office rents as well; Kansas City also cited a rise in commercial construction. Commercial building permits were up significantly from one year ago in portions of the Minneapolis District. Chicago's report was mixed: office vacancy rates remained high, restraining demand for new office construction, but office leasing demand improved modestly and industrial construction picked up. Atlanta reported rising apartment rents and small gains in office leasing, with weakness in the retail and industrial sectors. Boston reported that office fundamentals were flat on average, with rising rents in portions of Boston proper and muted but steady activity elsewhere in the District. Nonresidential construction picked up in the Boston and Cleveland Districts. Office and industrial real estate markets remained healthy in Dallas. The St. Louis report noted an increase in commercial construction across much of the District and varied reports on leasing across areas within the District. In San Francisco, demand for commercial property was stable while commercial construction was limited. Richmond reported a decline in office leasing volume in Washington, D.C., but some portions of the District recorded increasing sales and construction. Multifamily real estate remained a strong submarket and a key driver of construction in many Districts, including Boston, New York, Philadelphia, Cleveland, Atlanta, Chicago, Minneapolis, Dallas, and San Francisco.
Agriculture and Natural Resources
According to District reports, agricultural conditions were mixed largely because of severe drought conditions that affected the Midwest more than the rest of the country. Producers in the Chicago, St. Louis, and Kansas City Districts were all severely affected by the drought, with cotton, soybean, and corn crops particularly damaged. Cotton production in the Dallas District was also badly damaged, while the northern part of the Minneapolis District reported good corn, soybean, and wheat crops, and the San Francisco and Richmond Districts reported strong demand for their healthy cotton crops. Although nearly all agricultural commodity prices rose, higher feed costs led to reduced herd sizes and lower livestock prices in nearly all Districts reporting on livestock. Reports from the Richmond and Kansas City Districts indicated that farmland values have continued to rise, although contacts in the Kansas City District expected them to hold steady for the rest of the year. Farm incomes generally rose or stayed the same in the Minneapolis District.
Oil and gas activity continued to be robust across most Districts. Extraction of natural gas and petroleum remained at high levels in the Dallas and Minneapolis Districts and expanded in the Cleveland and Richmond Districts, partly because of increased demand from electrical utilities. Production increased in Gulf Coast oil refineries in the Atlanta District as a result of closures along the East Coast, while higher demand for crude oil, diesel, and other distillates supported prices. However, natural gas producers in the Cleveland, Richmond, Minneapolis, and Dallas Districts reported a decline in exploration and drilling of new wells on account of high inventories and low prices. Coal demand was unchanged from 2011 in the St. Louis District but was expected to fall below 2011 levels in the Cleveland District due to reduced demand for thermal coal from domestic utilities and metallurgical coal from Europe and Asia. Iron ore, taconite, and sand mines in the Minneapolis District continued to operate at high capacity.
Employment, Wages, and Prices
Most Districts reported that employment was holding steady or growing only slightly. Several Districts including Boston, New York, Philadelphia, and Richmond noted a softening in employment relative to expectations; upcoming layoffs were reported by a defense contractor in the Boston District and by firms in sectors such as air transportation, appliances, and business support services in the St Louis District. Almost all Districts indicated that manufacturers were continuing to hire, albeit modestly. Demand has been strongest for skilled manufacturing and engineering positions, as well as for IT services. Contacts in the Cleveland, Richmond, Atlanta, Kansas City, and Dallas Districts all reported some difficulty meeting demand for truck drivers.
Overall, upward wage pressure was reported to be very contained across Districts. The Philadelphia and Chicago Districts both noted that despite little wage pressure, some contacts reported upward pressures for medical benefits. Sources from Boston and Atlanta mentioned that continuing demand was putting some upward pressure on wages for highly-skilled positions in software, engineering, and information technology. The San Francisco District also noted specialized IT positions as an exception to generally limited wage growth. The Dallas District reported upward wage pressure for truck drivers and construction workers, and the Minneapolis District noted wage increases in areas with increased oil drilling.
Most Districts reported that overall prices for finished goods were relatively stable despite somewhat increased input prices. Higher prices for grain and other food commodities were cited by many Districts, primarily due to the drought. The Cleveland District noted increased upward pressure on lumber prices, while contacts in Boston, Philadelphia, and Minneapolis reported higher gasoline prices as a potential concern. Chicago mentioned some pass-through of higher crop prices to wholesale prices, while contacts in the Kansas City and Richmond Districts expected to raise future prices in response to more expensive raw materials.
Morning Market Analysis
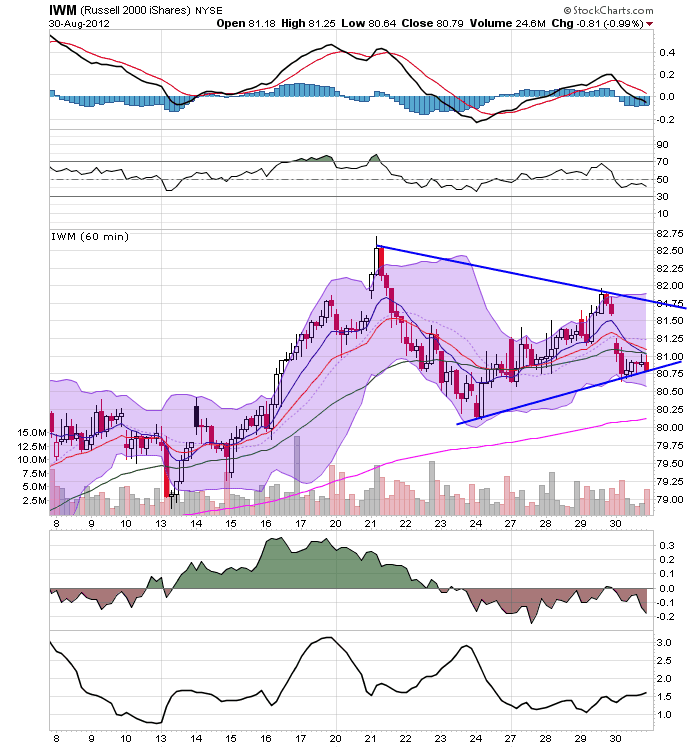


The above 60 minute charts show the US markets are consolidating. The IWMs (top chart) are in the middle of a symmetrical triangle consolidation. The QQQs (middle chart) have been in a tight trading range for the last two weeks. The SPYs (bottom char) are either in a triangle consolidation pattern for the last few weeks or a rectangle pattern for the last week.
Either way, traders are biding their time, waiting for ... something to move them one way or the other. However,

While the equity markets have been rallying, the transports have been stuck in a trading range between 88-94. This is flashing a big warning signal according to basic Dow theory.

The dollar remains at the 200 day EMA and at the lower end of its three month trading range.
Thursday, August 30, 2012
We didn't start a recession in July, either
- by New Deal democrat
With the release of personal income this morning, we now know the values of all four series thought to guide the NBER's recession dating decisions. While all of these series are subject to revisions, of course, as of now the simple fact is that all four rose in July, and three of the four are at post-recession records. So unless they are revised significantly downward, the simple fact is that no new recesion started in July.
Meanwhile, Dwayne Van Vuuren of RecessionAlert and others have succeeded in closely duplicating ECRI's WLI. I was privileged to take part in their effort by helping them identify the relevant variables. According to their calculations the WLI's growth index likely turned positive this week. Further, the YoY values for the index are also close to turning positive. Based on past history, it is extremely unlikely that such values could coincide with a recession.
On the negative side of the ledger, last week I hypothesized that increasing gas pirices wouild disrupt the post-recession seasonality of initial jobless claims declining during the third quarter. This week's unrevised number was higher again, and the four week average has moved back over 370,000. Hardly definitive, but worth watching carefully. I would show you a handy-dandy graph, but due to a glitch in the St. Louis FRED's system, I am unable to do that.
Manufacturing Is Definitely Slowing
While manufacturing was a big reason for the US' recent economic growth, that trend is definitely changing. Recent data shows that manufacturing is slowing. Let's start with the latest ISM data.


The top chart shows the composite manufacturing index, which has printed readings below 50 for the last two months. The bottom charts shows the new orders index, which has also printed below 50 for the lats two months.
Consider the following anecdotal points from the latest ISM report:
"Business has been up for the last seven consecutive months — strong customer orders coming in." (Machinery)
"Automotive demand remains strong." (Fabricated Metal Products)
"Resin pricing has bottomed out so customer orders have increased; it was pent-up demand." (Plastics & Rubber Products)
"We have noticed a marked slowing in business overall. [We] have confirmed this with other companies in our industry as well." (Wood Products)
"Forecasts remain high, but actual bookings remain flat." (Computer & Electronic Products)
"Taking a conservative approach to spending including hiring, travel and inventory. U.S. economy seems stuck — at best — with little to no growth." (Apparel, Leather & Allied Products)
"Business remains surprisingly strong." (Primary Metals)
"Continued slowdown in government military sector spending in advance of the presidential elections has seriously impacted business performance." (Transportation Equipment)
"Business is softening, requiring some down production days." (Furniture & Related Products)
"General state of business this month is flat, with increasing economic uncertainty." (Chemical Products)
I've emboldened the comments that talk about weakening business -- of which there are five points.
From the latest Beige Book:
The picture in manufacturing was mixed. The Boston, Chicago, Kansas City and San Francisco Districts reported increasing demand and sales since the previous Beige Book, although the improvement was generally small and uneven, with two of these four Districts reporting that demand growth, while positive, was slowing. Six Districts reported that demand for manufactured goods was actually falling, although none reported a dramatic fall. The outlook was somewhat more positive, with six Districts reporting that manufacturers expected increasing demand and only two reporting the opposite.
Other regional reports are also showing weakness. Consider the latest Empire State index:
The August Empire State Manufacturing Survey indicates that conditions for New York manufacturers deteriorated over the month. The general business conditions index slipped below zero for the first time since October 2011, falling thirteen points to -5.9. At -5.5, the new orders index was below zero for a second consecutive month, and the shipments index fell six points to 4.1. The prices paid index climbed nine points to 16.5, pointing to a pickup in the pace of increase in input prices, while the prices received index hovered just above zero for a third consecutive month. The index for number of employees inched lower, but remained positive at 16.5, suggesting a moderate increase in employment levels, and the average workweek index rose to 3.5. Indexes for the six-month outlook were generally positive but lower than in July, indicating that respondents expected business conditions to improve little in the months ahead.
We see a similar set of facts in the Philadelphia survey:
The survey’s broadest measure of manufacturing conditions, the diffusion index of current activity, increased 6 points, to a reading of -7.1. This marks the fourth consecutive negative reading for the index but also its highest reading since May (see Chart). Nearly 30 percent of firms reported declines in activity this month, exceeding the 22 percent that reported increases. Indexes for new orders and shipments remained negative. The new orders index improved one point, while the shipments index fell 3 points.
Richmond is experiencing a similar slowdown:
In August, the seasonally adjusted composite index of manufacturing activity — our broadest measure of manufacturing — gained eight points to −9 from July's reading of −17. Among the index's components, shipments increased twenty-four points to 1, new orders picked up five points to end at −20, and the jobs index moved down six points to −5.
Most other indicators also suggested some easing in the pace of recent weakness. The index for capacity utilization picked up seven points to −9, and the backlogs of orders edged up two points to −25. Additionally, the delivery times index added one point to −4, while our gauges for inventories were mixed in August. The raw materials inventory index was virtually unchanged at 24, while the finished goods inventory index fell three points to end at 18.
Morning Market Analysis

The SPYs have sold off a bit from their recent advance. However, prices are now consolidating at levels established in late March. They are also using the 10 and 20 day EMAs for technical support. Finally, the declining volume over the last three days indicates this is not a big sell-off, but instead a technical pause.


The treasury market market has rebounded from its sell-off. The top chart shows the IEF daily where prices have rebounded to the 50% Fib level. However, the last three days worth of candles are weak; the bodies are very narrow and the shadows are thin, indicating the rally has stalled for now. The lower chart (the sixty minute chart) shows that prices are hitting resistance at levels established in early August.

The copper market is still consolidating at low levels, with the ETF trading between 42 and 45 for the last two months.


The Real -- which has been selling off in tandem with the weakening of the Brazilian economy -- is also consolidating. The top chart shows prices are using the 200 week EMA as technical support. The lower chart (which is daily) shows prices have a slight upward bias. However, this is really still a consolidating move.
Wednesday, August 29, 2012
The Pied Piper of Doom's perfect (contrary) record stays intact: house prices edition
- by New Deal democrat
As reported yesterday, the Case Shiller housing index, which bottomed on a seasonally adjusted basis in January, has turned positive YoY as well. This by the way is a good example of how YoY data lags seasonally adjusted data, since the YoY turn has come 5 months later than the seasonally adjusted bottom.
All of which means that the predictions of the Pied Piper of Doom have once again proven to be almost perfect indicators - of the exact opposite. In February he wrote:
Statistically speaking, perhaps the most underreported story on our economy, right now, concerns the “shadow inventory” nightmare that currently exists throughout the U.S. housing market. This has been further exacerbated by many years of misinformation (i.e.: ongoing overstatements of home sales figures) provided by the “ethically-challenged” National Association of Realtors (NAR).He went on to quote an article by Michael Olenick published at Naked Capitalism, and disseminated Olenick's insult of perhaps the nicest economic blogger there is:
Throughout the mainstream media, and even amongst some of the more normally-credible sources on our economy in the blogosphere* [*NDD note: this was a swipe at Bill McBride a/k/a Calculated Risk, as is clear below], we’re now hearing about how the housing market is “modestly improving.” Frankly, this is total propaganda; statistical “improvements” have been nominal, at best; since virtually all of these “reliable” sources are still, to this day, all but ignoring (both statistically and editorially) this extremely pertinent, albeit inconvenient, reality.
The normally astute Bill McBride of Calculated Risk has joined the chorus of cheerleaders to argue that an alleged decrease in housing inventory means that house prices are near their ethereal bottom.He concluded by taking one more swipe at CR:
Here's the link to the top story over at Calculated Risk, this morning... Case Shiller: House Prices fall to new post-bubble lows in December …and here's McBride's most recent piece on new home sales… New Home Sales: 2011 Still the Worst Year, "Distressing Gap" remains very wide by CalculatedRisk on 2/24/2012 12:09:00 PM (The shadow inventory issue is not mentioned in either piece.)He rivisited this prediction of ongoing Doom one more time in March:
All of those “housing-has-bottomed” memes you’re now reading about (which conveniently don’t even reference, let alone discuss or acknowledge, an unreported massive “shadow inventory” in U.S. housing that’s not covered in the common metrics used nowadays in the MSM, or even in the blogosphere), HERE’s the latest from Michael Olenick, a favorite of Yves Smith over at Naked Capitalism: “Beware of Housing Market Cheerleading.”Alas for the Pied Piper of Doom, the Case Shiller seasonally adjusted bottom of January 2012 was reported in March literally within days of his later screed. In fact, the Index is now up 3.5% from its January level, meaning that it has outpaced inflation as well. Further evidence of the bottom is that almost every other housing price index has followed a similar pattern.
He's stayed away from predictions recently, which is really kind of a shame, because he became almost a perfect bellwether.
Just not the kind of bellwether he thought.
Once Again, University of Chicago Gets It Wrong
From John Cochrane
A really good example: What will the effect on output and employment be of ending 99 weeks of unemploment insurance? That's part of the fiscal cliff, and the CBO's analysis (see above) says that reducing unemployment insurance will lower GDP. Really? A standard economic analysis comes to exactly the opposite conclusion. Generous unemployment and disability means that some people choose to stay unemployed rather than take lower-paying jobs, or jobs that require them to move. So long as you stay unemployed, you get a check from the government. Subsidizing anything produces more of it. So, a standard analysis says that cutting back unemployment insurance lowers unemployment, and raises output and this part of the fiscal cliff analysis should go the other way.
Before you go all nuts on how heartless I am, keep the question in mind. I didn't say what's good or bad, I said what raises or lowers GDP and unemployment. The standard analysis of unemployment insurance says, yes, it raises unemployment and lowers GDP, but it provides important insurance for the truly needy and unfortunate. It's something we do out of compassion even though it hurts us.
But the CBO didn't score national welfare, or a compassion index. They scored GDP and unemployment, and their model comes to the opposite conclusion, subsidizing unemployment causes more GDP and less unemployment. As well as being compassionate. How do we have our cake and eat it too? Well, that's the magic of Keynesian economics, on which I will not digress here.
First, I understand that Mr. Cochrane is not making a value judgement. However, his statement regarding the amount of benefits is completely and utterly false. Consider the following:
Unemployment benefits are intended to partially replace lost wages, so the precise amount you receive will depend on what you used to earn. States use different formulae to calculate benefit payments, but all states take prior earnings into account in some way. Some states consider the employee's prior annual earnings, others look at the employee's earnings during the highest paid quarter or two quarters of the base period. (For more on the base period, see Nolo's article Unemployment Compensation: Understanding the Base Period.)
All states also set an upper limit on the total weekly benefit amount. A common formula is to pay half of what the employee used to earn, up to a cap that's tied to the average earnings in that state. This means that employees with higher wages may receive a larger overall benefits check, but a smaller percentage of what they used to earn. The maximum amount an employee can receive each week varies widely from state to state.
Some states provide an additional benefit amount to employees with dependents. These amounts tend to be small; most states that provide this benefit offer $25 or less per dependent per week in additional benefits.
Unemployment benefits are taxable. (Although the first $2,400 in unemployment benefits was not subject to federal income tax in 2009, that provision was not renewed for subsequent years.) You may elect to have up to 10% of your benefit amount withheld to pay federal income taxes.
And consider this:
The goal of the unemployment insurance program, according to the Center on Budget and Policy Priorities, is to provide people with about half their normal wage. However, it almost never works out that way. The average American collected $295 in weekly unemployment benefits in the third quarter of 2010, according to the most recent government data. But the average weekly salary in that same quarter was $865, which means the jobless benefits replaced just over a third of the average worker's salary.
According to Mr. Cochrane, benefits are so generous that they would keep people from working. However, that is not the case. Unemployment benefits pay a portion of what the unemployed person previous made with caps. In addition, if there are dependents, they receive a small, additional amount -- but it's not that much. Also consider these benefits are taxable, further lowering the amount received.
As the second excerpt shows, unemployment insurance really doesn't provide an incentive to remain unemployed -- unless making less than half of your previous wage is somehow and incentive (which it's not). Put another way -- reality (facts, data, people living within a linear space/time continuum) completely contradicts Mr. Cochrane's views.
In case you're wondering, I found the information regarding the amount of unemployment benefits by using a tool called "Google." It really helps with research.
I should also add, Mr. Cochrane is more than welcome to prove me wrong by happily living off of his statutorily calculated unemployment benefits for a period of 12 months. Something tells me he won't take the bet.
Mr. Cochrane continues:
The CBO’s projections are deeply and explicitly Keyneisan, relying on “multipliers.” If the government borrows a billion dollars and blows it on some useless porkbarrel project, the CBO will project that this raises GDP to the tune of one and a half billion dollars. In analyzing the “fiscal cliff,” reducing such projects is bad for the economy. That’s the key source of their estimate that the fiscal cliff leads to recession. If you, like me, think that the government spending less money on useless projects (say, ethanol subsidies) has a positive effect on output, or that taking less money from A and giving it to B has little effect, then you will not be so worried.
Note the assumption being made: all government spending is by definition bad and wasteful. There's a complete dismissal of the good projects that government provides. For example, I bet if we proposed completely eliminating the department of defense -- that department with the famed $100 toilet seat -- we'd hear howls of protest. And what about eliminating all highway money? Somehow I doubt FedEx or UPS would be on board for that one. I tend to think the pharmaceutical industry would have issues with eliminating the NIH. And think about all the great innovations that have been created and implemented by the nerds at NASA? In short, there's a lot of good that comes from government spending which would take a Herculean effort not to see (although Mr. Cochrane is making just such an effort).
And it's not like the private sector is a glowing source of efficiency. The entire housing bubble was a private sector phenomenon, greatly aided by massive deregulation. Wall Street has been the home of several multi-billion dollar Ponzi schemes (Stanford and Madoff anyone?). Private contractors cut corners everyday (endangering those who purchase real estate), lawyers, doctors and CPAs give plenty of bad advice on a regular basis ... you get idea at this point.
The above points illustrate very clearly that Mr. Cochrane's basic assumptions underlying his analysis are completely wrong. And that makes his arguments moot.
Morning Market Analysis
Today, I want to look at the currency markets. More importantly, I want to note that the currency markets have been remarkably stable. Consider the following:

For the last year, the Australian dollar has been trading between the 95 and 105/107 level.

With the exception of the a bump in the Spring and fall of last year, the British Pound has been trading between the 152 and 164 level.

The Canadian dollar has been trading between the 96 and 101 level since the beginning of this year.

After last summers intervention, the Swiss Franc has been in a very slightly, downward sloping channel.

The Japanese yen has been trading in a consolidation pattern for the last three months. Last summers sell-off was the result of the Bank of Japan stating they would engage in additional easing.
The point of the above is to illustrate that the currency markets have been very stable for some time.
Tuesday, August 28, 2012
Bonddad Linkfest
- Choppy markets give way to orderly accumulation (Marketwatch)
- Spanish yields drop at auction (Marketwatch)
- Is Australia in the same boat as Europe (Alphaville)
- Texas manufacturing positive but weak (Dallas Fed)
- Australian new home sales drop (NHSS)
- German consumer confidence drops (GFK Group)
- France may lose bond market support (BB)
- Spanish recession deepens (BB)
- Which simple rule for monetary policy (Economics One)
- The cost benefit analysis (Macroblog)
Inflation Really Isn't An Issue

Above is a chart for the year over year percentage change in CPI for the US (blue line) Japan (red line) Euro area (green line) and UK (yellow/gold line). The FRED database only has non-seasonally adjusted numbers. If you look at the chart, you'll notice the inflation isn't an issue right now.
It isn't just Case Shiller: almost every house price index has bottomed
- by New Deal democrat
This morning's Case Shiller report for June showed prices in the 20 city composite rising YoY for the first time since 2007, with the exception of a few months during the $8000 home buying tax credit in 2010. Prices were up +0.5% YoY, and were also up +0.9% month over month from May to June on a seasonally adjusted basis. This is the fifth straight month of seasonally adjusted price gains. In other words, this increase in no way is a reflection of seasonal buying patterns. It is confirmation that housing prices bottomed earlier this year.
But the Case Shiller index is only one house price index. There are a dozen such indexes, all relying on different methods. There are asking prices indexes, median and mean sales price indexes, and repeat sales indexes. Within each type there are seasonally adjusted and non-seasonally adjusted metrics. Back in April I reported on slew of house price indexes, and concluded that March may have marked the turn in the market. With the Case Schiller index turning positive YoY, now is a good time to check those indexes again. Do they contradict the Case Shiller turning point, or do they confirm it?
Let's look at each of the three groups of indexes - list prices, mean and median prices, and repeat sales indexes - in turn.
List prices
The theory here is that sellers have to price to meet the market. If they are doing so, then the trend in list prices will lead the trend in sales prices, since sales are consummated months after the property is listed. There are three of these, two non-seasonally adjusted and one seasonally adjusted.
Housing Tracker is a non-seasonally adjusted index of 54 markets with data back to the peak of the housing bubble. This index began turned positive on a YoY basis last December and has remained positive ever since. Yesterday they reported that asking prices continued to be positive YoY by +2.0%.
The NAR recently began to publish its own a non-seasonally adjusted index made up of all of its listings. The NAR's index showed that asking prices were still negative, down 2.5% in December 2011, but turned positive YoY by February, up 6.82%. Their report for July showed prices flat from June, and up 2.6% YoY.
Earlier this year the Trulia asking price index debuted. This is a seasonally-adjusted index. In their inaugural report for March 2012, they indicated that asking prices had bottomed in January. Their July report showed that prices had now risen for 6 months in a row. The most recent monthly advance was +0.5%, and prices are now up YoY by 1.1%.
Median and mean sales prices
There are three of these indexes. The first only takes into account new home prices. None are seasonally adjusted, so we have to look at YoY trends.
Each month the Census Bureau reports on new home sales. The report includes both mean and median home prices on a non-seasonally adjusted basis. Both the YoY median and mean prices turned positive in February and remained positive in March. This continued through May. In their July report, they show prices down -2% YoY.
The NAR's existing home sales report also includes sale prices. According to the NAR, sales prices for existing homes on a non-seasonally adjusted basis turned positive YoY in March. Their July report indicated that sales prices for existing homes were up for the fifth month in a row. and were also up 9.4% YoY.
Radar Logic is another non-seasonally adjusted index of sales, based on prices paid per square foot. They reported earlier this month that prices had turned up +2.0% month over month from April to May and also +0.7% YoY.
Repeat sales indexes
There are six sources of repeat sales and other indexes which control for price or quality of house. The first is not seasonally adjusted, so we must look YoY. The other 5 are seasonally adjusted, so a turn in trend can be spotted without waiting for the YoY metric to turn.
CoreLogic makes use of repeat sales transactions to create a House Price Index which is not seasonally adjusted. Excluding distressed sales, month-over-month prices increased 0.7 percent in February from January. This trend has continued, as for June their House Price index was reported up 2.0% month over month, and 3.2% YoY.
The FHFA, which gathers seasonally adjusted house prices, reported a month over month gain of 0.7% in June and YoY gain of 3.6%".
FNC is not actually a repeat sales index but FNC "has developed a hedonic index based on the data collected from public records and blended with data from appraisals." It is reported for 10, 30, and 100 metropolitan areas. In their most recent report, for June the index was up for the fourth consecutive month, up 1.1% month over month non-seasonally adjusted. Further, their hedonic repeat sales index was down only -0.2% YoY. The index was down -0.6% in April, and =0.4% in May. If the trend this year continues, their report will turn positive YoY in the August report if not in July's.
Lender Price Services (LPS) has a House Price Index which controls for houses for sale in a variety of price brackets in order to avoid problems with the median result based on the mix of houses for sale. Their last report of August 3rd showed that house prices were up 0.9% month over month and up 3.2% YoY.
Finally, Zillow has also started reporting its own index of house prices. For July, they reported that prices had turned positive YoY for the first time since 2007, up +1.2%. This was the eighth consecutive month of price gains in that index. Prices in July rose +0.5% from June.
At this point, every single asking price index has turned positive. So have mean and median sales prices of existing homes as reported by both the NAR and Core Logic on a non-seasonally adjusted basis. Since both of these have turned positive YoY, it is not a matter of seasonality. So have 5 out of the 6 repeat sales indexes, including Core Logic, FHFA, Lender Price Services, Zillow, and as of this morning on a YoY basis, Case Shiller. Only the FNC repeat sales index, which is down -0.2% and likely to turn positive YoY within a month or two, and the very erratic Census Bureau mean and median new home sales price index, are not positive on a seasonally adjusted or YoY basis.
In June of 2011, relying on Housing Tracker's stabilizing asking price data, I wrote that:
To put it bluntly, an examination of the newly available aggregate US asking price data from Housing Tracker contradicts the conventional wisdom above that, as "the housing market ... ha[s] another 15% downside to go," and that "reasonable expectations for asset price stability, if not appreciation [a]ppears unlikely to happen any time soon."While the permabear Doomers will stamp their feet, the simple fact is that there is now overwhelming evidence that the housing market has bottomed exactly when I said it would. The only question now is whether it is a long term bottom, or whether it might still be undone by the long-fabled but yet to appear foreclosure tsunami.
To the contrary, housing prices have already "faced the brunt of market forces" without support for a full year, as a result of which they have been falling closer and closer to equilibrium, the rate of decline is abating, and actual real time data shows that nominal if not inflation adjusted stability may indeed be reached as soon as early next year.
Morning Market Analysis


The two charts above (a daily and weekly gold chart, respectively) show that gold has stopped consolidating between ~150-159 and advanced through resistance. Notice how the weekly chart's CMF telegraphed this event by continually advancing for the last three months.

The euro has broken out of its downward sloping channel and is now moving higher. However, this is not a very strong breakout. There is no accompanying volume spike and we don't see prices exhibiting a runaway rally. Instead, prices are moving higher in an upward sloping channel. However, for only the second time in the last six months, notice the 10 day EMA has moved through the 50 day EMA with the 20 day EMA about to follow.

The Brazilian market -- which had broken out of a bottom consolidation -- has fallen back to support. The market is also receiving support from the 50 day EMA. However, this appears to be a standard, post-break-out profit taking situation.

The Spanish market has also bottomed and made an upside break-out. Prices are now using the 50 day EMA for technical support and the 200 day EMA for resistance. The next big area of movement is obviously the 200 day EMA.
Monday, August 27, 2012
Bonddad Linkfest
- Romney 47, Obama 46 in new WaPo poll (WaPo)
- Romney outlines governing style (Politico)
- Iceland was right and everybody else was wrong (BP)
- Fed contemplates new bond buying program (Reuters)
- Business spending hints at further factory weakness (Reuters)
- Merkel reins in Greek exit talk (BB)
- German business confidence declines (IFO)
- Insurers face big losses on drought claims (FT)
- Russians spend it while they have it (FT)
- Brazil data shows signs of recovery (FT)
The Long-Term Market Still Isn't Breaking Out

The above chart shows the SPYs for the last 10 years. Notice that, in the grand scheme of things, we've really only traded in a big range. Granted, it's a 70 point range, but there hasn't been a meaningful appreciation above previous highs. In fact, right now, we're (again) running up against very long-term upside resistance.

The Russell 2000 has formed a triangle consolidation pattern over the last three years.

The QQQs have moved through previous highs. But remember that prices are still below tech bubble levels.

At the same time, over the last 10 years, we've seen a massive rally in the bond market.
Morning Market Analysis


The daily SPY chart (top chart) shows that prices broke an uptrend last week and also moved through support established a little over six months ago. Prices are now resting on the 20 day EMA. The 60 day chart (lower chart) shows the trend break and also that prices found support around the 140 level -- a price level developed on the 60 minutes chart between the 7-9 of August. The MACD on the daily chart has given a sell signal, indicating we are more than likely moving into a period of consolidation.

In contrast the QQQs rallied into resistance, broke through a bit and then retreated to the 10 day EMA for technical support.

In contrast, the bond market rallied last week, breaking through the upper channel line and rebounding to the 50% Fib level. However, so far this is a technical bounce. Note the negative CMF reading and declining volume on the rally. While the MACD is about to give a buy signal, it is doing so in negative territory, which makes the signal weaker.

Oil has broken out of its ascending triangle consolidation and moved about the 200 day EMA. Political events (Iran's nuclear program) and supply issues (read North Sea issues) are driving prices higher right now. Note that the chart is becoming more bullish -- the shorter EMAs are rising, the 10 day EMA has moved above the 200, the 20 is about to cross and prices are above all the EMAs.

The first big feature of the dollar chart is the declining MACD -- which has been moving lower since the beginning of June. This corresponds to the time during which prices have been consolidating between the 22.4 and 23.1 level. Now prices are at the lower end of their recent trading range and using the the 200 day EMA for technical support. The most important part of this chart is what it signals fundamentally: the dollar has been a safe haven currency for the duration of the EU crisis, so a sell-off would indicate the "risk-on" trade is back.
Subscribe to:
Posts (Atom)