Saturday, March 5, 2022

Weekly Indicators for February 28 - March 4 at Seeking Alpha


 - by New Deal democrat

My Weekly Indicators post is up at Seeking Alpha. 

There are two big stories dominating the data. The first is how inflation, and the anticipated Fed rate hike, are affecting interest rates. The second is the ramifications, particularly for commodities, of the new Iron Curtain that has descended around Russia. 

As usual, clicking over and reading should bring you up to the virtual moment as to the state of the economy, and also rewards me just a little bit for the effort I put in to bring it to you.

Friday, March 4, 2022

February jobs report: a Big Win!


 - by New Deal democrat

There were two main trends I was looking for in this jobs report: 

1. Is the pace of job growth beginning to decelerate? 
2. Is wage growth holding up? Is it accelerating?

The answers were:
1. The 6 month average of monthly gains, which was running at 548,000 in the 2nd half of 2021, increased in February to 582,000.
2. Wage growth, which averaged 5.9% in the 2nd half of 2021, is now up 6.7% YoY. Aside from April 2020, this is the highest wage growth in *40 years.* 

We still have 2.105 million jobs to go, or 1.4%, to equal the number of employees in February 2020 just before the pandemic hit. At the current average rate for the past 6 months, that’s about 4 more months.

Here’s my in depth synopsis of the report:

HEADLINES:
  • 678,000 jobs added. Private sector jobs increased 654,000. Government jobs increased by 24,000 jobs. The alternate, and more volatile measure in the household report indicated a gain of 548,000 jobs, which factors into the unemployment and underemployment rates below.
  • U3 unemployment rate declined -0.2% to 3.8%, compared with the January 2020 low of 3.5%.
  • U6 underemployment rate rose 0.1% to 7.2%, compared with the January 2020 low of 6.9%.
  • Those not in the labor force at all, but who want a job now, declined -349,000 to 5.355 million, compared with 4.996 million in February 2020.
  • Those on temporary layoff decreased -71,000 to 888,000.
  • Permanent job losers declined -47,000 to 1,583,000.
  • December was revised upward by 78,000, and January was also revised upward by 14,000, for a net gain of 92,000 jobs compared with previous reports.
Leading employment indicators of a slowdown or recession

These are leading sectors for the economy overall, and will help us gauge how strong the rebound from the pandemic will be.  These were *very* positive:
  • the average manufacturing workweek, one of the 10 components of the Index of Leading Indicators, rose +0.3 hours to 41.7 hours. This is a big jump, and is very positive.
  • Manufacturing jobs increased 36,000. Since the beginning of the pandemic, manufacturing has still lost -179,000 jobs, or -1.4% of the total.
  • Construction jobs increased, 60000. Since the beginning of the pandemic, -11,000 construction jobs have been lost, or -0.1% of the total.
  • Residential construction jobs, which are even more leading, rose by 6,700. Since the beginning of the pandemic, 52,000 jobs have been *gained* in this sector, or +6.2%.
  • temporary jobs rose by 36,000. Since the beginning of the pandemic, 240,400 jobs have been gained.
  • the number of people unemployed for 5 weeks or less decreased by -286,000 to 2,131,000, which is only 8,000 higher than just before the pandemic hit.
  • Professional and business employment increased by 95,000, which is 596,000 *above* its pre-pandemic peak.

Wages of non-managerial workers
  • Average Hourly Earnings for Production and Nonsupervisory Personnel: rose $0.8 to $26.94, which is a 6.7% YoY gain. 

Aggregate hours and wages:
  • the index of aggregate hours worked for non-managerial workers rose by 0.7%, which is a  loss of -0.8% since just before the pandemic.
  •  the index of aggregate payrolls for non-managerial workers rose by 1.0%, which is a gain of 11.2% (before inflation) since just before the pandemic.

Other significant data:
  • Leisure and hospitality jobs, which were the most hard-hit during the pandemic, rose 179,000, but are still -1,532,000, or -9.0% below their pre-pandemic peak.
  • Within the leisure and hospitality sector, food and drink establishments increased 124,000 jobs, and is still -824,000, or -6.7% below their pre-pandemic peak.
  • Full time jobs increased +642,000 in the household report.
  • Part time jobs decreased -16,000 in the household report.
  • The number of job holders who were part time for economic reasons increased by 418,000 to 4,135,000, which is a decrease of -255,000 since before the pandemic began.

SUMMARY

This was simply an excellent jobs report. The only (slight) blemishes I can find are the slight increase in the underemployment rate, and the increase in those part time for economic reasons, a big component of that underemployment rate. 

Everything else was positive, including *all* of the leading indicators in the report, plus the revisions to the last two months. Manufacturing turned more positive, with the recent decline in the manufacturing workweek almost totally reversed. Construction jobs are almost completely back to their pre-pandemic levels. Even labor and hospitality jobs, including food and drink jobs, made sizable gains - although at their current pace, it will take over half a year for those to return to pre-pandemic levels.

Because real sales and income have not improved in over half a year, I expect the pace of job gains to slow considerably in the coming months. But not this month: this was simply a big win!


Thursday, March 3, 2022

Conintuing claims continue near 50 year lows as the Omicron tsunami continues to recede


 - by New Deal democrat

[Programming note: Hopefully I’ll put up a coronavirus update later today.]

Initial claims (blue) declined 18,000 to 215,000 (vs. the pandemic low of 188,000 on December 4). The 4 week average (red) declined 6,000 to 230,500 (vs. the pandemic low of 199,750 on December 25). Continuing claims (gold, right scale) increased 2,000 to  1,476,000, (vs. 1,474,000 last week, which was the lowest number in over 50 years):


The Omicron tsunami has continued to recede, and with it the recent increase in initial claims. I still suspect we have seen the lows in initial claims for this expansion.

The decline in continuing claims to a 50 year+ low means that the record tightness in the jobs market isn’t going away anytime fast. There will be continuing upward pressure on wages. 

I don’t think this has any particular ramifications for tomorrow’s jobs report, but in general I am expecting monthly job gains to slow over the coming few months.

Wednesday, March 2, 2022

February car sales decline, but truck sales continue rebound; plus a comment about the urgency of dealing with supply chain issues


 - by New Deal democrat

I used to follow vehicle sales more closely - until the vehicle manufacturers, one by one, stopped reporting monthly, and only updated quarterly for the previous quarter. That makes the data much less timely, so much less useful.


Fortunately the BEA does keep track of sales, although for some reason FRED is only able to publish the figures with a one month delay. 

Here is the drill: light vehicle sales generally turn down *after* home sales, but before most other consumer durable goods and other consumer purchases. This makes them a useful short leading indicator, although as you can see below (blue line), they are quite noisy. Heavy truck sales, by contrast (red), turn down earlier, and much more sharply, with much less noise (and the also turn up later after a recession is over):


Heavy truck sales have turned down at least 15%, and usually much more, before a recession has hit.

Now let’s take a look at the last 12 months:


Both car and truck sales peaked early last spring, and bottomed last September. Car sales were down -33%, and truck sales were down -21%. Although not shown, in February according to the BEA, heavy truck sales increased to 0.471 million, only down -8% from their peak. Car and light truck sales decreased again to 14.1 million annualized, down -23% from peak.

Both light and heavy vehicle sales last autumn were consistent with - but did not necessarily mean - an oncoming recession.  The rebound in heavy truck sales in the past few months suggests that was a false positive, and is consistent with basically all of the other production and manufacturing data we have received, such as yesterday’s ISM manufacturing report, and durable goods orders.

At the same time, it would behoove the Biden Administration to really lean on, and assist, vehicle manufacturers to solve their supply chain problems. This has gone on for over a year, it has done enough damage to the economy, and Russia’s invasion of Ukraine demonstrates the urgent national security considerations with this type of offshoring.

Tuesday, March 1, 2022

Manufacturing continues red hot, while construction gains completely consumed by inflation


 - by New Deal democrat

February monthly data started out this morning with the ISM manufacturing report. The index, especially its new orders subindex, is an important short leading indicator for the production sector. 

In February the index rose from 57.6 to 58.6, as did the more leading new orders subindex, which rose from 57.9 to 61.7. Since the breakeven point between expansion and contraction is 50,  these are both very strong numbers - as they have been for most of the past 18 months:


This forecasts a strong production side of the economy through summer.

The second release that typically begins the month, construction spending for two months ago (January), rose 1.3% in nominal terms for overall spending including all types of construction, while the leading residential sector also rose 1.3%. Nominally, both made new all-time highs:


Adjusting for price changes in construction materials, which jumped another 2.7%, “real” construction spending declined another -1.4% m/m, continuing an almost relentless decline from one year ago. In absolute terms, “real” construction spending has declined sharply - by -19.9% - since its peak in November 2020,  while “real” residential construction spending has declined -15.6% since its post-recession peak in January of this year:


While total construction spending has declined by more than the -10.4% it did before the Great Recession, the decline in residential construction spending, while increasingly substantial, remains nowhere near the -40.1% decline it suffered before the end of 2007:


Real residential construction spending does not appear to be at a recession level decline at this point. If mortgage rates continue to be higher than 4%, this could well change in the next few months.


Monday, February 28, 2022

No signs of the international political crisis creating any Western economic crisis at this point


  - by New Deal democrat

No important economic data today, and no significant COVID updates over the weekend. Let me make a few comments and then turn to the bond market, particularly as it reflects the international situation.


I have no more insight into the Ukraine matter than probably any other well informed average citizen. It feels like the closest Russia and the US have come to actual war since the Cuban Missile Crisis in 1962 - but only in relative terms. I have a recollection back then of walking to the bus stop in the morning, and being told by my older sibling unit that the world might end at noon. I think I simply nodded and accepted that this was something that I had been taught in religion classes would happen sooner or later anyway.

In the Korean War, Soviet pilots apparently did fly North Korean jets. And during Vietnam, Russia and China openly armed the North Vietnamese. Similarly, after the Russian invasion of Afghanistan in 1979, the US openly aided the Taliban. None of those acts on either side were consistent with neutrality, but were accepted as better than open conflict between the superpowers. 

This is a little different, both in location and magnitude. Ukraine is not just adjacent to Russia, but was formerly part of the USSR itself. The closest Cold War analogy is Cuba. There was the matter of the Bay of Pigs, but after that the US accepted that Cuba was allied with the USSR - so long as the USSR did not equip Cuba with any offensive weapons, and as those of us alive at the time well recall, nuclear weapons in particular.

As to magnitude, Putin was clearly told there would be severe sanctions, but obviously he had concluded, based on his experience as to Chechnya and Crimea, that they would be manageable. Instead, the entire West, including all of Europe both via the EU and NATO, as well as the US, Canada, and Japan as well, have essentially declared economic war on Russia. Whether or not Russia ultimately succeeds in militarily conquering Ukraine, Russia’s complete freeze-out from the Western economic and financial system is going to remain.

It is all well and good to argue what Putin “rationally” ought to do or not do, but as I always remind people, that didn’t exactly work out with Kaiser Wilhelm II 100 years ago. Let us hope that cool heads prevail.

As I write this, the 10 year Treasury bond is trading at roughly 1.89%. This is about 0.10% below where it was trading most of last week. It is the beneficiary of what traders call a “flight to safety,” i.e., pulling back from more risky assets to ride out the storm in a more plain, but stable, investment. This is about in the middle of its range over the past five years:


No particular sign of stress there. 

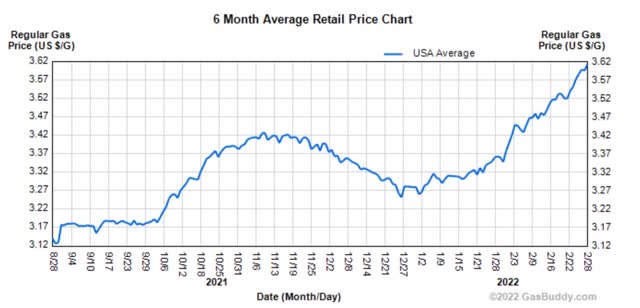
Meanwhile gas prices have risen to $3.62/gallon, according to gas buddy, continuing their rise from $3.25 just two months ago. This will inflict some further stress on consumers, but it is hardly the makings of a crisis:


Finally, as I commented in my weekly article at Seeking Alpha, while the 10 year minus 2 year Treasury spread is down to 0.42%, not only is that not a yield curve inversion, it isn’t even particularly tight looked at from a longer term perspective. Below is the 10 minus 2 year spread (blue), minus -0.42% so that the current spread shows as 0, and the 10 year minus 3 months spread (red), currently 1.64%, normed to 0 as well:


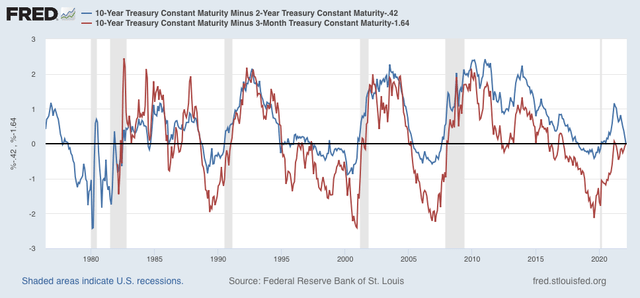
Similar spreads occurred anywhere from 2 to 7 years before the next recession over the past 40+ years.

So, at least economically speaking, the current international political crisis is not showing signs of spilling over into any kind of economic crisis in the West.