Saturday, June 18, 2022

Weekly Indicators for June 13 - 17 at Seeking Alpha


 - by New Deal democrat

My Weekly Indicators post is up at Seeking Alpha.

My paradigm is: first the long leading indicators turn. Then the short leading indicators turn. Then the coincident indicators turn. Finally the lagging indicators turn.

For months I have been documenting the downturn among the long leading indicators. In the past few weeks, that deterioration has been gradually spreading among the short leading indicators.

As usual, clicking over and reading will bring you up to the virtual moment as tho the state of the economy, and will bring me a small reward for my efforts as well.

Friday, June 17, 2022

Positive production print points to continued economic expansion in May


 - by New Deal democrat

The usual suspects are out, claiming that a recession has either already started or is imminent. Well, the big reason I call industrial production the King of Coincident Indicators is because empirically is the one whose peaks and troughs coincide most definitively with NBER recession dates. And unless there is a significant downward revision, in May the King of Coincident Indicators proclaimed: no recession yet.

Total production rose 0.2%, while manufacturing declined -0.1%. April’s overall number was also revised higher, from 1.1% to 1.4%, while manufacturing remained at +0.8%. The former made yet another new record high:


On a YoY basis, total production is up 5.8%, while manufacturing is up 4.9%. Compared with the last 40 years, and particularly the last 20, this remains pretty good growth:


A recession *could* start from these YoY numbers (see 1990 and 2007), but usually YoY production is decelerating pretty rapidly before a recession actually begins.

A close-up of the monthly changes since the depth of the pandemic recession shows that May was weak, like much other data for the month, but not indicative of any significant trend change yet:


With an employment gain of nearly 400,000, and (again, unless revised lower next month) a positive print on production, overall the economy continued to move forward in May.

Thursday, June 16, 2022

An across the board downturn for housing permits and starts in May


 - by New Deal democrat

Housing permits and starts declined across the board in May.

In the past year there has been a unique divergence between permits and starts due to construction supply shortages.  This has been reflected in the number of housing units authorized but not started increasing to a near-50 year records of 298.4 in March. In May that number increased from April by 1.5 million annualized to 287.6:


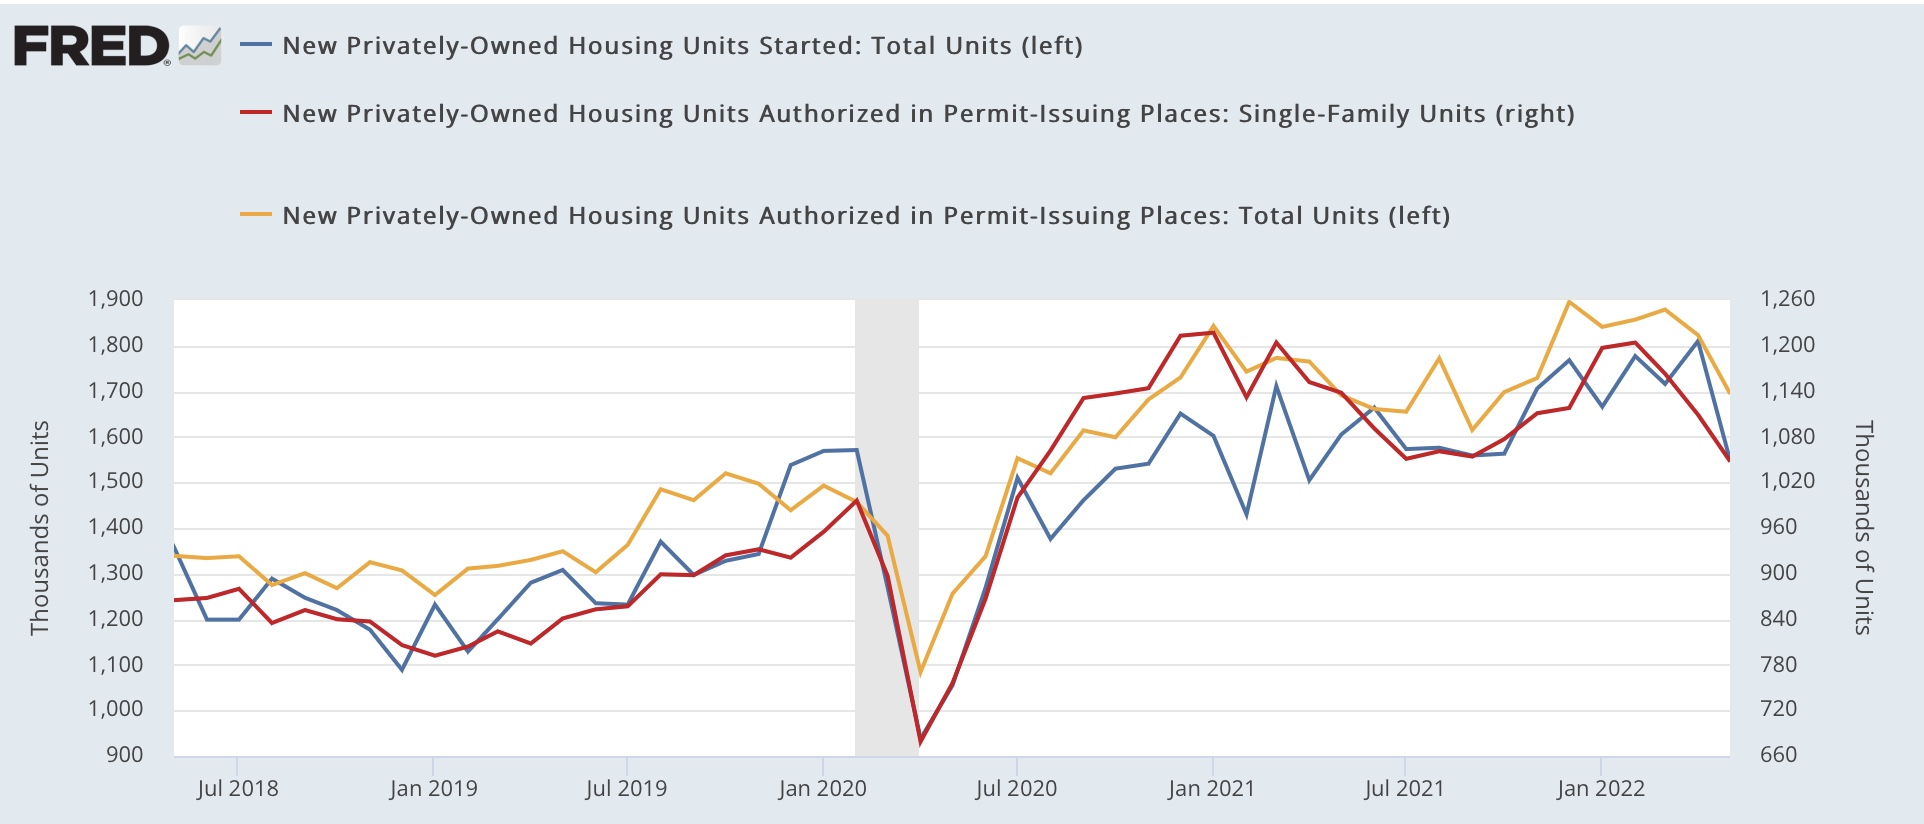
As a result, for the time being I am paying the most attention to the three month average of housing starts (blue in the graph below), as these reflect actual economic activity, vs. permits (gold) which are only potential activity. That three month average declined to 1.691 annualized, a 5 month low:


For the month, single family permits (red above, right scale) declined 61,000 annualized to 1.048 million, a 22 month low. Total permits declined 128,000 to 1.695 million annualized, an 8 month low, and starts declined for the month by 261,000 to 1.549 annualized, a 13 month low.

Finally, below is the most recent version of a graph I have run many times in the past 10 years, showing that mortgage interest rates (red, inverted *10 for scale) lead housing permits (gold) and starts (blue):


Interest rates are higher by 2% vs. one year ago. As the graph shows, the last time the comparison was this bad was 1994, resulting in a 20% decrease in permits and starts the following year. Both permits and starts have now turned negative YoY. 

The “demographic tailwind” that buoyed housing activity 5 and 10 years ago has dissipated, as the number of 25-35 year old first time buyers has stopped increasing. Thus I expect a 20% YoY decline in housing permits and starts to manifest over the coming 12 months. 

The conundrum is whether the 50 year high backlog in units not yet started will delay the downturn until it clears - which might take another 6 to 12 months. Since starts are the actual economic activity, until I see an unequivocal downturn there, the massive negative signal from permits, mortgage rates, and mortgage applications remains open to question.

The increasing trend in new jobless claims continues


 - by New Deal democrat

Initial jobless claims declined -3,000 to 229,000 last week, vs. the 50+ year low of 166,000 set in March. The 4 week average also rose 2,750 to 218,500, compared with the all-time low of 170,500 ten weeks ago.  Continuing claims rose 3,000 to 1,312,000, or 6,000 above their 50 year low of 2 weeks ago:


It’s now clear that initial claims have been in an uptrend over the past 2.5 months. If this continues until the end of this month, they will no longer qualify as a “positive” in my array of short leading indicators, although they have not risen to levels that would change their rating to a negative.

This is yet more slight weakening in the economic indicators, and yet more reason for concern about a recession as we get to 2023.

Wednesday, June 15, 2022

Negative May and YoY real retail sales add to the foreboding signals of a recession next year


 - by New Deal democrat

Nominal retail sales for the month of May declined -0.3%, and April was revised down by -0.2% to +0.7%. This reduces April’s number, after inflation to +0.4%, followed by a “real” decline in May of -1.2% after rounding. YoY real retail sales were up 8.1%, but because inflation in the past 12 months has been 8.5%, real retail sales YoY is down -0.4%. Here is a graph of the absolute value of real retail sales:


In the past 75 years, a decline in real retail sales YoY has frequently - but not always - indicated a recession. Here’s what the past 30 years look like:


Needless to say, not good news. 

Next let’s turn to employment, because real retail sales are also a good short leading indicator for jobs.

As I have written many times over the past 10+ years, real retail sales YoY/2 has a good record of leading jobs YoY with a lead time of about 3 to 6 months. That’s because demand for goods and services leads for the need to hire employees to fill that demand.  The exceptions have been right after the 2001 and 2008 recessions, when it took jobs longer to catch up, as shown in the graph below, averaged quarterly through the First Quarter: 


Now here is the monthly YoY comparison for the last year through May:


II have been writing for months that I have expected the blowout job numbers of about 500,000 per month to slow down to a range of about 100,000-300,000 per month by early autumn. The last 3 months have averaged 400,000, which has probably been the beginning of that slowdown.

Finally, real retail sales per capita is one of my long leading indicators. Here’s what it looks like for the past 25 years:


And here is the last year:


Last month’s good report temporarily switched the long leading signal from negative to neutral, but this month it goes back to negative - along with most of the rest of the long leading indicators, which have been increasingly foreboding about the economy next year.

Tuesday, June 14, 2022

On the road, and missing all the fun on Wall Street . . .


 - by New Deal democrat

I’m still on the road, and there is no important economic statistic to report, but I will make a brief market comment.


YoY stocks are now down 10%. Except for the very bad 1982 and 2008 recessions, and the 2000 Nasdaq bubble and the 1987 crash (which were prolonged bear markets), that has typically been close to their YoY lows:


And with rare exception that level has only been hit about midway through a recession.

The only time buying a broad basket of stocks at this price reduction has not been amply rewarded within after 2-3 years is during the 1929-32 Great Contraction.

< Sigh > I miss the days when I could read triumphalist diaries by DOOOMers at Daily Kos, who were infallible contrary indicators, and be sure that the bottom was in. 

On the other hand, here’s a 12 month graph of Tesla, recently valued at a level equal to if not exceeding the entire rest of the auto industry:


That’s a pretty severe price reduction. Until you zoom out to the 5 year perspective:


Is there any reason for Tesla still to be selling at 10x its price only 2 years ago?

And further, is there any reason for Bitcoin to exist at all?:


On the bright side, a lot of know-it-all smart mouthed 30 year olds are going to STFU.

Monday, June 13, 2022

Weekly Indicators for June 6 - 10 and a comment on COVID


 - by New Deal democrat

I’m still traveling, so light posting for a couple days more.


In fact, I neglected to post a link to my Weekly Indicators on Saturday. A bit tardy, here it is. Conditions across all time frames do not look so good, and with Friday’s poor inflation report, I expect the Fed to continue stomping on the brakes - especially since we know that the YoY change in rents and “owners’ equivalent rent,” which together make up about 1/3rd of all inflation, are likely to keep rising (since they lag house price indexes, which are still at or near their YoY high growth rates, by a year or more).

Meanwhile, there’s good news and bad news on the COVID front. For the last three weeks, cases have plateaued at roughly 105,000 per day, and deaths have varied between 275 and 340. So BA.4/5 does not seem to be creating any new “wave” at this point. Further, between April 4, the recent trough in cases, and one month ago, there were a cumulative total of about 2.150 million cases. With a one month lag, deaths totaled 12,300. That’s about a 0.6% fatality rate, or about 1 in 400 cases. So the good news is, over the population as a whole, COVID has recently had about a similar death rate to a bad year for seasonal flu.

The bad news is that the death rate is heavily concentrated towards the elderly. Among people under 50 years of age, in May there were only about 125 deaths total. For age 50-65, there were another 400; for 65-74, 700; for 75-84, 1000, and 85 and older, 1500. In other words, for seniors, and particularly those over age 80, COVID remains a deadly serious disease.