Saturday, October 16, 2021

Weekly Indicators for October 11 - 15 at Seeking Alpha


 - by New Deal democrat


My Weekly Indicators post is up at Seeking Alpha.

There are a couple of signs that the inflationary surge may be at or just past its peak, mainly in that the costs for ship transportation, which have been soaring for months, have stopped doing so and in one case have reversed. Meanwhile on the production side, some commodity costs are still increasing sharply.

As usual, clicking over and reading will bring you up to the virtual moment as to the economic picture. It will also reward me a little bit for my efforts.

Friday, October 15, 2021

Another strong month for real retail sales growth; to cope, employers are going to have to sweeten the pot to add employees


 - by New Deal democrat

Real retail sales, perhaps my favorite monthly economic indicator since they tell us so much about average consumer behavior, and are also a good short leading indicator for jobs, were reported this morning for September, and they were positive.

Nominally retail sales increased +0.7%, after a +0.2% upward revision to +0.9% for August.  After taking into account +0.4% inflation, real retail sales increased +0.3%. Although real retail sales are down -3.2% from their April peak, they are +12.3% higher than they were just before the pandemic hit:


They are also 8.1% higher YoY, and 3.8% higher just since January, as will be discussed further below.

Last month I wrote that ”while the recent decline from April is consistent with a slowing economy ahead, if sales stabilize here I don’t see this as a harbinger of an actual downturn.” That still looks correct. To show why, let me overlay industrial production (gold, right scale) with real retail sales in the graph below:


Industrial production is only 0.3% higher than it was in February 2020 just before the pandemic. In other words, manufacturers have not ramped up production equivalent to the increase in sales at all. The only time the economy gets in real trouble is when production has substantially outpaced sales (as at the end of the 1990s and mid-2000s, not coincidentally shortly before recessions began). Production and imports are still trying to catch up to this very strong increase in consumer sales, which is why we have such huge bottlenecks at all of our ports and rail and truck shipping as well. As noted above, real retail sales are over 8% higher YoY. How extreme is that? Well, here’s a graph that subtracts 8% YoY growth from retail sales from 1948 through 2019:


With the exception of 2 months during the 1990s, real retail sales haven’t been this strong YoY since 1984. The modern global supply chain simply can’t cope with that huge an increase to new all-time levels.

Now let’s turn to employment. As I have written many times over the past 10+ years, real retail sales YoY/2 has a good record of leading jobs YoY with a lead time of about 3 to 6 months. That’s because demand for goods and services leads for the need to hire employees to fill that demand.  The exceptions have been right after the 2001 and 2008 recessions, when it took jobs longer to catch up, as shown in the graph below, which takes us up to February 2020:


Now here is the same graph since just before the onset of the pandemic. Note the scale is much larger, given the huge changes wrought by the early lockdowns, and of course the comparative spikes from the data one year later:


As with the recoveries immediately after the two prior recessions, up until the past several months YoY job creation has been well below YoY real retail sales growth. But for the last 3 months, jobs have caught up to forecast trend.

Although the most recent jobs report was, relatively speaking, disappointing, this still  argues that we can expect jobs reports in the next few months to average out about even with those from one year ago, which averaged about 500,000 per month. Before I go, let me supply one more graph from my former co-blogger Invictus:


Job switchers have seen explosive growth in their wages in the past few months. To cope with labor’s new-found great strength, employers are going to have to engage in lots of wage and life-style sweeteners to maintain the 500,000/month jobs growth they need.

Thursday, October 14, 2021

Jobless claims: a renewed downward trend?


 - by New Deal democrat

Jobless claims declined 36,000 this week to 293,000, another pandemic low. The 4 week average also declined 10,500 to 334,500, also another pandemic low:


With the exception of the last few years of the last expansion, this level of weekly initial claims would be very low for any point in the last 50 years, and the 4 week average would be average for an expansion:


Continuing claims declined 134,000 to 2,593,000, also a new pandemic low:


This level would also be normal for the middle of the last few expansions:


Finally, here is the YoY% change of continuing claims:


Based on the YoY change, it appears that the ending of all of the emergency pandemic assistance programs by some States in June had very little effect, but the complete nationwide phase-out last month may be a cause for the decline in continued claims in the last few weeks. 

Whether this week is just a bit of a downside outlier, or the actual beginning of a renewed downward trend in claims remains to be seen. But it certainly adds to the evidence that employees have little fear of layoffs at present.


Wednesday, October 13, 2021

Continuing accelerated consumer inflation points to sharp slowdown, but no recession imminent


 - by New Deal democrat

Inflation, along with the expiration of the emergency pandemic payments, is one of the two big threats to this expansion. This morning’s report on consumer inflation for September, at 0.4%, was certainly elevated compared with its typical pre-pandemic reading of 0.2%/month, but on the other hand was the third month in a row of sharp deceleration from springtime, during which inflation averaged 0.8%/month. 

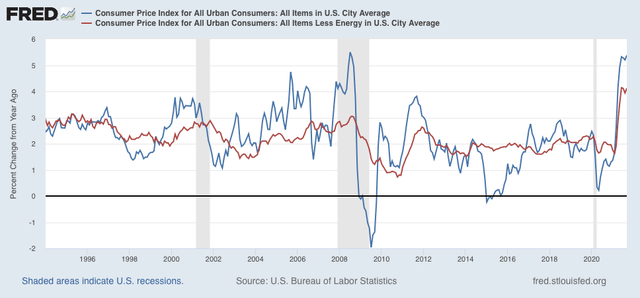
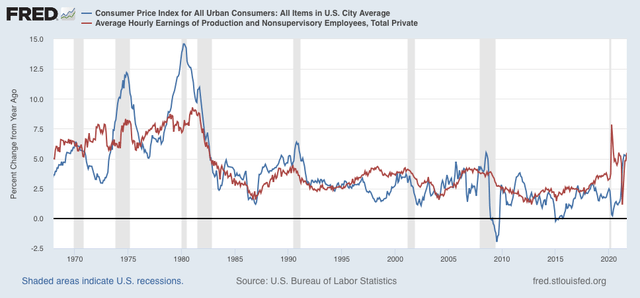
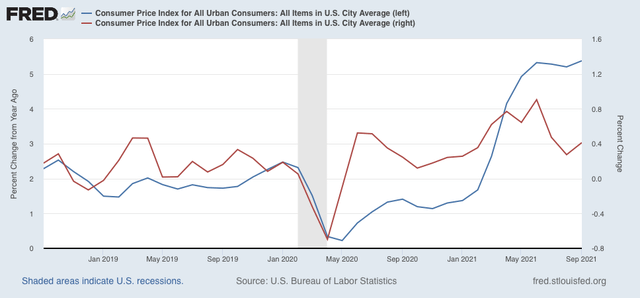
Typically inflation has not been a concern unless inflation ex-gas (red) has been in excess of 3.0%. YoY it is now 4.1%, as it has been for 2 of the 3 prior months. Meanwhile YoY total inflation (blue) is 5.4%, slightly higher than the last 3 months: 

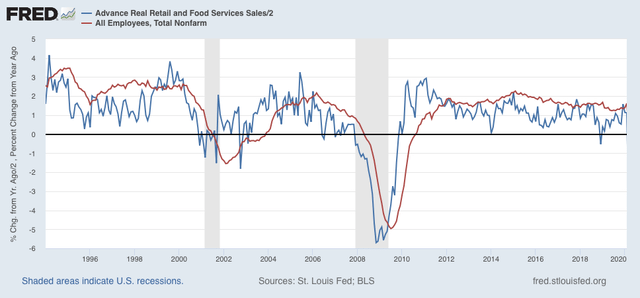
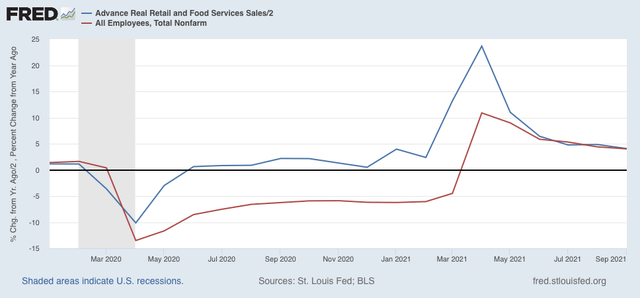
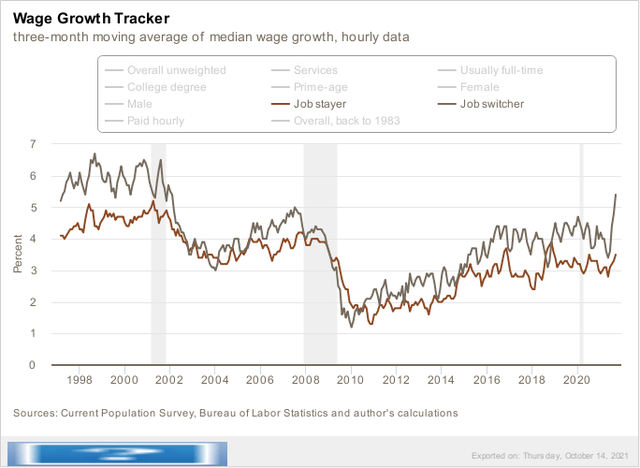
Just as importantly, one of the traditional “real” harbingers of a recession has been wages (more broadly, household income) failing to keep pace with inflation: 

Since April, on a YoY basis wages had failed to keep pace with inflation. In September, they eked out a 0.1% gain.

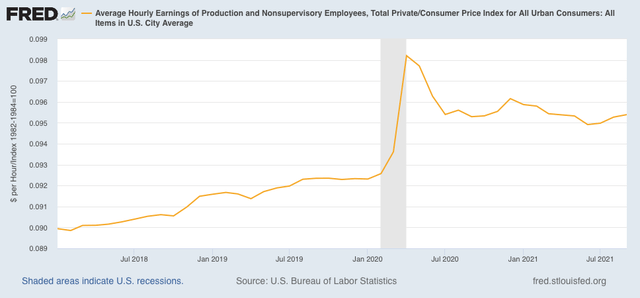
In Absolute terms real wages have been more or less flat for over a year:

This does not necessarily portend a recession, but it is certainly consistent with a sharp slowdown.

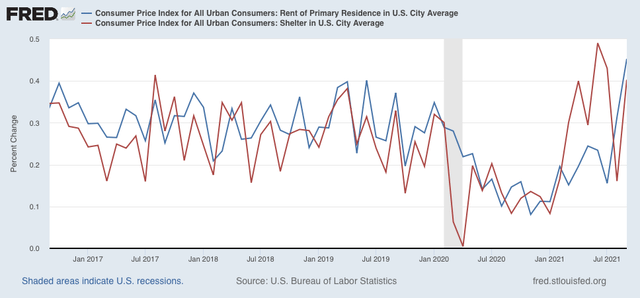
Taking a somewhat more granular look at inflation, housing (shelter) is over 1/3 of the entire index, and reflects households’ biggest monthly expense. The bad news is that on a monthly basis both inflation in shelter (blue in the graph below) and rent increases (red), which had been within their normal ranges in August, are now both running hot (particularly with the expiration of the eviction moratorium):

This has caused the YoY indexes to also turn up:

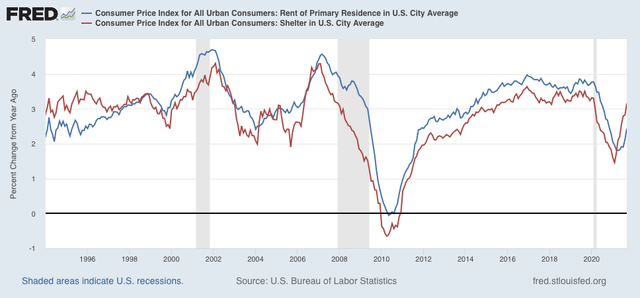
This will bleed over into the general shelter inflation index, which has already been telegraphed for many months by price increases as measured by the FHFA and Case-Shiller Indexes.

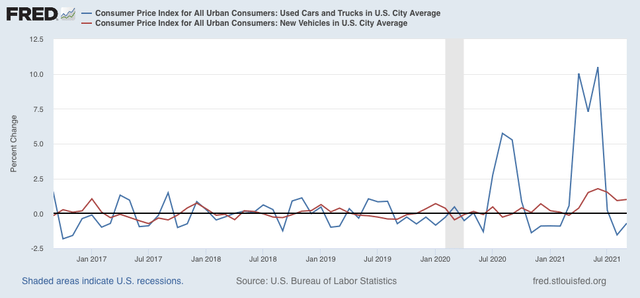
Turning to motor vehicles, new car prices (red) continued to increase at an elevated pace in September, while used car prices (blue) hit a wall in July and have decreased for two month is a row since then:

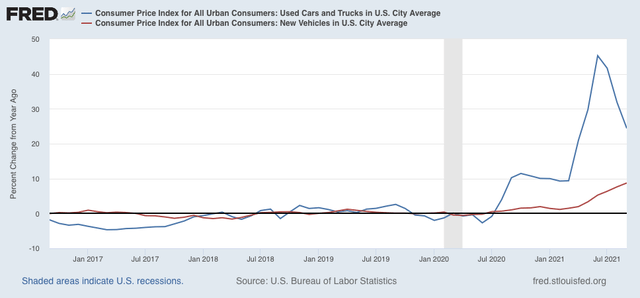
On a YoY basis, used car prices, which had been up over 40%, are now up “only” 24%, while new car prices are now up nearly 10%:

Finally, although I won’t bother with a graph, there have been renewed gas price pressures in the past several weeks, with prices up about $.10/gallon in that time.

What is the conclusion from all of this? 

First of all, price pressures in these very important sectors of the consumer economy - housing, vehicles, and gas - are constraints going forward into 2022. As I wrote in connection with last month’s report, heightened inflation has gone on long enough now that I expect some damage to show up in consumer spending. It hasn’t yet, probably because in the aggregate personal savings is up over 20% since just before the pandemic began. That’s quite a cushion! Additionally, “real” wage earnings have generally kept pace with inflation, as opposed to declining, so that suggests that consumers can maintain at least a steady level of “real” spending - and it is spending that drives production and jobs.

Secondly, there has been a real deceleration in inflation between the second quarter, during which consumer prices increased at an 8.4% annualized pace (red, monthly right scale vs. YoY, blue, left scale), and the third quarter, during which they increased at a 6.6% annualized pace:

 I expect inflation in both wages and consumer prices to decelerate further from here, with a very important caveat that inflation in rents is a wild card. 

To me this adds up to a sharp slowdown in the economy, but not enough evidence at this point - certainly not in the long or short leading indicators - to suggest a recession in the immediate future.

Tuesday, October 12, 2021

August JOLTS report: progress towards a new jobs equilibrium?


 - by New Deal democrat

This morning’s JOLTS report covers August, which you may recall featured a disappointing jobs report (since revised somewhat higher ), during which the Delta wave was growing to its worst levels, and two months after a number of GOP-controlled States terminated enhanced unemployment benefits, on the theory that they were excessive and were coddling idle workers. Despite this, last month we did not see a big drop in unfilled job openings. This month we did - but we saw a big decline in actual hires, too.

Job openings decreased 659,000 to 10.349 million (blue in the graph below), while actual hiring  (red) also decreased 439,000 to 6.322 million:

Here are the month over month percentage changes for each of those metrics:


Meanwhile, voluntary quits rose to a new record of 4.270 million:


The record number of people voluntarily quitting their jobs (meaning they are not eligible for unemployment benefits) is testimony to the record robustness of the jobs market despite the cutoff of emergency benefits by many States.

Layoffs and discharges (violet, right scale) declined by 322,000 to 1.343 million to yet another record low, while total separations (light blue, left scale) rose by 211,000 to 6.003 million, a level that was typical during the last two expansions:


Last month I wrote that “this is a market that continues to be out of equilibrium and is searching for a new one.” This month is evidence of some progress in that direction, given the decline in job openings. The record number of quits and the record low in layoffs and discharges indicates, however, that the market remains very tight and tilted in favor of labor over management (for the first time in over 20 years). But the sizable decline in actual hires belies the idea that, with a cutoff in benefits, employers will be hiring a new batch of needy potential workers.

In other words, the termination of benefits has apparently not been effective at all in actually generating new employment. The inability to find child care, or concerns about the safety of jobs on offer, and possibly the amount of previous emergency benefits that have been saved and are providing a cushion, remain likely factors.

A great deal continues to depend on the course of the Delta wave, which has not receded significantly at all along the northern (colder) frontier of States. I do not believe that a new equilibrium in the jobs market will be reached until the COVID pandemic recedes at least into a tolerable background status.