Friday, August 2, 2024

July jobs report: Estblishment survey weak (but still positive), Household survey (even more) recessionary


 - by New Deal democrat


In the past few months, my focus has been on whether jobs gains are most consistent with a “soft landing,” i.e., no further deterioration, or whether deceleration is ongoing. In the last several months I have also pointed out that the Household Survey is probably understating growth because of its large undercount of recent immigrants joining the labor force.


This month the summary is easy: the Establishment report was weak (but still positive); the Household report was recessionary.

Below is my in depth synopsis.


HEADLINES:
  • 114,000 jobs added. Private sector jobs increased 97,000. Government jobs increased by 17,000. 
  • May was revised downward by -2,000, and June was revised downward by -27,000, for a net decline of -29,000. This continues the pattern from nearly every month in the past 18 months of a steady drumbeat of downward net revisions.
  • The alternate, and more volatile measure in the household report, showed an increase of 67,000 jobs. On a YoY basis, in this series only 57,000 jobs, which round to 0.0%, or no gain at all.  With the sole exception of 1952 and one month in 1957, this has always and only occurred shortly before or during recessions.
  • The U3 unemployment rate rose 0.2% to 4.3%, triggering the “Sahm rule” recession indicator.
  • The U6 underemployment rate rose 0.5% to 8.2%, 1.4% above its low of December 2022.
  • Further out on the spectrum, those who are not in the labor force but want a job now rose 362,000 to 5.600 million, vs. its post-pandemic low of 4.925 million in early 2023.

Leading employment indicators of a slowdown or recession

These are leading sectors for the economy overall, and help us gauge how much the post-pandemic employment boom is shading towards a downturn. Outside of construction, all of the rest were flat or negative.
  • the average manufacturing workweek, one of the 10 components of the Index of Leading Indicators, declined -0.2 hours to 39.9 hours, and is down -0.6 hours from its February 2022 peak of 41.5 hours.
  • Manufacturing jobs rose 1,000.
  • Within that sector, motor vehicle manufacturing jobs declined -1,300. 
  • Truck driving declilned -2,400.
  • Construction jobs increased 25,000.
  • Residential construction jobs, which are even more leading, rose by 1,700 to another new post-pandemic high.
  • Goods producing jobs as a whole rose 25,000 to another new expansion high. These should decline before any recession occurs.
  • Temporary jobs, which have generally been declining late 2022, fell by another -8,700, and are down about -500,000 since their peak in March 2022. This appears to be not just cyclical, but a secular change in trend.
  • the number of people unemployed for 5 weeks or fewer rose 223,000 to 2,351,000.

Wages of non-managerial workers
  • Average Hourly Earnings for Production and Nonsupervisory Personnel increased $.09, or +0.3%, to $30.14, for a YoY gain of +3.8%. This continues the decelerating trend in YoY growth in wages since their post pandemic peak of 7.0% in March 2022. Keep in mind that this is still significantly higher than the 3.0% YoY inflation rate as of last month.

Aggregate hours and wages: 
  • the index of aggregate hours worked for non-managerial workers declined -0.2%, and is up 1.2% YoY, basically in trend for the past 12+ months.
  •  the index of aggregate payrolls for non-managerial workers was unchanged, and is up 5.1% YoY. These have been slowly decelerating since the end of the pandemic lockdowns. But with the latest YoY consumer inflation reading of 3.0%, this remains powerful evidence that average working families have continued to see gains in “real” spending money.

Other significant data:
  • Professional and business employment declined -11,000. These tend to be well-paying jobs. This series had generally been declining since May 2023, but earlier this year had resumed increasing again. As of this month, they are only higher YoY by 0.6% - a very low increase that has *only* happened in the past 80+ years immediately before, during, or after recessions.
  • The employment population ratio declined -0.1% to 60.0%, vs. 61.1% in February 2020.
  • The Labor Force Participation Rate increased +0.1% to 62.7%, vs. 63.4% in February 2020. The prime 25-54 age  participation rate rose sharply to 84.0%, the highest rate during the entire history of this series except for the late 1990s tech boom.


SUMMARY

This month was the smallest gain in employment since the pandemic except for this past April. The unemployment rate was the highest since October 2021. Once again, however, there was some divergence between the two surveys, with the Household survey being decisively weaker.

I nevertheless still recommend taking the recession cries that you will read elsewhere in the next few days with lots of grains of salt. I note in particular the very large increase in the prime age labor force participation rate - which itself is probably an underestimate, due to the impact of the post-pandemic immigration surge, which has not been incorporated into the underlying labor force participation level, which has been flat. As indicated above, the YoY stall in the Household number is also recessionary. Within the Establishment survey, the stall in professional and business jobs was also recessionary.

But the main Establishment report, while undeniably weak, was still positive, with significant gains in construction, a small gain in manufacturing, and an aggregate decent gain in goods production. Additionally, aggregate nonsupervisory payrolls are likely still growing in real terms, which means most households have more money to spend in real terms. While some of the leading aspects of this survey data (like manufacturing hours) were negative, I don’t think we have any serious pre-recession signal unless and until goods-producing jobs roll over.

Thursday, August 1, 2024

Jobless claims increase; no longer positive but neutral (and likely still affected by unresolved seasonality)


 - by New Deal democrat


I’m still on the road, so this will be an abbreviated report.


Initial claims rose 14,000 to 249,000, the highest since last August. The four week moving average rose 2,500 to 238,000, the highest since last September. Continuing claims, with the usual one week lag, rose 33,000 to 1.877 million, the highest since January 2022:


Last August claims also rose sharply from their brief downturn in July, so I continue to suspect there is residual seasonality here.

At the same time, all three metrics are now higher YoY, the one week claims number higher by 3.8%, the four week average by 1.9%, and continuing claims by 5.7%:


This is not recessionary, but it is no longer positive. Jobless claims are now neutral, and if they trend higher for a few more weeks may warrant a yellow caution flag. Which also means that the unemployment rate is likely to rise further in the next few months, if not necessarily tomorrow.

Wednesday, July 31, 2024

June JOLTS report: deceleration all around (including the bad stuff)


 - by New Deal democrat


The theme of the JOLTS report for June was “continued deceleration,” but no particular cause for concern. As we’ll see below, that’s because the “bad” metrics declined just as must as the “good” ones did. 

To start with, job openings (blue in the graph below), a soft statistic that is polluted by imaginary, permanent, and trolling listings, declined -46,000, or -0.6% from an upwardly revised May reading  to 8.184 million (vs. a pre-pandemic peak of 7.594 million). Actual hires (red) declined -314,000, or -5.6% to a new post-pandemic low of 5.341 million (vs. a pre-pandemic peak of 6.0 million). Voluntary quits (gold) declined -121,000, or -3.6% from downwardly revised near-post 2020 lows in April 3.282 million, the lowest rate in three years. The last two, as you can see In the below graph below, are sharp declines. Note all values are normed to a level of 100 as of just before the pandemic:


Hires are now down -10.9% from their level just before the pandemic, and quits are down -5.2%.

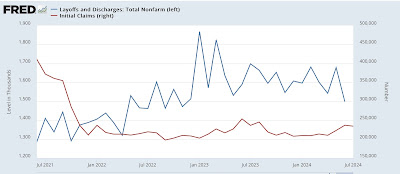
But the reason this month’s air-pocket isn’t particularly concerning is that the exact same thing happened with layoffs and discharges (blue in the graph below), which declined -180,000, or -10.7% (!) to 1.654 million, their lowest level since late 2022, and roughly 25% below their typical level in the 10 years before the pandemic:


The more leading weekly initial jobless claims (red), which have increased signficantly in the past several months, suggest that layoffs and discharges may increase as well, although the former have probably been affected by unresolved seasonality, so take this with an extra grain of salt.

Finally, the quits rate for June was unchanged from a -0.1% downwardly revised May at 2.1%, again a post-pandemic low. As I have noted for a number of months now, the quits rate (blue in the graph below) tends to lead average hourly earnings (red, right scale), this suggests that the deceleration in nominal wage growth may continue also slowly:


My big concern over the past year has been if a further deceleration in wage growth were to coincide with an upturn in inflation, because that would likely cause a decline in real consumer income and spending. If both are abating, then the net impact remains a positive for the economy.

Tuesday, July 30, 2024

Repeat home sales were benign in May, forecast continued downtrend in shelter CPI in months ahead


 - by New Deal democrat


First, a brief administrative note: I am traveling this week, so posting is going to be sporadic and delayed. I’ll get to this morning’s JOLTS report later today or tomorrow morning.


With that out of the way, let’s take a look at repeat home sales prices.

To reiterate my focus, in the housing data I am looking at any movement towards rebalancing between new and existing home sales. As to existing home sales, wethis means increasing inventories and more stable or even slightly declining prices. We did see another increase in inventory last week. In the repeat sales index, I am looking for signs that price increases might be abating. 

And that is what was shown this morning. The monthly comparisons were unchanged in the slightly leading FHFA index, and comparable to the last 6 months in the Case Shiller national index. Since the YoY comparisons are against 0.6% and 0.7% increases monthly last year, the YoY% increases also show deceleration.

The unchanged reading in the FHFA (purple below) is tied with January and March for the lowest change since August 2022. For Case Shiller (blue) it is near the low end of recent monthly changes, and the last 6 months in general have been the lowest since February 2023:


On a YoY basis, the FHFA index is up 5.7%, the lowest since last August. The Case Shiller’s YoY increase is the lowest since last December:


Again, the FHFA tends to lead the Case Shiller index by a month or two, so the direction is good.

Becase the house price indexes lead the shelter component of the CPI (red above) by 12-18 months, this means we can expect continued deceleration in that very important component of consumer prices as well.

This means that Owners Equivalent Rent, which is 25% of the entire CPI, should continue to trend towards 3% YoY increases in the months ahead.

This is a good report which should give the Fed more reason to be comfortable beginning to cut interest rates.

Sunday, July 28, 2024

Weekly Indicators for July 22 - 26 at Seeking Alpha


 - by New Deal democrat


My “Weekly Indicators” post is up at Seeking Alpha.

The high frequency data, like the personal income and spending report, continue to show a strong consumer. Some of the long term negatives have also gotten “less bad” as well.

As usual, clicking over and reading will bring you up to the virtual moment as to the data, and reward me a little bit for organizing it all for you.