Saturday, August 24, 2024

Weekly Indicators for August 19 - 23 at Seeking Alpha


 - by New Deal democrat


My “Weekly Indicators” post is up at Seeking Alpha.

This week, for the first time in several years, the number of long leading indicators improved just enough for me to move the rating from “negative” to “neutral.” And the short leading indicators are lopsidedly very positive.

As usual, clicking over and reading will bring you up to the virtual moment on the economic data, and reward me a little bit for categorizing and organizing it for you.


Friday, August 23, 2024

New and existing home sales for July: the rebalancing is underway


 - by New Deal democrat


I figured this month I would report on new and existing home sales at the same time, since they have been reported only one day apart, and I have been looking for a rebalancing of the market between the two, which means *relatively* more existing vs. new home sales, firming in new home vs. existing home prices, and more inventory growth in existing homes vs. new homes. 

To cut to the chase, it looks like that rebalancing is beginning to happen. With that in mind, let’s check the data.

Let me start by reiterating the big picture: mortgage rates lead sales, which in turn lead prices. Further, new home sales are the most leading of all housing metrics, but they are noisy and heavily revised. The much less noisy single family permits lag them slightly.

Mortgage rates declined to near 12 month lows in July (gold in the graph below), and unsurprisingly, new home sales (blue) increased. In fact they increased to the highest level in 2.5 years with the exception of one month. If this holds up after revisions, it bodes well for an increase in single family permits (red), which are much less noisy, but typically slightly lag sales, in the next few months as well:


Meanwhile prices (brown in the graph below), which are not seasonally adjusted, increased 3.1% m/m, but more importantly declined -1.4% YoY. Prices of new homes have been well behaved recently, being down YoY in all but 3 of the last 15 months (vs. sales, blue, YoY):


And inventory has very likely peaked, as it has been generally flat for the past half a year, and was down 1% in July:


In short, for new home sales, lower mortgage rates have worked their typical magic, increasing sales and putting a lid on inventory, while prices have slowly moderating from their extreme levels of several years ago.

Turning to existing home sales, which are about 90% of the total market, yesterday they too increased slightly, and remain within the range they have been in for the past 18 months. Lower mortgage rates will likely cause further increases in this metric in the next month or two:


Prices here have also moderated, relatively speaking. They were higher YoY by 4.2%, but down from their peak of 5.4% in April. Here’s what their non-seasonally adjusted trajectory looks like for the past five years:


Meanwhile, inventory has made substantial progress towards normalization in the last several months, as shown in this graph cribbed from WolfStreet:


Last month II summed up new home sales by writing that “I expect existing home inventory to continue to rise sharply until prices stop rising faster than prices for new homes. Meanwhile sales for both will continue their existing flat to slowly decreasing trend until mortgage rates are significantly lower.”

And for existing home sales I wrote, “What we are looking for is rebalancing in the housing market. For that to happen, we want the inventory of existing homes to increase, prices to stabilize, and sales to gradually pick up.”

In July, with lower mortgage rates, the trend in new home sales broke, and existing home sales will likely shortly follow. Inventory of existing homes has indeed continued to rise significantly, especially in comparison to flat to slightly declining inventory of new homes. Price increases in existing homes have moderated somewhat, but need to go much further before the normal balance with new home sales is restored. 

We still have a long way to go, but the rebalancing is underway.

Thursday, August 22, 2024

As the Debby effect dissipates, initial claims remain positive for the economy


 - byNew Deal democrat


For the last several months, jobless claims have been buffeted first by unresolved post-pandemic seasonality, and then also by the effect of Hurricane Debby on claims in Texas. The first is now abating, and the second has ended, as this week claims in Texas declined to their typical level last year at this time.


To the numbers: initial claims rose 4,000 to 232,000, while the four week moving average declilned -750 to 235,000. With the typical one week delay, continuing claims rose 4,000 to 1.863 million:


The YoY% change removes the effects of unresolved seasonality, and is the best metric to use for forecasting. Measured this way, initial claims were down -3.7%, and the four week average down -4.4%. Continuing claims were up 3.7%, the fifth best reading in almost 18 months:


Thus, jobless claims remain is a positive short leading indicator for the economy, while the persistent slight increase recently in continuing claims tells us that it is slightly weaker than previously.

Here is the updated comparison with the unemployment rate:


This year has departed from the near-universal relationship of the past 60 years in which initial claims led the unemployment rate. What this tells us is that a significant portion of the people telling the BLS that they are unemployed were not previously working. They are either new entrants, or re-entrants, to the labor force, and very likely recent immigrants. In other words, the rise in the unemployment rate is not telling us that there is a recession, but rather that the wave of recent immigrants, who easily found employment during the 2021-22 Boom, are having a harder time finding a job now.

Wednesday, August 21, 2024

Preliminary benchmark revisions wipe out 30% of jobs growth in the past 16 months


 - by New Deal democrat


Every month I write about the Jobs Report. But while it is timely, it is only an estimate. There is an actual census of over 95% of all employers that also gets reported, called the QCEW, and it is the “gold standard” of actual jobs growth (or loss). Its two drawbacks are that it is not seasonally adjusted, and it is reported almost 6 months after the end of the quarter it updates.


Which is a lengthy introduction to saying that it was just reported through March of this year this morning. More importantly, the BLS preliminarily re-benchmarked all of its data beginning in March of last year.

And which is a further introduction to saying that, as expected, job growth was a lot less late last year and earlier this year than we originally thought.

To wit, according to the QCEW, job growth was only 1.3% YoY through March (sorry, no graph, just the chart):


This compares with the official payrolls data showing 1.9% YoY growth through that same period:


Note that the two are consistent through last June. It is beginning last July that there is a major divergence, with payrolls estimating 2.1% job growth and the QCEW only showing 1.7% growth.

The actual total preliminary revision to job growth over this period was -818,000. Note that the biggest hits were to manufacturing (-125,000), retail (-129,00) leisure and hospitality (-150,000), and professional and business services (-358,000 !). These four areas made up over 750,000 of the 818,000 decline:


Here’s what the “official” total jobs gain since March of last year looks like:


But instead of a nearly 3 million gain, this is going to be raised down to only about a 2 million gain - a loss of about 30% of the total official gain.

Here is what the other “official” gains look like in the 3 sectors hardest hit by the reivions:


*All but one* of these sectors will be revised to show losses. Manufacturing will be down -96,000 YoY as of this past March, retail down -45,000, and professional and business services down -202,000. Only leisure and hospitality will still show a gain, of 296,000 (vs. 446,000).

Note that this is not the “final” benchmark revision, which we’ll get at the beginning of next year. So the numbers are not going to change yet in the official payrolls report. 

The bottom line is that, while this is not recessionary, it takes the “pretty good” growth over the last 16 months, and revises it to mediocre growth.

Tuesday, August 20, 2024

How restrictive are “real” interest rates?


 - by New Deal democrat


This post is inspired by a Xtweet from Paul Krugman this morning, in which he pointed out that if we measured inflation the same way it is done in Europe, the Yoy% change would be only 1.7%. That got me wondering, since the primary difference is how shelter inflation is measured, just how restrictive is current Fed policy across a number of the most important inflation measures?


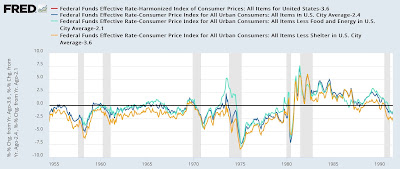
Let’s begin by reviewing what the current YoY% changes in consumer prices are using the harmonized index (red), CPI les shelter (gold), headline CPI (dark blue) and core CPI (light blue):


As I pointed out when the CPI was reported last week, ex-shelter consumer prices are only up 1.8% YoY, while headline inflation was 2.9%, and the core measure was 3.2%.

The Fed funds rate has remained at 5.33% for the past year. That means that the “real” Fed funds rate for headline inflation is 2.4%, 2.1% for core inflation, and 3.6% for both CPI less shelter and the harmonized index:


That’s certainly tight compared with the previous few years. But how does it compare historically? Below I subtract the current “real” Fed funds rate to show each metric at the 0 line, and divide into two segments better to show the historical record:


Before 1982, the current “real” Fed funds rate is higher than at any time except in the year or so before recessions, and also during the 1966 slowdown. Since the turn of the Millennium, it is also higher than at any time except for the lead-up to the Great Recession. On the other hand, the real rate was higher durning almost all of the 1980s and mid- to late-1990s.

Since the 1980s and 1990s are remembered as periods of prosperity, is that such a big deal?

Well, remember that during both of these decades interest rates, and in particular mortgage rates, were in an almost persistent rate of decline. Indeed, it is only when they stopped declining for 3 years or more that recessions occurred:


By contrast, mortgage rates have been at or close to 15 year highs for the past two years.

In other words, going back 60 years, “real” interest rates have only been this high in the year or two before recessions, except for those periods when households could free up more cast to spend by refinancing their mortgages at lower rates.

It is hard to escape the implication that if the Fed does not start lowering rates very soon, it has brought about recessionary conditions.

Monday, August 19, 2024

Real hourly wages, median income, and aggregate payrolls: update for July


 - by New Deal democrat


It’s a slow economic news week, so don’t be surprised if I play hookie tomorrow or Wednesday.


In the meantime, now that we have July’s inflation data, we can update some “real” consumer well-being indicators.

First, real average hourly wages for nonsupervisory workers rose 0.1% in July to a new all-time high excluding April through June 2020:


It has risen 3.8% since its pre-pandemic all-time high, and 3.0% from its June 2022 post-pandemic low (when gas prices were $5/gallon).

Meanwhile, Motio Research has updated their monthly calculation of real median household income through June. It is also at an all-time high excluding the months of  March through August 2020:


Note this includes pandemic stimulus payments as well as wages, which is why it surged during the early months of the pandemic.

Finally, real aggregate payrolls for nonsupervisory workers - the best measure of the collective buying power of America’s middle and working class - declined -0.1% in July from its all-time high in June:


Although, per the BLS, Hurricane Beryl did not affect the employment or unemployment numbers for July, there is some indication that it *did* impact the number of hours worked, which declined -0.2%. This decline in hours explains why aggregate payrolls declined, even though real wages per hour worked increased.

If real aggregate payrolls fail to make a new high in the next couple of months, that would be cause for some concern, since the peak in this metric is a short leading indicator for recessions.

But all in all, real income in July continued the recent run of good news.