Saturday, June 15, 2019
Weekly Indicators for June 10 - 14 at Seeking Alpha
- by New Deal democrat
My Weekly Indicators post is up at Seeking Alpha.
The divergence between the near term vs. longer term forecast is increasing, and the risk that the forecast is too optimistic is asymmetrical, because for the economy, Trump’s chaotic tariff behavior cannot improve the situation, but can definitely cause harm.
Friday, June 14, 2019
May real retail sales positive, but industrial production remains in a shallow recession
- by New Deal democrat
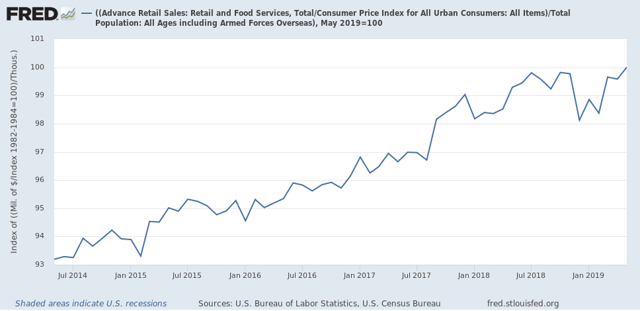
Retail sales are one of my favorite indicators, because in real terms they can tell us so much about the present, near term forecast, and longer term forecast for the economy.
This morning retail sales for May were reported up +0.5%, and April was revised upward by a net +0.5% as well. Since consumer inflation increased by +0.4% over that two month period, real retail sales have risen +0.6% in the past two months. For the past two months I have noted that sales were still slightly below their peak last November, and YoY real sales remained in a downshift. This morning’s report helps those comparisons substantially, as YoY real retail sales are now up +1.4%.
Here is what the last five years look like:
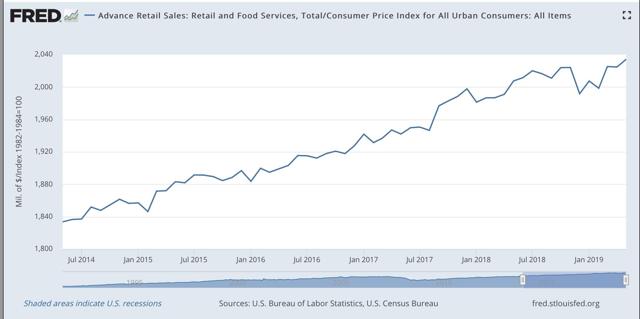
Real retail sales turned flat for about a year before both of the last two recessions. Even with this morning’s positive revisions, since late last year we’ve hit the biggest soft patch since 2013.
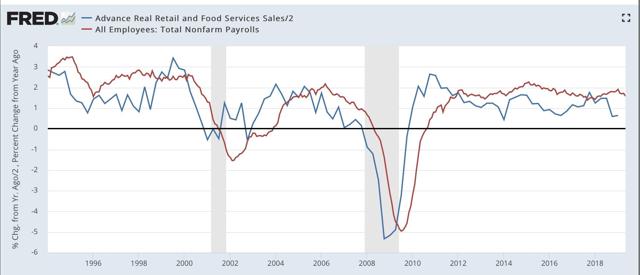
Next, although the relationship is noisy, because real retail sales measured YoY tend to lead employment (red in the graph below) by a number of months, here is that relationship for the past 25 years, measured quarterly to cut down on noise:
Now here is the monthly close-up of the last five years. You can see that it is much noisier, but helps us pick out the turning points:
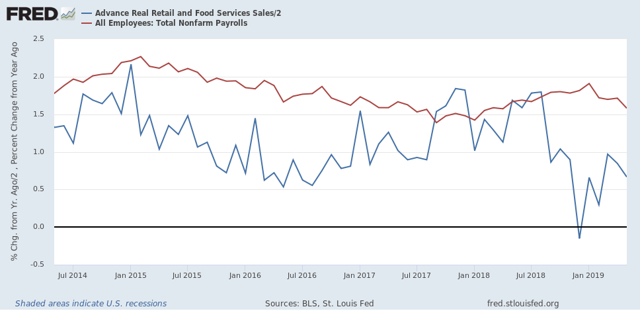
The lead times are somewhat variable, although usually within 6 to 9 months. We have had 9 months of a big downshift in YoY sales. Even with this morning’s improvements, the YoY metric is still low, and so I still expect the slowdown in employment as measured in the monthly jobs report that showed up last Friday to continue.
Finally, real retail sales per capita is a long leading indicator. In particular it has turned down a full year before either of the past two recessions:
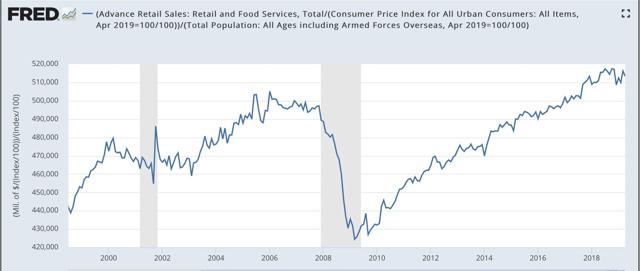
Here is the close-up of the past five years:
 The good news is, as of this morning’s report this measure made a new high, which if not revised away is evidence against a recession this year. Further, in the last 70 years, this measure has always turned negative YoY at least shortly before a recession has begun. Although there have been some false positives, there are no false negatives. But this is still up a little over +0.6% YoY, which is very much consistent with a slowdown.
To sum up, real retail sales Have resumed a weakly positive trend, that nevertheless points to a slowdown in employment gains in the months ahead.
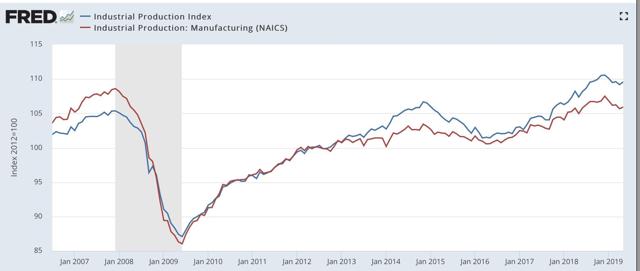
Turning to industrial production, this also improved, up +0.4% in May. The difference is, this merely took back the -0.4% decline in April. Industrial production, both in total and limited to manufacturing, is lower than it was last December:
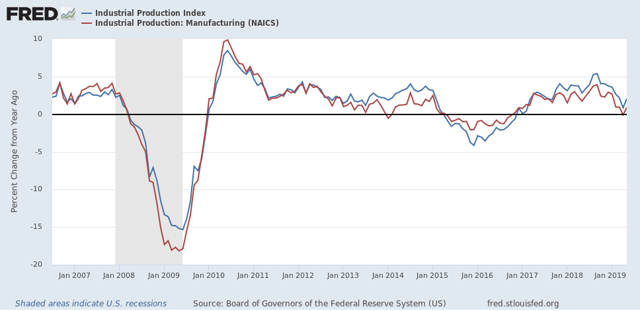
YoY industrial production is only up +2.0%, a mediocre result compared with most of this expansion:
Bottom line: the consumer part of the economy is picking up after the government shoutdown caused “mini-recession”. But the producer side is still *in* a shallow recession now. If the economic slowdown we are in is going to metastasize into a recession, it is probably going to come from the producer side and be due mainly to the effects of chaotic trade and tariff decisions from the Administration.
Turning to industrial production, this also improved, up +0.4% in May. The difference is, this merely took back the -0.4% decline in April. Industrial production, both in total and limited to manufacturing, is lower than it was last December:
YoY industrial production is only up +2.0%, a mediocre result compared with most of this expansion:
Bottom line: the consumer part of the economy is picking up after the government shoutdown caused “mini-recession”. But the producer side is still *in* a shallow recession now. If the economic slowdown we are in is going to metastasize into a recession, it is probably going to come from the producer side and be due mainly to the effects of chaotic trade and tariff decisions from the Administration.
Thursday, June 13, 2019
Initial jobless claims for week ending June 10 - no concern yet
- by New Deal democrat
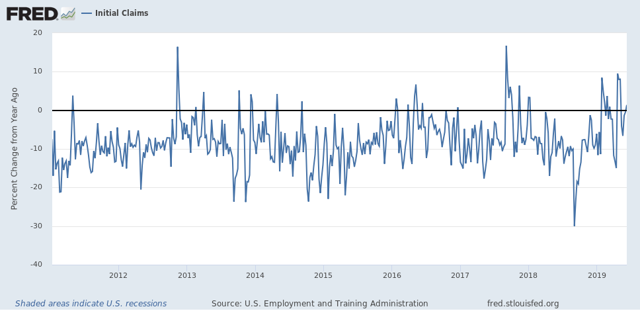
I have started to monitor initial jobless claims to see if there are any signs of stress.
My two thresholds are:
1. If the four week average on claims is more than 10% above its expansion low.
2. If the YoY% change in the monthly average turns higher.
Here’s this week’s update.
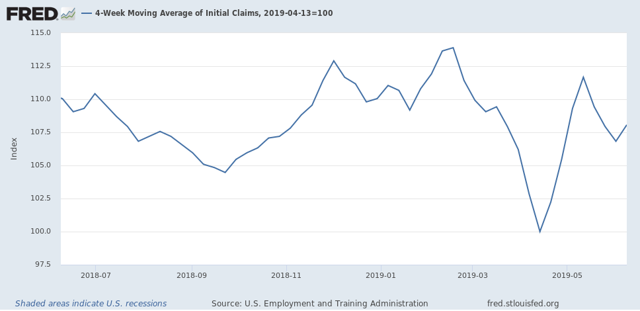
Initial claims last week were 222,000. The four week moving average was 217,750.
First, the four week average is only 8.1% above its recent low:
Second, the YoY% change for this week is only lower by -1.8%. For the first two weeks of June, it averages +0.5% higher:
Finally, last week I noted that, since initial claims tend to slightly lead the unemployment rate, I expected a slight increase in the unemployment rate in last week’s jobs report. Instead, it remained at 3.6%. Here’s the updated look at the YoY% change in the four week average (blue) compared with the YoY change in the unemployment rate (red):
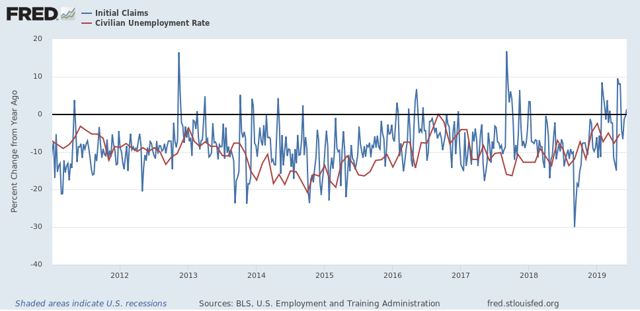
Obviously the relationship does not hold exactly for every month, but I still expect the very small YoY change in initial claims to show up in a very small (as in -0.1%) decline in the monthly unemployment rate shortly.
For now, initial claims are only signaling a little bit of weakness, but nothing to be imminently concerned about.
Wednesday, June 12, 2019
May real wages grow, but real aggregate payrolls on the verge of a red flag warning
- by New Deal democrat
The consumer price index rose +0.1% in May and declined YoY to 1.8%. Again the main reason was gas prices, which declined in during the month. Below is overall CPI (blue) vs. CPI less energy (red) for the past 20 years:
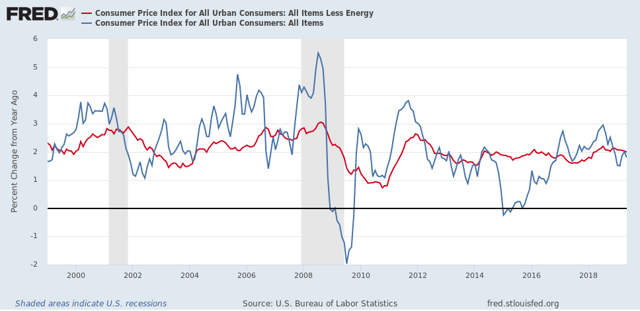
Ex-gas, consumer inflation ex-energy has been remarkably stable between 1.5% and 2.5% YoY ever since gas prices made their long term bottom in early 1999. The only significant exceptions were in the year before each of the last two recessions. In short, there is no inflation pressure on the economy.
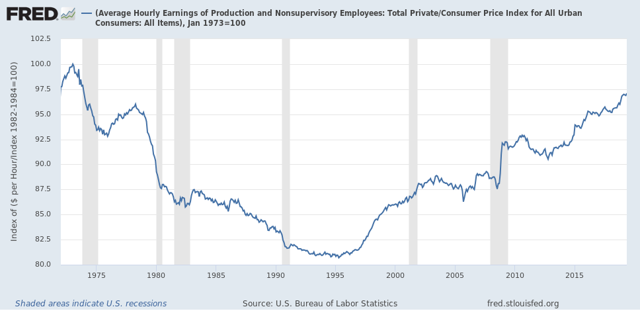
Now let’s turn to wages. Nominally, wages for non-supervisory employees increased +0.3% in May, so after inflation they were up +0.2%, an improvement over the past few months. YoY non-supervisory wages nominally were up +3.2%, which means that real wages for non-supervisory workers are up +1.6%: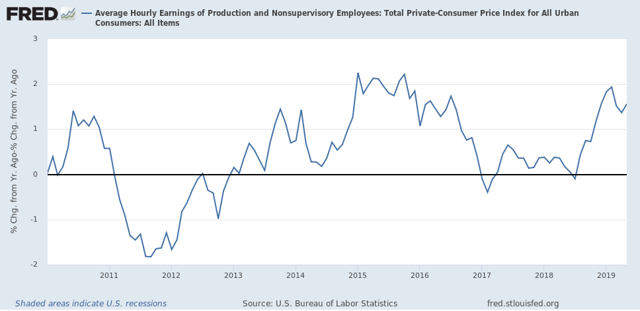
This was a new 40+ year high, but in the longest view, real wages are still -2.9% below their January 1973 peak:
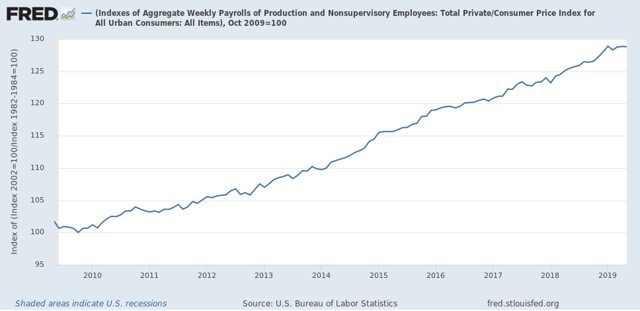
Finally, something important is going on with aggregate real wages. This tells us how much more American workers as a whole in real terms since the bottom just after the Great Recession. These are presently up 28.8% from their post-Great Recession low, but Are -0.1% below their January peak:
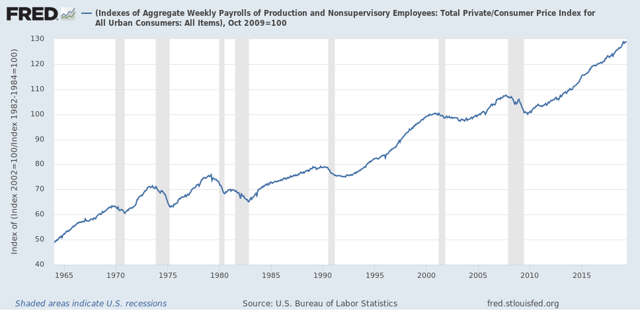
This tells us that, in the aggregate, average Americans have less to spend than they did four month previous, and in that in general this metric has stalled out this year. This is important, because as the below longer term graph shows, real aggregate income has stalled and then started to roll over in the year before almost all recessions in the past 50 years, with the peak usually happening within 6 months of the onset of the recession:
When we take the information in the above graph and chart the YoY% change, we see that real aggregate wage growth has typically decelerated by 1/2 or more from its 12 month peak just at the onset of recessions, although there have been 3 false positives coincident with slowdowns:
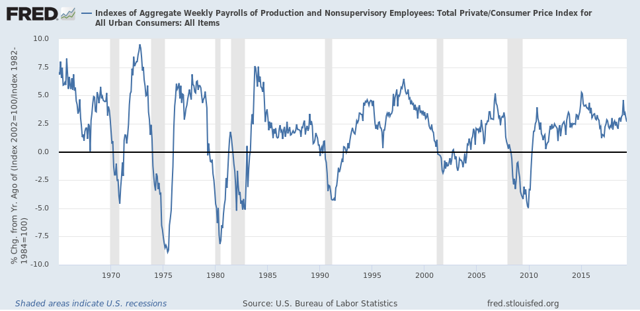
YoY real aggregate payroll growth peaked at 4.6% in January, and is down to 2.6% as of May. Another -0.3% downturn in YoY growth would trigger a red flag recession warning in this signal.
When we take the information in the above graph and chart the YoY% change, we see that real aggregate wage growth has typically decelerated by 1/2 or more from its 12 month peak just at the onset of recessions, although there have been 3 false positives coincident with slowdowns:
YoY real aggregate payroll growth peaked at 4.6% in January, and is down to 2.6% as of May. Another -0.3% downturn in YoY growth would trigger a red flag recession warning in this signal.
Tuesday, June 11, 2019
April JOLTS report: a mixed bag consistent with the strong jobs report one month ago
- by New Deal democrat
The jobs report one month ago was a blowout to the upside, so I expected the JOLTS report for April, reported yesterday with a one month lag, to follow suit. And generally it did.
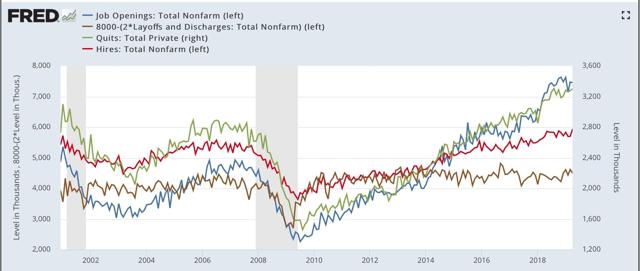
Because this series is only 20 years old, we only have one full business cycle to compare. During the 2000s expansion:
- Hires peaked first, from December 2004 through September 2005
- Quits peaked next, in September 2005
- Layoffs and Discharges peaked next, from October 2005 through September 2006
- Openings peaked last, in April 2007
In yesterday’s report:
- Hires made a new expansion high
- Quits were only 1000 off their expansion high
- Layoffs and discharges backed off from interim lows in January and March
- Openings continued to fade from their expansion high last November:
Here’s the composite graph (with layoffs and discharges inverted, since fewer is better):
And here are the YoY% changes, better to show the underlying trend (minus hires, which I’ll break out separately below:

You can see that openings are weak, and quits actually went negative, while layoffs have improved from a year ago.
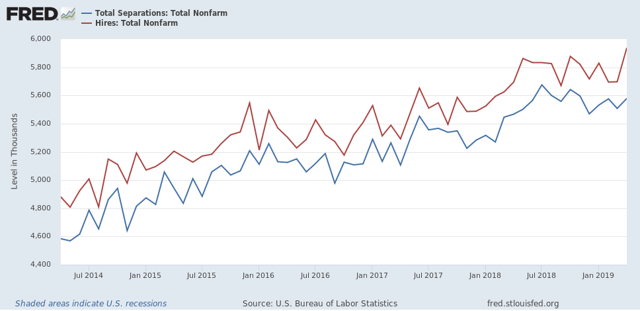
Next, here is the update of the “hiring leads firing (actually, total separations)” metric:
And here is the same data measured as a YoY% change:
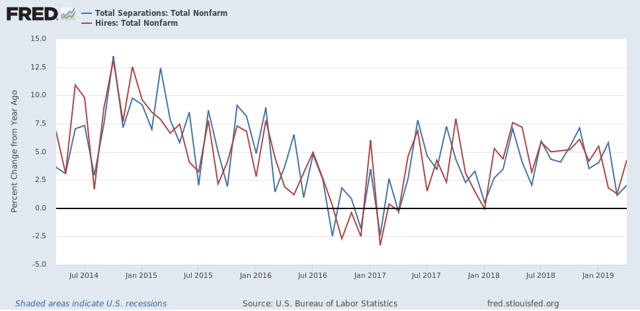
Hires bounced back strongly in April, while total separations continue to show weakness but are not negative.
To sum up, this was a strong report, on par with the strong April jobs report, with hiring and quits consistent with a strong employment picture, while other metrics showed varying degrees of weakness, but no impending doom. The report may also have been affected by residual seasonality due to the very late Easter. If so, there will be payback one month from now.
Subscribe to:
Posts (Atom)