Saturday, January 21, 2017
Weekly Indicators for January 16 - 20 at XE.com
- by New Deal democrat
My Weekly Indicators post is up at XE.com.
Consumer spending measures have really softened. Two of the three I track are almost certainly affected by online purchases vs. brick and mortar. But not Gallup's poll of consumers, which also has turned soft. It's at least a valid concern whether this is a reflection of gas prices finally affecting real wage growth enough to begin to bite.
Friday, January 20, 2017
The labor force participation rate vs. the unemployment rate
- by New Deal democrat
This is the third of four installments looking at whether and by how much people get drawn into the labor force as economic expansions progress. This is part of a broader look at how close we might be to "full employment."
In the first installment, I showed that if we norm for the long term secular trends, both men's and women's participation in the labor force does go up during economic expansions; i.e., as the economy improves, more and more people who aren't interested in working decide that they do want a job.
In the second installment, I showed that wage growth appears to have very little if any value in forecasting or even correlating with increased labor force participation. If anything, the correlation appears to run the other way: increased labor force participation correlates with lower real wages at least over the longer term, but not in any consistent way.
Now let's take a look at whether tightness in the labor market as shown by the unemployment rate correlates with an increase in labor force participation. Because the U-3 rate has a much longer history than the broader U-6 underemployment rate, that is what I am using. Note also that for purposes of scale (this will be important later) I am dividing the YoY change in the unemployment rate by 4.
Here is the YoY% change in labor force participation for men, +0.3% to norm for the secular declining trend, compared with the unemployment rate (inverted so that a decrease in the rate shows as an increase in the graph). I've split this up into three time series better to show the relationship. First, here is 1950-64:

1964-1990:

1989-present:

In the 1950s, there is no discernible correlation. But beginning in the 1960s, and all the way up until the present, there does appear to be a significant correlation between a decrease in the unemployment rate and an increase in men's participation in the labor force.
Now here is women's participation, -0.3% through the 1990s to norm for the secular trend of their entry into the labor force during that time. First, here is 1950-1965:

1965-1995:

1996-present:

With the exceptions of the late 1950s-early 1960s, and the recovery since the Great Recession, once again there does appear to be a significant correlation between a decrease in the unemployment rate and an increase in women's participation in the labor force (but note the poor relatinship in the present expansion, which will be dealt with in the last installment).
Remember that I told you to keep the division of the YoY change in the unemployment rate by 4 in mind? That's because the above graphs suggest that, although it is a very noisy relationship, a back of the envelope estimate is that for every 1% change in the unemployment rate, there is a .25% change in the labor force participation rate for both men and women.
Not only is there a significant correlation between the unemployment rate and labor force participation, but it appears from the above graphs that the unemployment rate *leads* labor force participation by 1-2 years. This is also shown when we compare the difference in the YoY change in the two:
In the first installment, I showed that if we norm for the long term secular trends, both men's and women's participation in the labor force does go up during economic expansions; i.e., as the economy improves, more and more people who aren't interested in working decide that they do want a job.
In the second installment, I showed that wage growth appears to have very little if any value in forecasting or even correlating with increased labor force participation. If anything, the correlation appears to run the other way: increased labor force participation correlates with lower real wages at least over the longer term, but not in any consistent way.
Now let's take a look at whether tightness in the labor market as shown by the unemployment rate correlates with an increase in labor force participation. Because the U-3 rate has a much longer history than the broader U-6 underemployment rate, that is what I am using. Note also that for purposes of scale (this will be important later) I am dividing the YoY change in the unemployment rate by 4.
Here is the YoY% change in labor force participation for men, +0.3% to norm for the secular declining trend, compared with the unemployment rate (inverted so that a decrease in the rate shows as an increase in the graph). I've split this up into three time series better to show the relationship. First, here is 1950-64:
1964-1990:
1989-present:
In the 1950s, there is no discernible correlation. But beginning in the 1960s, and all the way up until the present, there does appear to be a significant correlation between a decrease in the unemployment rate and an increase in men's participation in the labor force.
Now here is women's participation, -0.3% through the 1990s to norm for the secular trend of their entry into the labor force during that time. First, here is 1950-1965:
1965-1995:
1996-present:
With the exceptions of the late 1950s-early 1960s, and the recovery since the Great Recession, once again there does appear to be a significant correlation between a decrease in the unemployment rate and an increase in women's participation in the labor force (but note the poor relatinship in the present expansion, which will be dealt with in the last installment).
Remember that I told you to keep the division of the YoY change in the unemployment rate by 4 in mind? That's because the above graphs suggest that, although it is a very noisy relationship, a back of the envelope estimate is that for every 1% change in the unemployment rate, there is a .25% change in the labor force participation rate for both men and women.
Not only is there a significant correlation between the unemployment rate and labor force participation, but it appears from the above graphs that the unemployment rate *leads* labor force participation by 1-2 years. This is also shown when we compare the difference in the YoY change in the two:

Compared with trend, the LFPR outperforms later in the expansion as the unemployment rate flattens and then begins to rise, while it under performs relative to trend when the unemployment rate begins to turn down early in a recovery.
In the last few months, the unemployment rate has declined to new lows. That suggests that in the next 12-24 months, the LFPR will increase compared with trend. If the unemployment rate were to decline another 1% to 3.5%, thereafter we should expect roughly another +.25% YoY increase in the LFPR compared with trend, which translates into a very slight nominal increase.
But this relationship, while important, isn't the end of the story. Because we still have the issue of retiring Boomers, and we still have the fact that women's labor force participation barely budged for 6 years after the end of the Great Recession. A year ago I wrote a series on the "child care cost crush." So in the final installment, I will take a look at these issues.
Thursday, January 19, 2017
December housing permits report: good news
- by New Deal democrat
The December housing permits report this morning portends good news for the economy in 2017 for several reasons.
This post is up over at XE.com.
Wednesday, January 18, 2017
Gas prices push inflation above Fed target
- by New Deal democrat
Looks like we are shortly going to find out whether 2% inflation is the Fed's "target," or whether it is really a ceiling. My bet is on ceiling.
Why? Both headline and core YoY inflation are already above 2% as of this morning's December report.
My fuller discussion of the implications for 2017 is up at XE.com.
Tuesday, January 17, 2017
Real wage growth vs. labor force participation
- by New Deal democrat
This is the second of four installments looking at whether and by how much people who are out of the labor force decide to seek employment as an economic expansion continues. This is part of a broader issue of how close we are to full employment.
In the first installment, I showed that once we separate labor force participation into men and women, then we see two separate but equally stable long term trends. Men's participation has declilned at a fairly steady -0.3% YoY over the long term, while women's participation increased by about +0.5% YoY over from 1955 to the late 1990s. Once we account for that secular trend, in both cases we find that within any given business *cycle,* both men's and women's participation has increased compared with that trend as the economy improves, and deteriorates compared with the long term trend during and around recessions.
In short, as an economy improves, people are drawn off the sidelines into the labor pool.
In this installment, I'll look at whether this increase in participation correlates with real wage growth.
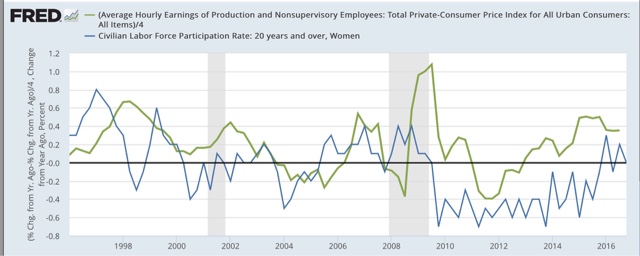
Once again, I'll separate men's and women's participation. Here is the YoY% change in men's participation, +0.3%, compare with the YoY% change in real wage growth (green) from 1955 to the present:

There is no particular correlation. In particular if anything real wage growth and participation go in opposite directions during the early 1970s, almost all of the 1980s, the mid 2000s and around the end of the Great Recession.
Here is the same graph for women, first subtracting -0.5% YoY from 1955 through the late 1990s:

and with no adjustment YoY thereafter:
Once again, it is hard to see any definitive relationship. Throughout the 1970s, and again in the later 1990s, there is almost an inverse relationship, although since about 2002 there may be some broad and noisy convergence.
If anything, over the long term there may be a slight correlation between an increase in labor force participation and decreasing real wages!

The above graph shows the overall age 25-54 participation rate for both sexes, inverted (so an increase in participation shows up as a decrease on the graph) compared with real wages. Note that the period showing the biggest jump in participation (the 1970s) showed the biggest YoY declines in real wages, while the periods with the biggest declines in participation (the several years after each of the last 3 recessions) coincide with the subsequent recoveries showing the biggest real wage gains.
So, the hypothesis that, as real wages improve, more and more people will be drawn into the labor force is tenuous at best. If anything, the relationship may be the opposite, and causation run the other way. In any event, surprisingly watching real wages does not appear to give us any insight as to what may happen with labor force participation.
In the next installment, I will look at the relationship between labor force participation and the unemployment rate.
Monday, January 16, 2017
Measuring the effect of the economy on labor force participation
- by New Deal democrat
One of the big conundrums during this expansion has been why the labor participation rate has remained so low.
As a refresher, among the entire population age 16 and over, the Census Bureau divides people into "employed," "unemployed," and "not in the labor force." Among the nearly 100 million people who are "not in the labor force" at all, every month the Census Bureau asks them if they want a job now. Consistently, month after month and year after year, over 90% of these nearly 100 million people tell the Census Bureau that they *DON'T* want a job now (due to, e.g., being in school or retirement). As of last month, those who are out of the labor force, but want a job now totaled about 5.6 million people. Even in the tech boom of the late 1990s, at least 4.4 million people fit this description:

Last week I asked "how close are we to full employment?" and answered that it looked like we were about 1.5% away.
But a broader question is, as the economy improves, are people who aren't in the labor force enticed to enter it, by better wages or an easier ability to find a job? That's what I'm looking at this week. Today I'll set the table with a brief overall look. Later this week I'll take a look separately at how much improving wages matter, and how much a lower unemployment rate matters.
Let me start by looking at two overall graphs. First, here is the labor force participation rate vs. real wages for the last 50+ years:

Second, here is the labor force participation rate (inverted) vs. the unemployment rate for the last 50+ years. The LFPR is inverted because presumably we mainly want to see if decreased unemployment is associated with an increase in particpation:

There's nothing useful here! The LFPR goes up until the mid-1990s, then sideways, then takes a dive during the "great recession." Meanwhile the unemployment rate zigzags up and down, and real wages go up, then down from 1974 to 1995, then zigzag up and down and up again.
Part of what is going on is the different long-term trends of men and women in the labor force. The participation rate for men in the labor force has been falling, more or less steadily, since the 1950s. Meanwhile women entered the workforce by the millions between the 1950s and 1990s, but their participation rate has held steady and then fallen slightly since then. A second more recent issue is the ongoing retirment of the Baby Boomers:

But the big thing to notice for my purposes is that once we separate out men and women, we see that the increasing/decreasing trend for each holds basically steady for decades. In the 60 years since 1955, men's participation has fallen by a little over 18%, or -0.3% per year on average. In the 45 years between 1955 and 2000, women's participation rotse by about 25%, or a little over +0.5% per year, before basically leveling out.
As a refresher, among the entire population age 16 and over, the Census Bureau divides people into "employed," "unemployed," and "not in the labor force." Among the nearly 100 million people who are "not in the labor force" at all, every month the Census Bureau asks them if they want a job now. Consistently, month after month and year after year, over 90% of these nearly 100 million people tell the Census Bureau that they *DON'T* want a job now (due to, e.g., being in school or retirement). As of last month, those who are out of the labor force, but want a job now totaled about 5.6 million people. Even in the tech boom of the late 1990s, at least 4.4 million people fit this description:
Last week I asked "how close are we to full employment?" and answered that it looked like we were about 1.5% away.
But a broader question is, as the economy improves, are people who aren't in the labor force enticed to enter it, by better wages or an easier ability to find a job? That's what I'm looking at this week. Today I'll set the table with a brief overall look. Later this week I'll take a look separately at how much improving wages matter, and how much a lower unemployment rate matters.
Let me start by looking at two overall graphs. First, here is the labor force participation rate vs. real wages for the last 50+ years:
Second, here is the labor force participation rate (inverted) vs. the unemployment rate for the last 50+ years. The LFPR is inverted because presumably we mainly want to see if decreased unemployment is associated with an increase in particpation:
There's nothing useful here! The LFPR goes up until the mid-1990s, then sideways, then takes a dive during the "great recession." Meanwhile the unemployment rate zigzags up and down, and real wages go up, then down from 1974 to 1995, then zigzag up and down and up again.
Part of what is going on is the different long-term trends of men and women in the labor force. The participation rate for men in the labor force has been falling, more or less steadily, since the 1950s. Meanwhile women entered the workforce by the millions between the 1950s and 1990s, but their participation rate has held steady and then fallen slightly since then. A second more recent issue is the ongoing retirment of the Baby Boomers:
But the big thing to notice for my purposes is that once we separate out men and women, we see that the increasing/decreasing trend for each holds basically steady for decades. In the 60 years since 1955, men's participation has fallen by a little over 18%, or -0.3% per year on average. In the 45 years between 1955 and 2000, women's participation rotse by about 25%, or a little over +0.5% per year, before basically leveling out.
Thus, if we look at each year-over-year, and factor in the above long-term trends, then we ought to be able to tease out the cyclical change. Here's what we find for men (participation YoY -0.3%):

and for women (participation YoY +0.5%):

Now we can see that, although it is a little nosiy, the labor force participation for both men and women increases compared with trend during economic expansions, and then decrease around recessions.
Armed with this information, in part 2 I'll compare this with real wages. In part 3 I'll compare with unemployment. Finally in part 4 I'll take a brief look at child care issues and the effect of the retiring Boomers.
Sunday, January 15, 2017
Barack Obama: a noble failure
- by New Deal democrat
Let me preface this essay by saying that I voted for Barack Obama twice, in both 2008 and 2012. In fact in 2008 I supported him in the primary against Hillary Clinton, who I believed had a ceiling of support at about 52% or 53% even under even under the most favorable of circumstances (which certainly seems correct now!). I believed Obama was simply more capable of winning the Presidency, and I believed he could overcome his weaknesses and grow into the job. By and large he did, but it took 5 full years before he finally gave up on his central, failed approached to governance. I believe that failure is going to cause him to be ranked, over time, in the bottom half of all Presidents.
"There is no red or blue America," Barack Obama declared in the 2004 convention speech that first brought him fame. His presidency was largely based on that premise. I think very few people would agree with that statement now. This worldview was epitomised in his 2009 Inaugural Address:
On this day, we gather because we have chosen hope over fear, unity of purpose over conflict and discord.On this day, we come to proclaim an end to the petty grievances and false promises, the recriminations and worn-out dogmas, that for far too long have strangled our politics.
....[E]verywhere we look, there is work to be done. The state of the economy calls for action, bold and swift, and we will act ....
....
What the cynics fail to understand is that the ground has shifted beneath them — that the stale political arguments that have consumed us for so long no longer apply.
For we know that our patchwork heritage is a strength, not a weakness.... [W]e cannot help but believe that the old hatreds shall someday pass; that the lines of tribe shall soon dissolve ....
But on that very same day in 2009, Mitch McConnell and other GOP leaders also met, and resolved a strategy of total intransigence, to deny Barack Obama any bipartisan victories whatsoever.
Asked about that strategy early on, Obama replied that if Republicans would not come to the table with him, then they would miss the chance to have their imprint of the solutions to big problems. Rather than be shut out, they would negotiate with him for bipartisan Great Solutions.
Eight years later, on the eve of the inauguration of Donald Trump, a man who more than half of all Americans believe lacks the basic temperament to be President, the strategy of complete intransigence must be judged a spectacular success. Obama's entire governing philosophy is in shambles. Few people now would agree with Obama's inaugural proclamation that old political battles are over, or that "the lines of tribe" have dissolved.
Barack Obama achieved three notable domestic victories in his time in office: the 2009 stimulus, Obamacare, and his "evolution" on gay marriage which helped lay the groundwork for the apparent success -- so far -- of that ruling. Internationally he got American troops out of Iraq, brokered a nuclear deal with Iran, an agreement on global warming, and kept significant numbers of American "boots on the ground" being committed to any new conflict anywhere.
But while Obama acknowledged in his 2009 inauguration speech that the economy was in crisis, he aimed a firehouse of money at the financial sector, while leaving homeowners helpless. The "TARP" program was barely implemented at all; mortgage cramdown bankruptcy legislation, which he asked be delayed in 2008, he declined to press at all once he took office.
But while Obama acknowledged in his 2009 inauguration speech that the economy was in crisis, he aimed a firehouse of money at the financial sector, while leaving homeowners helpless. The "TARP" program was barely implemented at all; mortgage cramdown bankruptcy legislation, which he asked be delayed in 2008, he declined to press at all once he took office.
As a result, Wall Street and corporate America rebounded to record profits quickly. Jobs came a little later, but even now after 8 years few would argue that we have returned to full employment. And wages languished for years, even now only growing at 2.5% a year for nonsupervisory personnel.
Meanwhile he failed at a basic task of administration: nominating and having confirmed candidates for hundreds of Federal vacancies, including not just judgeships, but also several appointments to the Federal Reserve, and *every one* of the nine administrators of the Postal Service. All of these will be gleefully filled by his adversaries after January 21.
And should any of the Supreme Court's liberal justices -- or even Justice Kennedy -- pass away or retire from the bench in the next 4 years, the odds are very good that 5 hardline conservative jurists will roll back Obama's victory on gay rights, along with abortion rights and perhaps even going so far as to reinstate the Lochner ruling which essentially declared all Federal economic welfare legislation unconstitutional.
Great presidents do not see their signature legislation repealed within 30 days of their departure from office. And nobody with working brain cells would deny that the nation of red and blue states is further apart than ever, with people actually making choices about where they want to live based on the political leanings of the state and locality. Great presidents do not see the number of elected offices held by members of their party shrink to near 100 year lows.
Meanwhile Trump also promises to roll back all of Obama's international deals. And TPP, the Trans-Pacific Partnership trade deal, didn't even survive to January 20, dying at the ballot box on November 8.
The root cause for all of this misfortune is that Barack Obama consistently overestimated the power of his charisma, and underestimated the determination of his opposition. He thought that the merits of his proposals and accomplishments would sell themselves. Thus as early as summer 2009, he allowed the argument about his healthcare legislation to be ceded to "tea party" protesters who appeared at Congressional town halls.
Trump takes to Twitter to use it as a megaphone when he at least temporarily saved 800 jobs at Carrier. Obama never made sure Americans understood that Obamacare had given coverage to some 20 million people, and that medical cost growth had slowed.
In 2010 retiring democratic Representative Marion Berry of Arkansas captured Obama's quintessential shortcoming in one devastating vignette:
“[Barack Obama] just kept telling us how good it was going to be. The president himself, when that was brought up in one group, said, ‘Well, the big difference here and in ’94 was you’ve got me.’”
Disaster ensured. And ensued again in 2014 as well. And most especially in 2016, with the essential continuation of the United States as a republic more at risk than at any time since 1861.
Barack Obama had noble ideals, and a noble concept of the politics of governance. But his goals were scotched, and his accomplishments are all on the verge of extinguishment. He is well known for taking the "long view," but sadly for him - and for us - in the long view history will likely judge Barack Obama's presidency a noble failure.
Subscribe to:
Posts (Atom)