Saturday, March 30, 2019

Weekly Indicators for March 25 - 29 at Seeking Alpha


 - by New Deal democrat

My Weekly Indicators post is up at Seeking Alpha.

There were a number of important changes in the outlook this week.

As usual, clicking over and reading should not just be educational for you, but also rewards me a little bit for my efforts.

Friday, March 29, 2019

Real personal income and spending sag


 - by New Deal democrat

Along with jobs and wages, household and personal income and spending are my main focus on how average Americans are doing in the economy.

We’ll get the next jobs report a week from now, but today we got - almost updated to the present - January personal income and February personal spending.

First of all, in my rubric of long leading, short leading, and coincident indicators, both of these are coincident. They tend to top out, or at least sharply decelerate, right when a recession begins. Here’s the performance of income including the last two recessions, and spending for the last one:


So they really tell us nothing about the future of the economy.

Now, to the data. Adjusted for inflation, incomes fell -0.2% in January


These have declined ever so slightly in the past two months, although they are up +2.7% and +3.0% since last February. Nominally incomes rose +0.2% in February, but we won’t have the inflation-adjusted figure until next month. If the deflator is in line with consumer inflation, which rose +0.2% in February, then real personal incomes will be flat.

Personal spending declined -0.1% nominally in January, but rose +0.1% adjusted for inflation, after a decline in December:


These are weak reports, in line with the slowdown forecast I made last summer. Where they go from here will have a lot to do with whether the Fed lowers rates quickly or not, and whether or not there are more boneheaded economic moves from the Administration.

Thursday, March 28, 2019

The last long leading indicator, corporate profits, declined in Q4 2018


 - by New Deal democrat

Three months after the quarter ended, corporate profits for Q4 of 2018 were reported this morning, and they were down slightly (-0.1%). Here’s the quote from the BEA:
Corporate profits deflated by unit labor costs are a long leading indicator. Since these costs were already reported at +1.6% q/q, that means that adjusted corporate profits were down about the same percentage.
Earlier, proprietors income for Q4 had been reported at positive, but that is a less accurate placeholder. In contrast, Q4 corporate earnings for the S&P 500, with 99.7% reporting, declined over -3% q/q.
This means that, in Q4 of last year, almost *all* of the long leading indicators declined, the first time that has happened since - perhaps not coincidentally - shortly before the last recession.

Wednesday, March 27, 2019

Here’s a model that didn’t pan out in 2018


 - by New Deal democrat 

A little over a year ago, I proposed A simple model of interest rates and the jobs market. As I explained at the time, “during the past such era of [low interest rates in] 1930-1955 several recessions including the very bad 1938 recession occurred without a yield curve inversion, I have been looking at alternative measures.” 

What I found was that “a YoY increase in the Fed funds rate equal to the YoY% change in job growth has in the past almost infallibly been correlated with a recession within roughly 12 months.”

Here’s the graph I posted of “the relationship I describe in the above paragraph over the last 60+ years:”   


Another graph “subtract[ed] the YoY change in the Fed funds rate from YoY payroll growth, and subtracts a further -0.5%, showing that even when the relationship gets that close, with the exception of 2002-03 (a near recession), a recession has always followed:”


“In other words, there is only one false positive with two false negatives in the 1950s.”

I further wrote that “because the YoY change in the Fed funds rate also does a very good job forecasting the *rate* of YoY change in payrolls 12 to 24 months out, as shown in the below graph (note that the Fed funds rate is inverted, so that a rise in that rate forecasts a deceleration in YoY jobs growth):”


I concluded that  “Currently [in March 2018] the spread is about +0.7%. Note that if the rate of YoY payrolls growth continues to decelerate at its pace from the last several years, and we get the three expected Fed funds hikes this year, we will probably cross the +0.5% threshold by year's end.”


In the last year, I haven’t referred to this model very much, and there’s a reason: it really hasn’t panned out.
To begin with, the YoY growth rate of jobs, instead of declining towards the rate of change in the Fed funds rate, instead increased (at least through January!):


More importantly, the model specifically forecast that the second derivative, i.e., the rate of change in job growth, followed the inverse of the change in the Fed funds rate (i.e., an increase of 1% in the Fed funds rate should lead to a decrease of 1% in the rate of job growth YoY). Instead, the opposite happened:


The only manner in which the analysis held up is that the rate of change in jobs growth never did decline to below +0.5% YoY, which almost always indicated a recession was near (note the graph below subtracts -0.5% from the result, so that the zero line is the decisive point):


So the forecast from one year ago of a decline in jobs growth to 0.5% of less was a complete bust.
Most likely, this was because of the boost to consumption spending beginning in late 2017 first as part of recovery efforts from the hurricanes and fires that year, and second as part of the tax cut stimulus (which even if inefficient and inequitable, was nevertheless a stimulus).
With these two factors no longer in play in YoY numbers, will the relationship reassert itself, in part or in full, completely knocking out the 2018 job gains? I don’t know. If something significant happens to answer this one way or the other, I will update.
But, because the forecast was so incorrect in 2018, I am reluctant to rely upon it as a “no recession” indicator now.

Tuesday, March 26, 2019

February housing data indicates slump not over UPDATED


 - by New Deal democrat

Housing data, in the form of February permits and starts, finally caught up after the government shutdown. Two sources of house price data were also released this morning.

The bottom line is that, depending on how you measure, housing construction is likely either at or just slightly above a short term bottom. Price growth, meanwhile, continues to decelerate.

I have a more detailed analysis in the queue at Seeking Alpha. Once it is published, I will link to it here.

UPDATE: Here’s the link to the Seeking Alpha article. As always, reading this not only should help you understand what is going on this important market, but rewards me a little bit for my efforts.

Monday, March 25, 2019

The coming slowdown in employment


 - by New Deal democrat

Last summer I wrote a piece entitled “What the compressed yield curve means for employment.” I re-read it over the weekend, and in light of what has been going on in the bond market, I thought it was worth an update.

Let me pretty much re-quote the entire piece:
————

Four times during the 1980s and 1990s the difference in the interest yield between 2 and 10 year treasury bonds got about as low as it is now [Note: i.e., August 2018] (blue in the graphs below). That occurred in 1984, 1986, 1994, and 1998. 

Even though on none of those 4 occasions a recession followed, on 3 of 4 of those occasions YoY employment gains (red, divided by 2 for scale) subsequently declined:


In both 1984 and 1994, YoY employment gains peaked within 2 months of the low point in the yield spread. In the 1980s, that decline continued right through and a little beyond the 1986 low in spreads. In both cases YoY gains in employment declined by roughly half. Only in 1998 was there no appreciable effect.

On all 4 of those occasions the Fed lowered interest rates until the economy started to rebound - quickly in the case of 3 of them.

In other words, even if the Fed stops raising rates now [as of August 2018], and the yield curve does not get tighter or fully invert, my expectation is that monthly employment gains will decline to about half of what they have recently been -- i.e., to about 100,000 a month -- during the next year or so.
——-
- End of quote

In the last week, I’ve noted that the current yield curve inversion also looks very much like the slowdown of 1966, so let’s look at what happened to employment then as well (note I am using the 10 year vs. 3 month rate, since the 2 year treasury doesn’t go back that far):

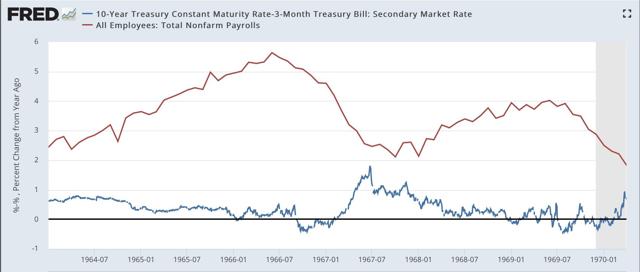
 YoY employment growth slowed down sharply, from over 5% to just above 2%.

Let me put this in all caps for emphasis: GOING BACK OVER 60 YEARS, ON 12 OF 13 TIMES THAT THE YIELD CURVE WAS AS COMPRESSED AS THIS, OR EVEN JUST NEARLY AS COMPRESSED, EMPLOYMENT GROWTH SLOWED DOWN BY AT LEAST 50% MEASURED YEAR OVER YEAR, INCLUDING BOTH RECESSIONS AND SLOWDOWNS.

Nothing is perfect, but that’s about as tight a correlation as you can get.

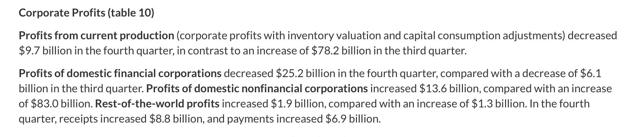
Returning to the present, since last August the Fed did not stop raising rates, raising them twice more in September and December. Most of the yield curve - although notably, neither the 2 year vs. 10 year, or 10 year vs. 30 yer ranges - has inverted.

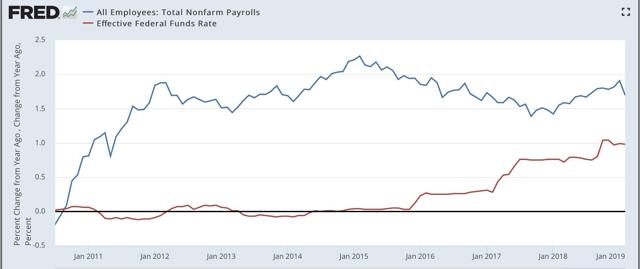
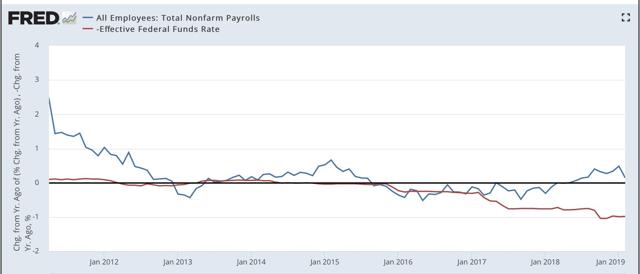
So let’s look at the same comparison of bond spreads and YoY employment for the last five years below:


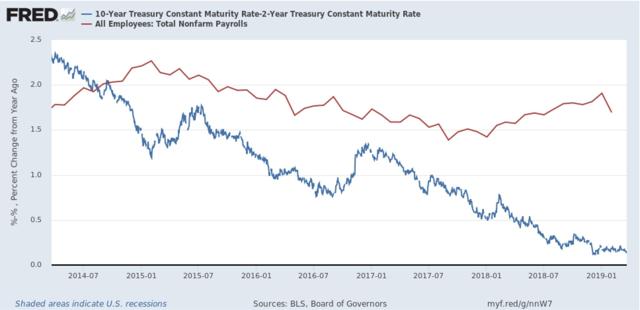
Even if the Fed starts to lower rates soon, I strongly suspect that January was the YoY peak in employment, and we have started down the road to roughly 100,000/month employment gains - if not worse - later this year.