Saturday, May 28, 2022

Weekly Indicators for May 23 - 27 at Seeking Alpha


 - by New Deal democrat

My Weekly Indicators post is up at Seeking Alpha.

Few changes to the headlines, but lots of churning underneath.

People seem to have jumped the gun on recession, thinking one is either here or imminent. It’s not here, and it isn’t imminent. I wonder if people will get complacent later in the year, thinking we have dodged a bullet. That probably won’t be true either.

In any event, clicking over and reading will bring you right up to the moment on the long leading, short leading, and coincident readings on the economy, and bring me a little pocket change.

Friday, May 27, 2022

Real income and - especially - spending increase in April, but households are getting much more overextended


 - by New Deal democrat

In April nominal personal income rose 0.4%, and spending rose 0.9%. March’s spending was revised up from 1.1% to 1.4%. In more good news, the personal consumption deflator, i.e., the relevant measure of inflation, rose only 0.2%, so real income rose 0.2%, and real personal spending rose 0.7%. So far, so good.

While both real income and spending are well above their pre-pandemic levels, I have stopped comparing them with that, but instead with their level after last winter’s round of stimulus. Accordingly, the below graph is normed to 100 as of May 2021: 


Since then spending is up 3.3%, while income has declined -1.0%.

Comparing real personal consumption expenditures with real retail sales for March (essentially, both sides of the consumption coin) shows big increases in both:


The one fly in the ointment is that, as a result, the personal saving rate declined another -0.6% from a revised 5.0% in March to 4.4% in April.  The below graph of the last 60+ years subtracts 4.4% from all months, so that the current reading is shown as 0:


Usually the savings rate has tended to decrease as expansions grow longer, leaving consumers more vulnerable to shocks (e.g., gas prices). The current value is the lowest of any period except the two months after 9/11, and the 2004-2008 period when home equity refinancing from the last housing bubble was all the rage. In other words, so far consumes are making up shortfalls by digging into savings or tapping another source of credit, probably home equity. 

This is very concerning late cycle consumer behavior, and leaves households very vulnerable to further prices increases in, e.g., gasoline. But it may continue until house prices inevitably break.

Thursday, May 26, 2022

Initial and continuing jobless claims continue moderating trend


 - by New Deal democrat

Initial jobless claims declined 8,000 to 210,000 last week, continuing above the recent 50+ year low of 166,000 set in March. Meanwhile the 4 week average rose by another 7,250 to 206,750, compared with the all-time low of 170,500 set seven weeks ago.  Continuing claims also rose from their 50 year low of 1,317,000 set last week to 1,346,000:


Initial claims have trended slightly higher over the past 2 months. This continues to indicate a little cooling in the white hot employment market, which nevertheless remains  the brightest spot in the entire economy.

Wednesday, May 25, 2022

Real money supply declines sharply; another leading indicator for recession next year


 - by New Deal democrat

Real M1 declined -0.8% in April, and real M2 declined by -0.7%, following March declines of -1.0% for each:


These have been the sharpest monthly declines since 2005:


Real money supply is a long leading indicator, as shown in the below graph of both real M1 and real M2 going back over 60 years (shown in log scale to prevent inflation from showing earlier periods as mere squiggles):


Here is a close-up of the past 10 months showing both:


Real M1 is at a 9 month low. Real M2 is at a 12 month low.

Real M2 fell out of favor after failing to actually decline YoY prior to the 2001 and 2008 recessions, but a YoY% decline in real M1 and a real YoY% gain of M2 of less than 2.5% is nevertheless an excellent leading indicator for recession:


Again, the short term view shows that real M1 is only up 0.7% YoY (and if the trend continues, will be negative YoY in one month). Real M2 is already negative YoY:


Real money supply is now another negative leading indicator for recession next year.

Tuesday, May 24, 2022

New home sales get walloped


 - by New Deal democrat

New single family home sales got walloped in April, declining -16.6% for the month compared with March, and down -26.9% from one year ago. Measured from their most recent peak last December, they are off -29.6%, and measured from their pandemic peak of August 2020, they are down a whopping -43.0%! :


In the long term perspective, a decline like this is usually recessionary:


But not always: from November 1965 to September 1966, sales declined -41.9%; from March 1986 to January 1988, they declined -33.5%; and from December 1993 through February 1995, they declined -31.2% - in each case without a recession following, although in each case real GDP decelerated sharply to nearly zero, even if it remained positive.

Further, new home sales are heavily revised after the first report. It is not unusual at all for big monthly moves like this to suddenly look much less severe when the number gets revised one month later. I would not be surprised in the slightest if that happened to this month’s cliff dive, when next month’s report comes out.

As to prices, in the first graph above note that the median price of a new home continued to rise (red). As shown in the below graph of YoY changes, prices are still up 19.6% from one year ago, even as sales are down:


This confirms for the umpteenth time that sales lead prices, as shown in the longer term YoY perspective (note: graph averaged quarterly to cut down on noise):


In the past prices have continued to rise sometimes for over a year after sales went into steep declines.

Finally, here is a comparison of housing starts (blue), single family permits (red), and new home sales (gold), all normed to 100 as of February 2020:


Although it is a very noisy number, new home sales frequently do peak and trough before either of the other two numbers - and it appears they did so again during this expansion. Keeping very firmly in mind my above note about revisions, today’s new home sales number suggests that more substantial declines in permits, and ultimately starts, will soon take place. This does not portend recession now, but is a significant piece of evidence adding to the heightened possibility of recession next year.


Monday, May 23, 2022

Inflation reversals as unique markers of Boom and Bust cycles vs. Fed interventions


 - by New Deal democrat

As I’ve already mentioned a couple of times, I am seeing posts from the usual DOOOMERS warning that a recession is imminent, if we’re not already in one. Typically - again, as per usual - they cite data that they never bothered with before, and won’t bother with again when it turns up, in support of their claims.


These cherry-pickers have strong narratives, so they get a lot of dedicated (and probably a lot of new, naive) followers. But they’ve been wrong many times before, and they’re probably wrong again now.

Another issue I’m seeing is people projecting the negative or decelerating trends of the last few months ahead. That’s also very typical, and also makes for lots of mistakes. While it is OK to use, e.g., a short leading indicator to project a coincident indicator forward, it is a mistake to project that *same* indicator forward simply because of its recent trend.

I’ve also mentioned before that we are currently in a “boom and bust” type cycle that we used to have before the Federal Reserve actively managed interest rates starting in the late 1950s. So let me very briefly compare an important difference between the two types of cycles.

Here are the Boom and Bust cycles from the end of WW2 through the 1950s:


Note that the Federal Reserve basically stayed on the sidelines. In fact, the yield curve never inverted at all until late in the 1950s - and yet there were two complete cycles, typified by sharply accelerating commodity and consumer inflation, which abruptly reversed coursed an decelerated to close to if not outright deflation at the onset of recession. This occurred because consumers could not keep up with the price increases. Typically mortgage rates (not shown) also rose enough to cause big changes in monthly house payments.

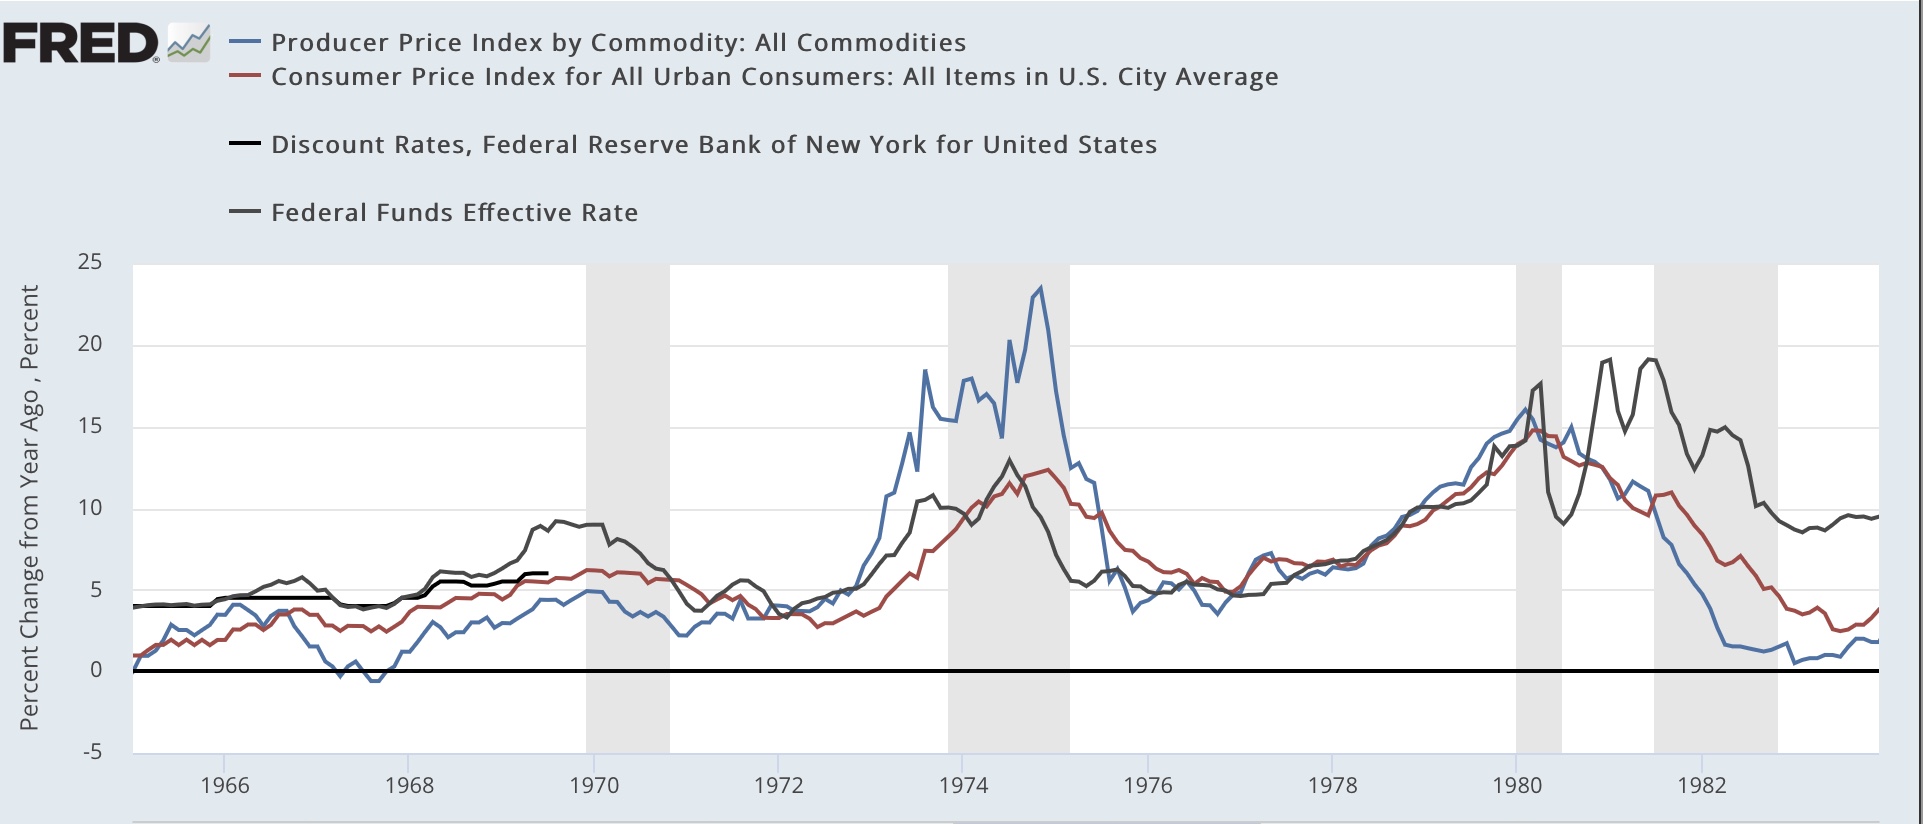
Now here are the 1970s stagflationary cycles:


There cycles were also typified by high inflation, but the Fed intervened early, raising rates substantially and (again not shown) causing an inversion of the yield curve. The recessions happened before either commodity or consumer inflation decelerated that much - in two cases not at all!

Now, here is our current cycle:


As in the two immediate post WW2 cycles, the Fed has barely intervened - if you squint, you can see the slight rise in the Fed funds rate from zero at the far right. But also, neither commodity nor consumer inflation has cooled at all on a YoY basis.

Until one or both of those markers - an inverted yield curve or a sharp decline in inflation - occur, I do not see any recession in the immediate future.

I plan on examining this in much more detail in a post at Seeking Alpha.