Saturday, August 10, 2019
Weekly Indicators for August 5 - 9 at Seeking Alpha
- by New Deal democrat
My Weekly Indicators post is up at Seeking Alpha. Corporate bond yields made another new expansion low, which is a big deal.
As usual, clicking over and reading should be educational for you, and puts a couple of pennies in my pocket to reward me for my efforts.
Friday, August 9, 2019
Q2 Credit conditions were decidedly mixed
- by New Deal democrat
Credit conditions are one of my categories of long leading indicators. I track the Chicago indexes weekly, but the more comprehensive Senior Loan Officer Survey only comes out once per quarter.
The 2nd Quarter Survey was published earlier this week. I have a post describing what it shows up at Seeking Alpha.
As usual, clicking on the link at reading should give you good information, and reward me with a little jingle.
P.S. I have all the graphs queued up and ready for my long leading forecast through midyear 2020. Now I just have to get motivated enough to write all the descriptions....
Wednesday, August 7, 2019
Notes on the June JOLTS report: weakness but no imminent downturn
- by New Deal democrat
I’m still on vacation, so continue to expect light posting. But I thought I’d take a look at the one piece of data that came out this week, the June JOLTS report.
First of all, the “hiring leads firing” mantra continues to be true:
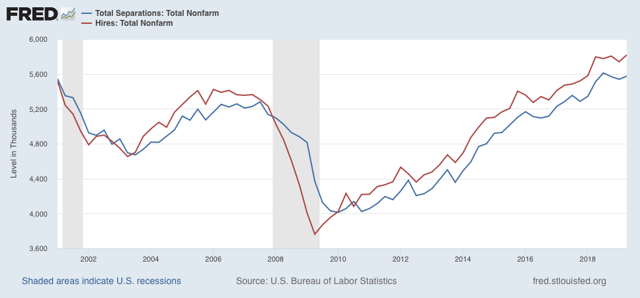
[Note: data averaged quarterly to cut down on noise.] Interesting that hiring has been essentially flat for a full year, and total separations (“firing”) for the past three quarters.
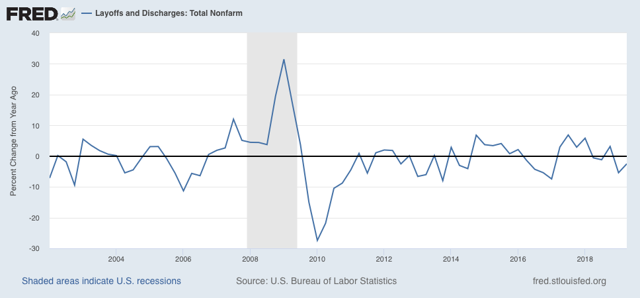
But the layoffs and discharges part of separations continues down YoY, a good thing, and what initial jobless claims and the unemployment rate also show, if weakly:
But the relative weakness of the employment situation show up in the YoY% changes in hiring, voluntary quits, and job openings (all normed to zero at their current levels in the below graph):
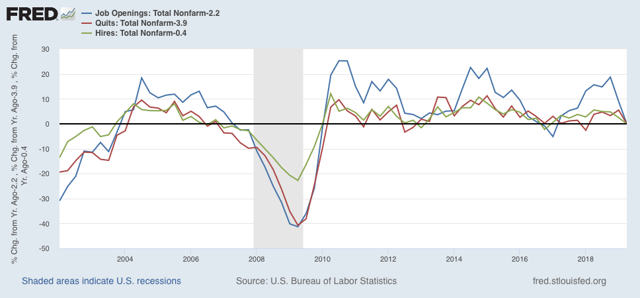
Note that the changes aren’t as bad as during the 2015-16 shallow industrial recession, or immediately before the 2007 recession (they’re more like 2006 levels).
I thought I’d extend Monday’s graph of monthly manufacturing, residential construction, and temporary job changes back through the weak 2015-16 period and compare that as well:
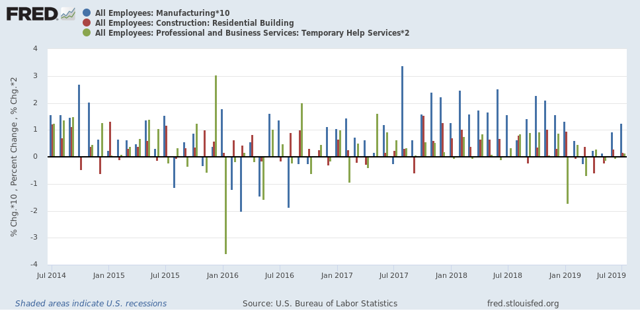
The “shallow industrial recession” featured more negative manufacturing and temporary jobs months than this year so far.
Again, the takeaway is weakness, but no imminent downturn.
Monday, August 5, 2019
Scenes from the July employment report
- by New Deal democrat
First things first: I’m on a vacation for part of this week, so don’t be surprised if there are no postings for a few days.
The July employment report continued a string of good headline numbers with weak leading internals. Let’s take a look.
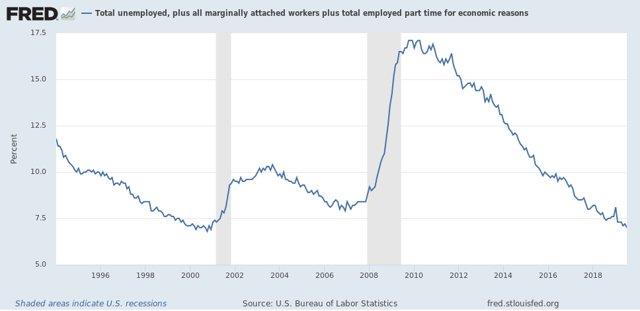
In the good news department, the U6 underemployment rate declined to yet another new expansion low of 7.0%. This is mainly due to the continuing decline in the involuntarily part time employed. The only three months it has been better than that since the modern series started were three months in the year 2000:
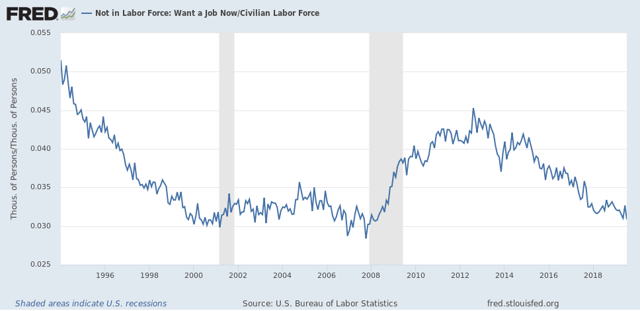
When we go further and take a look at those who aren’t even in the labor force, because they aren’t looking for a job, but say they want a job now, we’re about 0.2% above the 2000 lows and about 0.5% above the all-time lows in 2007:
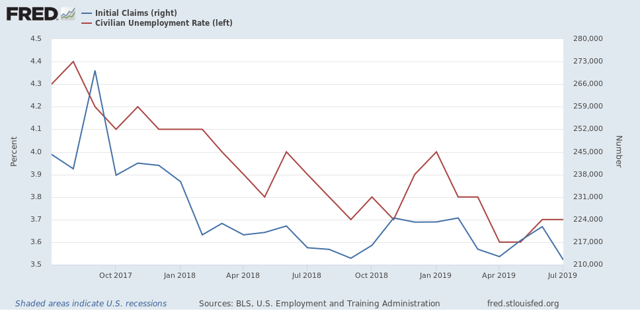
Also, as initial jobless claims continue to trend slightly downward YoY, the U3 unemployment rate is likewise trending slightly downward as well (remember that the former generally leads the latter by a month or two):
Now to the bad news. I’ve been tracking manufacturing, residential construction, and temporary jobs since the beginning of the year, since these three sectors tend to lead the rest. While manufacturing employment has picked up in the last two months - something of a puzzle, because the ISM readings have been down - construction and temp employment continue close to zero gains, which are way down compared with last year:
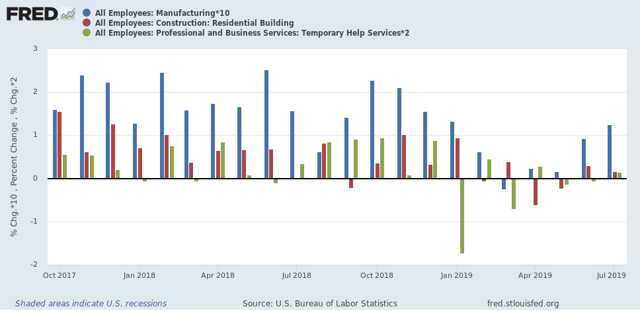
Temporary jobs in particular have not made a new high since last December.
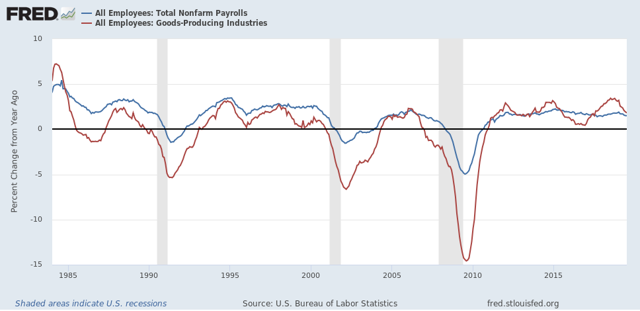
Gains in the broader goods producing category has also decelerated sharply, although they are still positive YoY. I would expect this to turn negative before any recession were to begin:
Finally, the average manufacturing work week is one of the ten items in the Index of Leading Indicators. These are down -0.9 hours since their peak in April of last year. In the past this has almost always meant a recession. The best way to show you this graphically is the YoY comparison, which is down -0.7 hours, so I’ve added +0.7 to make that the zero line:
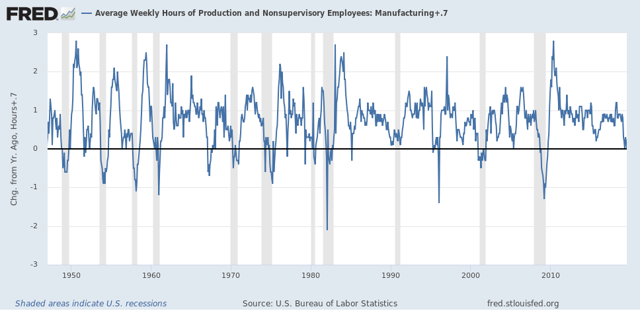
Hours have been down this much or more for 10 of the last 11 recessions. There are only three false positives (1952, 1966, and 1995) for readings this low for more than one month.
In summary we have good present conditions, with leading indications of at very least a slowdown still ahead.
Subscribe to:
Posts (Atom)