Saturday, April 20, 2019
Weekly Indicators for April 15 - 19 at Seeking Alpha
- by New Deal democrat
My Weekly Indicators post is up at Seeking Alpha.
The data has been very mixed in the past few weeks. Either the slowdown is already over, or else this is a rebound from a "mini-recession" caused by the government shutdown, after which the slowdown will be resumed. We'll see!
Friday, April 19, 2019
Sales rebound from government shutdown-induced “mini-recession;” March housing lays an egg
- by New Deal democrat
While March retail sales rose strongly, total business sales for February - also released yesterday - which includes manufacturers’ and wholesalers’ sales in addition to retail sales, continued to languish. This adds to the evidence that there was a “mini-recession” for several months likely brought about by the lengthy government shutdown, and there has been a rebound since (including blockbuster new lows in jobless claims).
This post is up at Seeking Alpha.
But I’ve been reluctant to conclude that the slowdown this year is off. This morning’s housing permits and starts for March were solid evidence in support of that position, showing that the recent decline in mortgage rates hasn’t filtered through to new housing construction yet. Housing may be bottoming, but it’s at near-recessionary levels.
I have a post in the queue at Seeking Alpha on that as well. Once it is posted, I’ll put up a link.
UPDATE: And, it’s already up Here.
Thursday, April 18, 2019
March real retail sales very strong, but no “all clear” yet
- by New Deal democrat
This morning’s retail sales report for March was very strong on both a nominal basis, up +1.6%, and also on a real, inflation-adjusted basis, up +1.2%. At the same time, it is still ever so slightly below its peak of five months ago, and YoY real sales have not recovered to those typical for this expansion. Let’s take a look.
Below are real retails sales for the last few years, and because it is a long leading indicator, real retail sales per capita (in red):
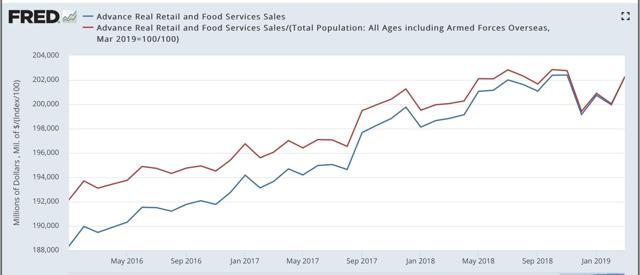
As revised, both of these last made new highs last October. So the good news is, the weakness of the last few months has been entirely reversed. The caution is, we still don’t have a new high, although this data series is notoriously noisy.
Although the relationship is noisy, because real retail sales measured YoY tend to lead employment (red in the graph below) by a number of months, here is that relationship for the past 25 years (averaged quarterly to cut down on noise):
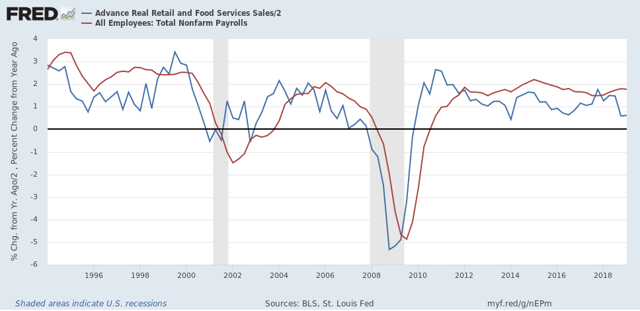
Although there has been some recovery in the YoY real retail sales measure, the prior weakness has not been revised away. As a result, I continue to think that employment gains are likely to downshift significantly over the next several months.
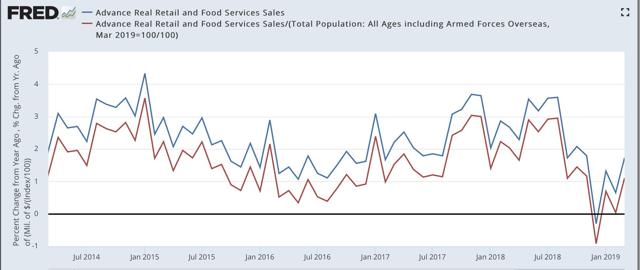
Next, here are both forms of real retail sales YoY recently:
And here are real retail sales per capita YoY, going all the way back to 1948:
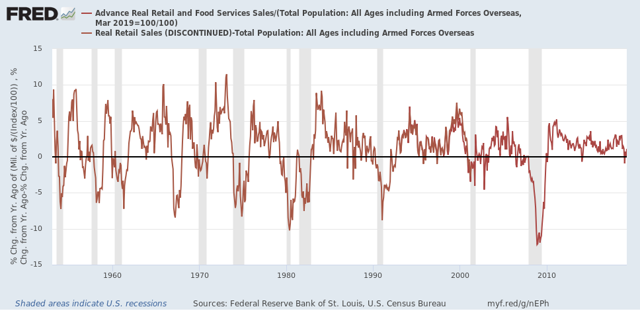
In the last 70 years, this measure has always turned negative at least shortly before a recession has begun. There are no false negatives. While there are about a dozen false positives for a single negative month, there are only four false positives for consecutive negative readings — 1966, 1995, 2002, and early 2006. Since there has only been one month - last December - where this was negative YoY, this was probably a false positive as well.
To sum up, this was a very good reading that, together with yet another 49 year low in initial jobless claims this morning, negatives any imminent recession. At the same time, while we are certainly headed in the right direction, because we have not exceeded the highs of nearly half a year ago, there are still signs of weakness.
Wednesday, April 17, 2019
YoY Industrial production and structural changes to the US economy since 1980
- by New Deal democrat
No big economic releases today, so let me follow up further with a few long-term comments on industrial production.
This series goes back 100 years to the beginning of 1919. Since that time it has turned negative YoY 25 times:
This series goes back 100 years to the beginning of 1919. Since that time it has turned negative YoY 25 times:
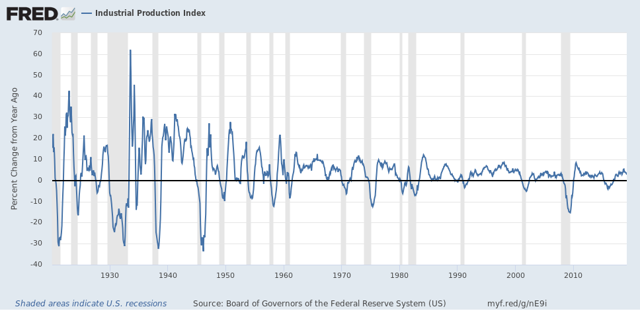
Of those 25 times, 17 have been during recessions, sometimes having started shortly beforehand. On only 8 occasions have negative YoY readings not been associated with recessions. That’s better than a 2:1 rate of correct readings vs. false positives, with no false negatives.
But it gets better. If you take out the 4 times industrial production has been negative YoY for only one month — July 1954, July 1967, July 1989, and January 2014 — that’s 17 correct calls and only 4 false positives, a ratio of better than 4:1.
The four remaining times were 2 occasions of 4 months’ duration: July through October 1934, October 1989 through January 1990; I occasion of 12 months’ duration: August 1951 through July 1952. And the biggest false positive of all: March 2015 through October 2016, the recent “shallow industrial recession:”
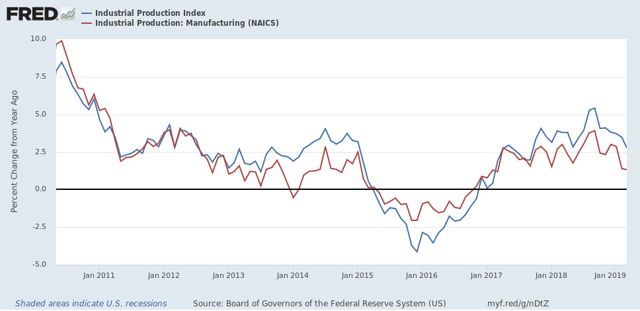
As the above shows, while the Oil patch bore the brunt of that downturn, manufacturing turned down as well. But there was no recession, because the rest of the economy held up.
Which brings me to a second point. Here’s the long-term graph of industrial production vs. real GDP, both measured YoY:
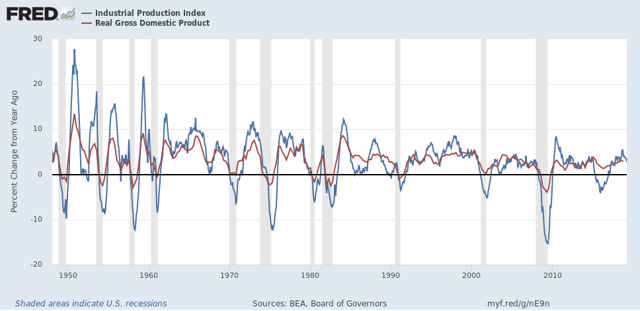
Until the 1980s, both moved in tandem. While there were differences in scale in steep downturns or upturns, both moved together.
Since the 1980s, though, there have been lengthy periods of industrial malaise where the economy still remained quite positive: twice in the 1980s, 2002-03, and the recent shallow industrial recession. This reflects the transformation of the US into a service economy.
One of the things that made the “Great Recession” so “great” was that it had the biggest ever downturn in jobs in the services sector, over -3%:
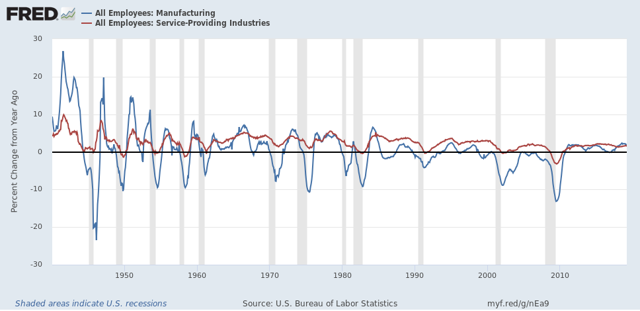
No other recession in the past 70 years even came close. In the runner-up, 1949, only -1.4% of services jobs were lost YoY.
The difference in manufacturing vs. service jobs and the fact that the big industrial production declines in 2015-16 failed to produce a recession together show us how much the economy has changed since 1980.
Tuesday, April 16, 2019
Industrial production continues to decelerate
- by New Deal democrat
Industrial production is the King of Coincident Indicators. In dating the onset and end of recessions, in practice the NBER relies upon industrial production more than any other measure.
March 2019 production continued a string of recent disappointments, with overall production declining -0.1%, and manufacturing production unchanged. For the first quarter of 2019 in total, overall production declined -0.3%, and manufacturing declined -0.8%. Here’s the graphic look at the past nine years:
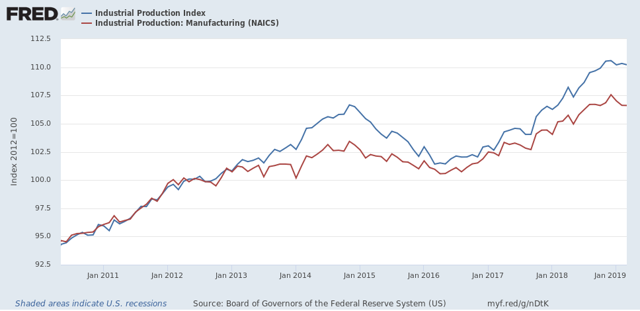
Note that the recent flatness is on par with, e.g., 2012, which was nowhere near to recession.
But on the other hand, after a surge last summer, leading some to conclude that we were in a “boom,” both total and manufacturing production have decelerated sharply on a YoY basis. Both levels YoY were last seen in late 2017:

The below graph subtracts the current YoY measure from each of the two so that the current level shows as zero on the historical graph. As of now both are at typical YoY levels for most of this expansion, but at or below YoY levels which in the past have typically been seen during slowdowns, e.g., 1966, 1985, 1996, and 2002, not to mention the “shallow industrial recession” of 2015-16:
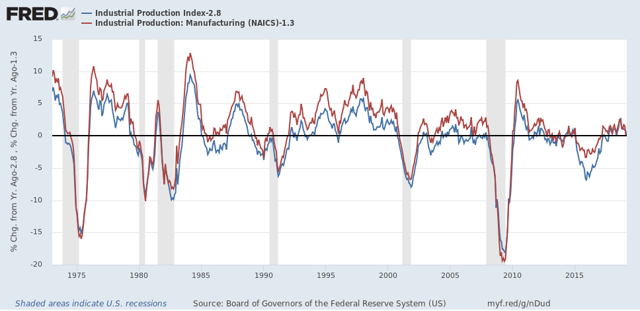
In short, by long term historical standards, industrial production is in a slowdown. By the standards of this expansion, it has slowed down from last summer’s “mini-boom” to more normal levels.
Monday, April 15, 2019
The three best arguments against an economic slowdown
- by New Deal democrat
I still think I’m right that there will be a worsening economic slowdown that shows up by about summertime and continues towards the end of the year.
But there is one long leading indicator and two important short leading indicators that are going the other way. Rather than ignore them, I accept them and explain why I don’t think they negate my forecast. This article is up at Seeking Alpha.
——-
On a more somber note, Today We Are All Parisians.
And now, watch me tap dance!
- by New Deal democrat
So I was going to post a piece on “why I could be wrong” here this morning. But then, because it is strictly about economic forecasting, I decided it really belonged over at Seeking Alpha, where I can earn my lunch money.
So I got nuttin’. Well, ok, the new orders subindex of the Empire State Manufacturing Index rose a little bit this month.
Aside from that, watch me tap-dance . . . .
When SA puts up my piece, I’ll link to it here for your reading enjoyment!
Subscribe to:
Posts (Atom)