Saturday, February 5, 2022

Weekly Indicators for January 31 - February 4 at Seeking Alpha


 - by New Deal democrat

My Weekly Indicators post is up at Seeking Alpha.

There is an old market saying that “the cure for high prices is, high prices.” Well, commodity prices, and in particular industrial commodities and oil, are at new multi-year highs. The latter is going to feed right through into higher gas prices that will be very much noticed by consumers.

And if there is one thing the Fed knows how to do, it is how to bring down (with lots of attendant discomfort) high consumer prices.

For the details on where we are in all of the relevant timeframes, click on through. Which will also reward me a little bit for bringing you all the detailed information.

Friday, February 4, 2022

January jobs report: huge gain in wages, huge upward revisions to past few months, limited Omicron impact


 - by New Deal democrat

Here are the three issues I was looking to see addressed in this jobs report: 
1. Would last month’s “poor” 199,000 number of new jobs be revised higher? 
2. Is wage growth holding up? Is it accelerating?
3. In December, big decreases in the number of initial jobless claims were not reflected in a better jobs number. Would the big increase in initial jobless claims in the past month due to Omicron similarly not be reflected? Or would they show up as an actual decline in hiring, as indicated in ADP’s -301,000 decline reported earlier this week?

The answers were:
1. The 6 month average of monthly gains which declined significantly in December from about 600,000 to 500,000, increased to 547,000, . We still have 2.9 million jobs to go to equal the number of employees in February 2020 just before the pandemic hit. At the current average rate for the past 6 months, that’s about 5 more months.
2. Wage growth exploded even higher than before, now up 6.9% YoY! Aside from April 2020, this is the highest wage growth in *40 years.*
3. There were *huge* upward revisions (included as part of the annual revisions) to the last 2 months. November increased 398,000 to 647,000, and December increased 311,000 to 510,000. So much for those poor numbers!

Here’s my in depth synopsis of the report:

HEADLINES:
  • 467,000 jobs added. Private sector jobs increased 444,000. Government jobs increased by 23,000 jobs. The alternate, and more volatile measure in the household report indicated a gain of 1,199,000 jobs(!), which factors into the unemployment and underemployment rates below.
  • The total number of employed is still 2,875,000, or -1.9% below its pre-pandemic peak. 
  • U3 unemployment rate rose 0.1% to 4.0%, compared with the January 2020 low of 3.5%.
  • U6 underemployment rate fell -0.2% to 7.1%, compared with the January 2020 low of 6.9%.
  • Those not in the labor force at all, but who want a job now, declined -9,000 to 5.704 million, compared with 5.010 million in February 2020.
  • Those on temporary layoff increased 147,000 to 959,000.
  • Permanent job losers declined -73,000 to 1,630,000.
  • November was revised upward by 398,000, and December was also revised upward by 311,000, for a net gain of 709,000 jobs compared with previous reports.
Leading employment indicators of a slowdown or recession

These are leading sectors for the economy overall, and will help us gauge how strong the rebound from the pandemic will be.  These were mixed:
  • the average manufacturing workweek, one of the 10 components of the Index of Leading Indicators, declined -0.1 hour to 40.2 hours.
  • Manufacturing jobs increased 13,000. Since the beginning of the pandemic, manufacturing has still lost -240,000 jobs, or -1.9% of the total.
  • Construction jobs decreased -5,000. Since the beginning of the pandemic, -125,000 construction jobs have been lost, or -1.6% of the total.
  • Residential construction jobs, which are even more leading, rose by 3,600. Since the beginning of the pandemic, 43,500 jobs have been *gained* in this sector, or +5.2%.
  • temporary jobs rose by 26,300. Since the beginning of the pandemic, 156,400 jobs have been gained.
  • the number of people unemployed for 5 weeks or less increased by 440,000 to 2,888,000, which is 949,000 higher than just before the pandemic hit.
  • Professional and business employment increased by 86,000, which is 511,000 *above* its pre-pandemic peak.

Wages of non-managerial workers
  • Average Hourly Earnings for Production and Nonsupervisory Personnel: rose $0.17to $27.91, which is a 6.9% YoY gain. This continues to be excellent news, especially considering that a huge number of low-wage workers have finally been recalled to work.

Aggregate hours and wages:
  • the index of aggregate hours worked for non-managerial workers fell by -0.3%, which is a  loss of -1.9% since just before the pandemic.
  •  the index of aggregate payrolls for non-managerial workers rose by 0.3%, which is a gain of 9.9% (before inflation) since just before the pandemic.

Other significant data:
  • Leisure and hospitality jobs, which were the most hard-hit during the pandemic, gained 151,000 jobs, but are still 1,750,000, or -10.3% below their pre-pandemic peak.
  • Within the leisure and hospitality sector, food and drink establishments increased 108,000 jobs, and is still -984,700, or -8.0% below their pre-pandemic peak.
  • Full time jobs increased 973,000 in the household report.
  • Part time jobs increased 136,000 in the household report.
  • The number of job holders who were part time for economic reasons decreased by -212,000 to 3,717,000, which is a decrease of -673,000 since before the pandemic began.
  • Health care employment rose by 18,000, a YoY gain of  174,900, or 1.1%, despite being the most critical sector during the pandemic.
  • State and local education jobs, another hard hit sector by the pandemic, increased 28,500.

SUMMARY

With the exception of some short term negative numbers caused by Omicron layoffs, and a further decline in average manufacturing hours, which is getting to the level of concern, this was an excellent report, buoyed in part by annual benchmark revisions. 

Monthly gains continue at a clip in excess of 500,000. At the current rate, we will have regained all jobs lost due to the pandemic by the 4th of July. The slight increase in the unemployment rate was because so many people entered the labor force. There was also some welcome news on education jobs. Only the leisure and hospitality sector remains really hard hit by the pandemic.

Perhaps the biggest news of all was the even bigger increase in average hourly wages by non-supervisory workers. A month ago I described the JOLTS report as being analogous to a reverse game of musical chairs, with jobs being the chairs and potential employees those wanting to sit in them. With a chronic shortage of people being willing to sit in the chairs on offer due to the pandemic, jobs are going unfilled, while virtually nobody is getting laid off. As a result, wages haven’t just increased, but they *continue* to increase and that rate of increase is even accelerating. Workers haven’t had it this good in decades.

So, a few clouds on the horizon (manufacturing), but another excellent jobs report.

Thursday, February 3, 2022

Jobless claims: Omicron still rules the roost, but effects abating


 - by New Deal democrat

It is clear that Omicron has continued to result in increased layoffs, but the effect is probably abating.

New claims declined 23,000 last week to 238,000 - still well above its pandemic low of 188,000 set early in December, but also a big retreat from 290,000 two weeks ago. The 4 week average of new claims increased 7,750 to 255,000:


Continuing claims for jobless benefits declined by 44,000 from 1,672,000 to 1,628,000, an increase of 73,000 from its 50 year low of 1,555,000 three weeks ago:


As I have written for several weeks, the effects of Omicron are going to continue for at least a few more weeks. At this point it’s pretty clear that Omicron has had a significant impact, and may even result in a negative jobs number for January in tomorrow’s nonfarm payrolls report. 


But with cases nationwide down by over 50% from peak as of today, I still suspect Omicron will be mainly behind us by the end of February. So I still do not see a big reason to overreact to the recent increase in claims. After all, in comparison with the past few decades or even past 5 years, 238,000 is a darn good number.

Wednesday, February 2, 2022

December JOLTS report: with Omicron raging, the pool of potential employees refuses to fill, meaning more record wage gains


 - by New Deal democrat

The Census Bureau has started to release the JOLTS report earlier in the month. So we got December’s report yesterday as opposed to in a week or two.  

Last month I introduced the idea of a game of musical chairs, where employers added or took away chairs, and employees tried to best allocate themselves among the chairs. Because of the pandemic, there are several million fewer players trying to sit in those chairs. As a result, wages have continued to increase sharply, as employers attempt to attract potential employees to sit in the empty chairs.

This pattern continued in December.

Layoffs and discharges (violet, right scale in the graph below) decreased 140,000 to 1.169 million, yet another new record low. Total separations (blue) declined 305,000 to 5.900 million:


Essentially, nobody is getting laid off.

Meanwhile, job openings (blue in the graph below) increased 150,000 to 10.925 million, a little below the July peak of 11.098 million. Openings have been basically steady for the past 6 months at record high levels. Voluntary quits (the “great resignation,” gold, right scale) declined -161,000 from November’s record high, to 4.338 million. Actual hires (red) declined -333,000 to 6.263 million, significantly below the June high of 6.827 million:


Hires and quits are in line with the relatively modest employment gains in the past few months compared with earlier in the year.

In summary, we continue to have near-record high job openings and quits, record low layoffs, with still-strong total separations, and slightly fading hires. Once again, little progress is being made towards establishing a new equilibrium.

As a result, wages continue to soar. Let me debut a new graph which I think shows the dynamic better than I have before. 

Below I show job openings divided by actual hires (blue, right scale). This gives me the rate at which openings are above or below hires, where 1.0 represents the level at which the number of openings and hires are equal. As you can see, this rate increases as expansions go on, and in the last 18 months has repeatedly made new all-time highs.

YoY wage gains for non-managerial workers (red, left scale) are a “long lagging” indicator, typically turning up well after an expansion is underway, and typically when the U-6 underemployment rate falls below about 9.0% (we’re at 7.3% now, the lowest except for the late 1990s tech boom and during 2019):

The result is that, as the rate of job openings for each hire has completely blown through prior highs almost every month in the past year, wage growth has responded by similarly spiking to the upside, to nearly 6% YoY. 

 So long as the shortfall in available workers to fill openings persists, potential employers will have to continually offer more compensation to attract applicants.In other words, wages will continue to rise until the potential employer can no longer make any profit off the potential employee for that job.

For the past several months, I have speculated that, in order for the situation to resolve, the first thing I want or expect to see is a further increase in monthly hiring. At the same time, or shortly thereafter, I would expect to see a significant decline in voluntary quits.

But this increase in hiring is only going to occur if potential employees feel safe returning to work. And that hasn’t happened with Omicron raging; and it won’t happen until more people feel the pandemic is abating. Until then, no dice.

Tuesday, February 1, 2022

Manufacturing continues strong in January; construction continued to sag in December


 - by New Deal democrat

As usual, the first data for last month starts out with the ISM manufacturing report. This index, especially its new orders subindex, is an important short leading indicator for the production sector. 

In January the index declined from 58.8 to 57.6, as did the more leading new orders subindex, which declined from 61.0 to 57.9 (note the breakeven point between expansion and contraction is 50):


Both the total index and the new orders subindex ran extremely hot throughout 2021, typically with readings over 60. In the past several months these have cooled a little bit, but are still very positive. This continues to forecast a strong production side of the economy through mid year 2022, if not so ‘red hot’ as before.

The second release that typically begins the month, construction spending for two months ago (December), rose 0.2% in nominal terms for overall spending including all types of construction, while spending on the leading residential sector rose 1.1%. Nominally, both made new all-time highs:


Adjusting for price changes in construction materials, which jumped another 1.7%, “real” construction spending declined -1.5% m/m, and “real” residential construction spending declined -0.6%. In absolute terms, “real” construction spending has declined sharply - by -20.5% - since its peak in November 2020,  while “real” residential construction spending has declined -15.7% since its post-recession peak in January of this year:


While total construction spending declined by more than it had before the Great Recession, the decline in residential construction spending, while increasingly substantial, remains nowhere near the big decline it suffered before the end of 2007, in this series that only dates from 1993. Comparing it with single family permits (gold), and housing starts (violet) below:


confirms that residential construction spending is not yet a recession level decline. This is important, since as my long term forecast yesterday indicated, housing is an important such indicator, and as of now is one of the negative inputs.

Monday, January 31, 2022

My long leading forecast through the end of 2022


 - by New Deal democrat

My long leading forecast that goes 12 months out is now up at Seeking Alpha.

I am as nerdy as can be, and follow the same indicators over and over, no matter what their message. And their message has been changing over the past 6 months. To find out what that means for the latter half of this year, click on over and read the article.

As usual, this will equip you to see ahead for a year to come; and it will reward me a little bit for getting you that information so early.

Sunday, January 30, 2022

On the retirement of Justice Breyer: is this any way to run a country?


- by New Deal democrat


Long long ago I remember reading that Justices William Brennan and Thurgood Marshall, both about 70 years old at the time, decided not to retire during the Presidency of Jimmy Carter, because he was not liberal enough, preferring to wait for the next, more left-wing Democratic President. Heh!  

Liberals got lucky when, upon Brennan’s retirement in 1990, David Souter was named to replace him. They weren’t lucky when Marshall retired due to badly declining health in 1991 and was replaced by Clarence Thomas. Marshall died only 4 days after Bill Clinton became President; and Thomas, the first GOP Justice selected explicitly for his young age at the time (he was only 43 years old when confirmed to the Supreme Court) still sits upon the Court over 30 years later.

Of course, that same scenario played out less than two years ago when Justice Ruth Bader Ginsburg, having refused to retire during Obama’s Presidency (allegedly even after a direct appeal from Obama in 2013 when he correctly feared losing the Senate in 2014), died and was immediately replaced by the 48 year old Justice Amy Barrett.

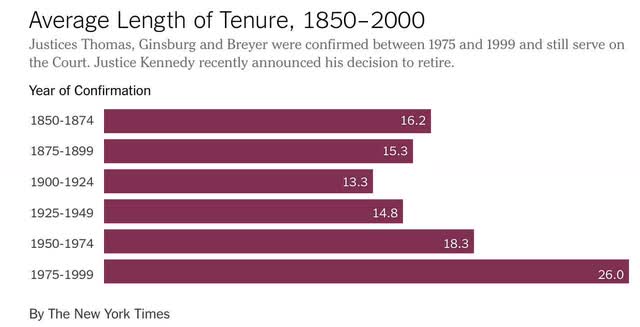
A few years ago I calculated  that, during the 19th Century, the median tenure for a Supreme Court Justice was 14 years. With immense gains in longevity during the late 20th Century, and the explicit practice of selecting young candidates in their 40s in order to maximize their partisan impact with lifetime appointments, since 1950 that median had increased to 20 years; and I calculated that by 2018, it would be 30 years.

The New York Times, writing two years after me, discussed the same phenomenon and included the following helpful graph:


Further, as I wrote several months ago, the anti-Federalist Brutus correctly predicted that Supreme Court Justices, once they realized that their power was almost completely unchecked under the Constitution, would enact their partisan preferences into Supreme Law. As we watch a radically reactionary majority on the Court systematically dismantle the 20th Century, there are deeper questions to be asked than just focusing on the current personnel. 

Namely, since the US Constitution enshrines judicial supremacy: is this any way to run a country? Why should the whims and egos of 9 individuals, deciding whether and when they want to retire, or whether they intend to serve until they drop dead, absolutely determine the rights and obligations of over 300 million people; and the fundamental structure of the government that shapes those rights and obligations?

Simply, had Brennan and Marshall retired during Jimmy Carter’s Presidency, or had Ginsburg resigned during Obama’s, the fundamental supreme law of the United States would be drastically different than it is now (and even more so than it is likely to be in a couple of years). Why on earth should that be the case? Why should the idiosyncrasies of a few philosopher kings and queens absolutely govern our lives?

Over the years my position on the Supreme Court has become more radicalized. It has changed from the need to convince elderly Justices like Breyer to retire, to the more fundamental position that we should not have to engage - sometime futilely, viz., Ginsburg - in this persuasion. 

Even if the size of the Court were expanded now, that would only cause the GOP to expand it further when they returned to power, leading to a further expansion by Democrats later, etc. For the good of the Republic, the very structure of the Court must be reformed.

First and foremost, that means term limits. With 9 Justices, one Justice’s position should expire every 2 years (essentially, an 18 year term). After serving on the Court, to fulfill a lifetime appointment, they should continue to serve as “Justices emeritus” on one of the regional Courts of Appeal.

Beyond that, there is the problem that the Court is not “overtly” a political branch. They are a bunch of lawyers who are not required to have any political sense. In other words, they can be utterly tin-eared. In 1857, believing that they were settling the slavery issue permanently, Chief Justice Roger Taney and a majority of the Court essentially ruled that slavery must be permitted everywhere. It was a decisive turning point igniting the fuse that led to the Civil War, and 700,000 deaths, less than 4 years later. When the Court overturns abortion rights a few months from now, I suspect the reaction by the clear majority of Americans who vehemently disagree will be on par with the reaction of the North to Dred Scott. Say what you will about politicians, they are sufficiently calculating that they collectively have a sense of how far they can go without provoking a violent counter-reaction. No such political sense restrains the Philosopher Kings and Queens on the Supreme Court.

When such tin-eared opinions are issued, there needs to be a mechanism to temper them without the need to have 2/3’s of both Houses of Congress and 3/4’s of all States approve first. For example, Canada’s Constitution has a “Notwithstanding” clause that permits provinces to overrule their Supreme Court. Allowing the Congress and the Presidency to stay a majority opinion of less than 2/3’s of the Court at least long enough for the next Congressional and Senate elections to determine whether or not to accept the ruling - or at least some similar check on the Court - is needed.