Saturday, October 30, 2021

Weekly Indicators for October 25 - 29 at Seeking Alpha


 - by New Deal democrat

My Weekly Indicators post is up at Seeking Alpha.

There are increasing signs that commodity prices are peaking, the latest candidate - but it may just be noise! - is the price of oil.

And if commodity prices are peaking, that gives us some important information that the supply chain bottleneck may be beginning to ease even if just slightly for now.

As usual, clicking over and reading will bring you nearly up to the moment on economic conditions, and will bring me my weekly grocery shopping money.

Friday, October 29, 2021

September personal income and spending: positive, but consumers’ “cushion” of pandemic assistance savings is now exhausted


 -by New Deal democrat

Real personal income and spending held up well throughout the pandemic, due to a vigorous government response. This morning these were reported for the first month after the expiration of the last such assistance. 

In nominal terms, personal income declined -1.0%, but spending rose 0.6%, and the previous month was revised upward by 0.2%.

In real terms, personal income (blue in the graph below) declined -1.4%, while real personal spending (red) rose 0.3%, both well above their immediate pre-pandemic levels:


Since May, while the trend for both has been close to flat, real spending is up 1.1%, while real income (with the expiration of emergency benefits) is down -1.2%.

Not only did consumers spend a lot of their pandemic assistance, but they also saved a lot. This provided a “cushion” in personal savings for many. As of last month, they appear to have gone through this cushion. The personal savings rate for September was 7.5%, below the 8.3% of February 2020 just before the pandemic hit, and about average for the 4 previous years, as shown in the graph below which subtracts -7.5% across the board:


This is also shown in the graph of total personal savings, which at $1,336 Billion, has also returned to the level it was just before the pandemic hit:


In other words, from here on in, people’s spending is going to be based upon “normal” factors, with no special stimulus to help them out.

Finally, real personal spending is basically the other side of the coin compared with real retail sales, since they cover the seller and buyer of consumer transactions, which is over 2/3’s of the entire economy. Here is a graph comparing the monthly %age change in each since July 2020:


Both of these have returned to basically normal levels m/m, as both increased 0.3% in September.

Last month I wrote that, “with the total expiration of emergency measures, the next few months will be much more challenging.” This only intensifies after this month’s report showed, as above, that consumer’s “cushion” has run out.

Thursday, October 28, 2021

Jobless claims: it’s Boom time for workers


 - by New Deal democrat

I’ll keep this morning’s update on jobless claims brief, because we have clearly moved past any pandemic weakness. 


Initial claims declined 10,000 this week to 281,000, and the 4 week average declined 20,750 to 299,250, both yet another new pandemic lows:


For the past 50 years, initial claims have only been below 300,000 during the peak of expansions and from late 2014 to just before the pandemic in 2020. For all intents and purposes, nobody is getting laid off.

Continuing claims also declined 237,000 to 2,243,000, also a new pandemic low. This number is only 243,000 above the cutoff line of 2,000,000 which has epitomized peak economic expansions in the past 50 years, as shown in the below graph which subtracts 2,000,000 from the reported numbers:


While some of this is probably due to the expiration of all emergency benefits, it also reflects the ability of those who want to get new jobs being able to find them without much difficulty.

Bottom line: it’s Boom times for workers. Not too shabby.

Wednesday, October 27, 2021

Coronavirus dashboard for October 27: whither the winter wave, and the trajectory of endemic COVID


 - by New Deal democrat

Well, we got some definite good news yesterday in the FDA approval of vaccines for children ages 5-11. Probably about 1/2 of the 8.5 million children in this age group will be vaccinated by the middle of winter.


In the meantime, here is an update on the current status. 

The Delta wave, which rolled in like a tsunami, continues to roll out like a tsunami as well. New cases are down almost 60% from their peak (at a still awful 67,000), while deaths, after some noise from data dumps, are down under 1500:


Since deaths follow cases with roughly a 3 week lag or so, the current decline in cases suggests a decline in deaths below 1000/day in about 3 weeks.

Here is what the trajectory of the Delta wave looks like regionally:


Note that the Northeast and Midwest peaked later than the South and West. Delta burned through the dry tinder particularly quickly in the South (where said dry tinder was easily available), but is consuming the dry tinder more slowly in the more heavily vaccinated portions of the country - but it is still so infectious that it is able to ignite said dry tinder).

Last year the winter wave began by October 1, as case counts of roughly 20,000 per day doubled to about 40,000 per day during the month. By contrast, this October cases have continued to decline and are now lower YoY.

But we *may* be beginning to see this year’s winter outbreak, as cases in the Mountain States plus South Dakota are on an uptrend again, after about a week where *no* States were in an uptrend:


This could be just noise at this point, but it bears watching.

Finally, over the weekend I wrote that I expected waves from here on in to decline by about 1/3 to 1/2 of each prior wave, due to an increased % of vaccinated people, plus and increased % of those previously infected.

As part of the FDA approval for children, we got a very useful update on seroprevalence, i.e., what % of the population has been infected, whether “confirmed” or not.  Via CNN, here is what Dr. Fiona Havers, a viral disease specialist with the CDC, said:

The seroprevalence of Covid-19 antibodies among children ages 5 to 11 appeared to increase from about 13% in November to December last year to 42% in May to June of this year, according to data that Havers presented to the VRBPAC members Tuesday.

"Investigators also use seroprevalence to estimate the cumulative number of infections and compare that with the number of reported cases by age. Overall, for the general population, the jurisdiction-level infections-to-case ratio had a median of 2.4, with a range of 2.0 to 3.9," Havers said. 

"For children, the infections-to-case ratio was substantially higher, with a median of 6.2 cases per every one infection, with a range of 4.7 to 8.9," Havers said. "These seroprevalence data suggest that infections in children are less likely to be reported compared with adults. But children are at least as likely as adults to be infected with SARS-CoV-2."


That is is an important reason why I think any winter wave will not be as bad as either Delta or last winter. Which is a way of introducing today’s final graph, showing those fully and partially vaccinated, plus the total # of infections:


As of today, 67% of the entire US population has received at least one shot, and 58% have been fully vaccinated. About 14% have had *confirmed* infections. If the real number of infections is 2.4x that %, that amounts to about 34% of the total population having been infected.

If we figure that infection + one shot is the equivalent of being fully vaccinated, and that infection on average gives resistance equivalent to one shot, then we get the following:

58% fully vaccinated
3% previous infection + one shot
Equals 61% essentially immune.

6% one shot but never infected
11% (1/3rd of the unvaccinated) previously infected
Equals 17% with some resistance

That leaves only 22% of the population as sitting ducks, right now.

This is going to improve not only due to vaccinations among those 5-11, but also employer and school mandates, and a slow creep of those begrudgingly getting their shots.

This is why I expect any winter wave this year to be only 1/2 to 2/3’s of the peak of the Delta wave, or last winter’s wave, and as more unvaccinated people get infected, as well as more people ever so slowly get vaccinated, those subsequent wave peaks are going to continue to decline in intensity going forward.

Tuesday, October 26, 2021

New home sales confirm upturn in housing, while FHFA and Case Shiller suggest increase in house prices is slowing


 - by New Deal democrat

This morning we got three reports on housing sales and prices. Let’s start with the sales data.

New home sales, while very noisy and heavily revised, tend to lead all of the other housing indicators, even permits. 


This morning’s m/m increase in new home sales (blue in the graph below) was good news. It was the second increase in a row, and at 800,000 was the highest since March. This suggests that single family permits (red, right scale) - which have continued to decline, but only slightly in the past several months - are likely to turn up shortly:


The number of houses for sale (which lags the number sold) was unchanged at 379,000, tied with last month for the highest level since October 2008 (gold in the graph below):


Increasing sales and increasing prices bring out increasing inventory, as home builders jump at the chance for increased profits.

Now let’s turn to house prices.

As shown below, both the FHFA and CaseShiller indexes have risen almost an identical 250% since January 1991, when the FHFA index began:


During that time, usually the FHFA index has decelerated, and made a peak or trough a month or two before the Case Shiller index (note for example, 1994, 2006, 2009, 2010, and 2013). 

With that in mind, here is the same data zoomed in on the last 4 years (again, note that the FHFA index turned slightly ahead of the Case Shiller index in 2018 and 2020):


The Case Shiller index shows no signs of decelerating, although at least it has stoppped *accelerating* on a YoY basis. But price gains in the FHFA index have decelerated at least slightly, from over 19% one month ago to 18.2%, the least YoY gain in the last 4 months. The 1.0% monthly gain is the smallest since June 2020. I’ve also added new home prices YoY (gold) from this morning’s new home sales report:


Last week I noted that median existing house prices as reported by Realtor.com had decelerated from a 23% YoY gain to 13%, likely indicating the peak in actual prices had either just happened or was imminent. Neither the FHFA nor Case Shiller indexes are confirming that, nor certainly have new home prices, but the *slowdown* in price increases indicates they are not too far behind.

Meanwhile sales, which lead prices, are likely to increase in response to recently lower mortgage rates, although the surge in prices will put a damper on just how much.

Monday, October 25, 2021

Q3 GDP will show economic contraction? 150+ years of short term interest rate history says no


 - by New Deal democrat

No economic news today, but let me show you one important reason I am not concerned about the supply chain or inflation issues at this point, despite some DOOOMMsaying about a likely punk GDP reading for Q3 that will be reported on Thursday.


There is no one foolproof indicator that always has indicated recession in advance. For example, as I have noted many times, the yield curve never inverted between 1932 and 1957, even though there were a number of recessions during that time.

But if inflation were such a bugaboo, why hasn’t the Fed raised rates? In the modern era, the Fed raising rates has always been a reason that the economy has slowed down. But let’s go further back. Because even before the Fed undertook a systematic raising/lowering interest rate regime, in fact even before there even *was* a Fed, there were commercial paper rates.

And short term commercial paper rates (basically short term commercial loans) almost always increased substantially before the economy tipped over into contraction - and indeed the increase in those rates was probably a factor in why the economy did so.

Here are short term commercial paper rates going all the way back to before the Civil War:


Note they always increased before every 19th or early 20th century recession.

Here are the same rates from the Great Depression through 1971:


The only cases where they did not rise appreciably were in 1938 and 1945. The former was a recession caused by a sudden contraction in fiscal spending. I’ll come back to the latter in a bit.

Here are the last 50 years:


Once again, we have appreciable increases, mirroring the increases in Fed short term rates, before every recession.

In summary, we have over 150 years of history telling us that, even if the central bank does not raise rates, commercial lenders will if they think they need to protect themselves, and that tightening of credit provision helps bring about a recession.

And there is *no* such tightening going on now.

Finally, let me come back to 1945, the one possible example that might be similar to our own situation. That was a recession brought about by the end of World War 2, and the sudden synchronous stoppage of war production in factories all over the US. It took time to convert back to civilian production!

So let’s overlay the quarter over quarter change in industrial production over commercial paper rates for that era:


In both 1938 and 1945 industrial production suddenly contracted by over 10% in one quarter alone.

Now here is the quarter over quarter change in industrial production over the past 5 years, including Q3 this year that just ended:


Industrial production *rose* 1.1% in Q3 compared with Q2.

There simply is no indication that either inflation or supply chain issues have caused an actual contraction in economic activity.

Sunday, October 24, 2021

My Big Picture


 - by New Deal democrat

It’s a Sunday, and it’s been a while since I put up some generalized thoughts on where we are, so let’s update. I’ll go in order of my optimism on the economy, COVID, and the political situation.
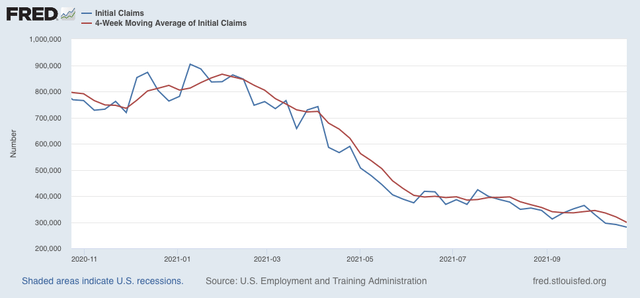
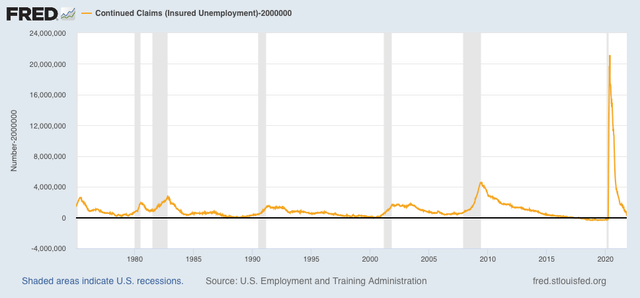

The economy

I am pretty happy about the place the economy is in right now, and for the near term future. Yes, we have inflation and supply chain issues, but we always have issues. And Q3 GDP will probably come in pretty punk on Thursday, but I’m just not concerned. Average hourly wages for non-managerial personnel are up 5.5% from one year ago. While inflation is going to pass, those wage gains are likely to prove “sticky.” For the first time since the late 1990s, labor is in a position of strength, and able to capture more of a share in the increase in economic activity. 

Here’s more:
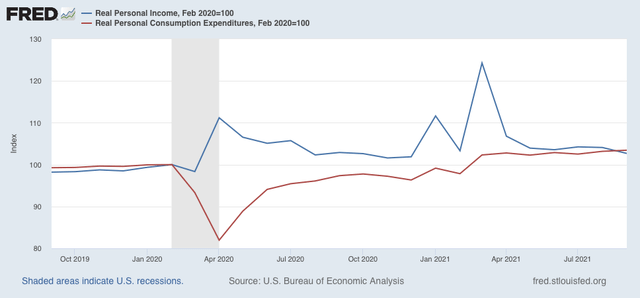
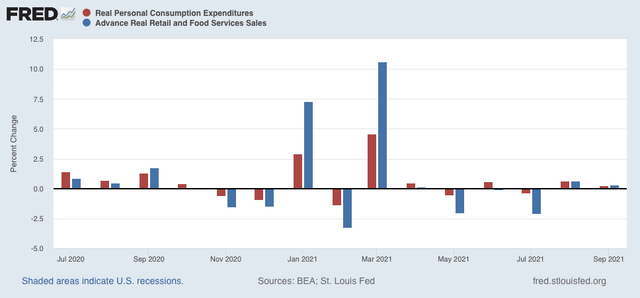
 - Even after adjusting for inflation, retail spending - although down from spring’s stimulus-fueled pace - is up 12.3% since just before the pandemic hit, and up 8.1% in the past 12 months. 
 - Real disposable personal income is up 3.4% since just before the pandemic, and slightly higher than 12 months ago. 
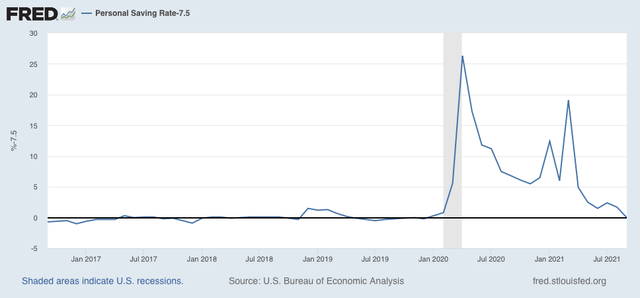
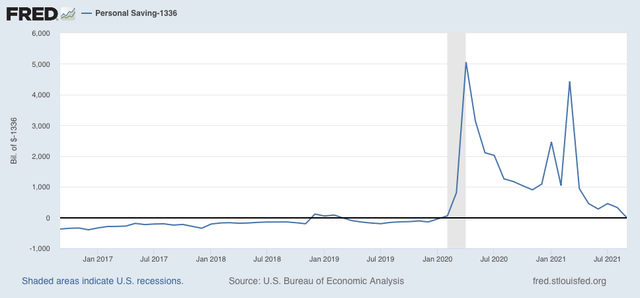
 - Personal savings are up 22.9% since just before the pandemic, although down from 12 months ago.

Basically, households spent most but not nearly all of their stimulus payments, and also maintained some of their savings from being cooped up at home due to COVID. And they’re being paid more at work.

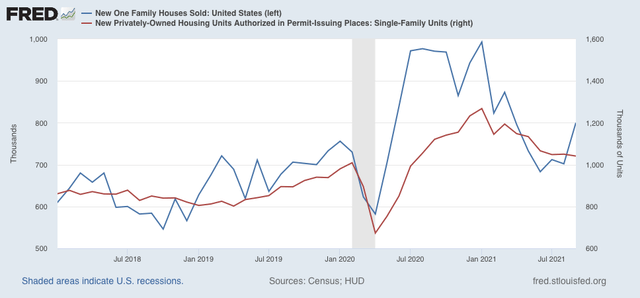
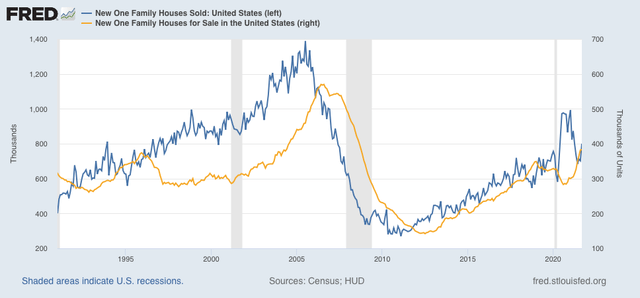
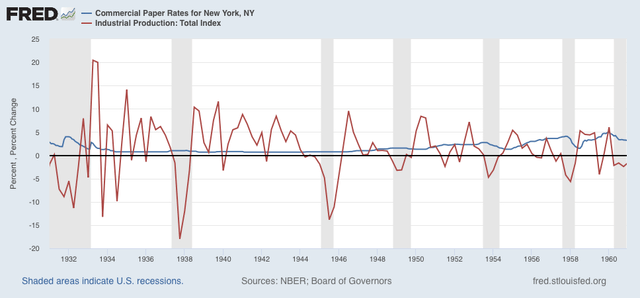
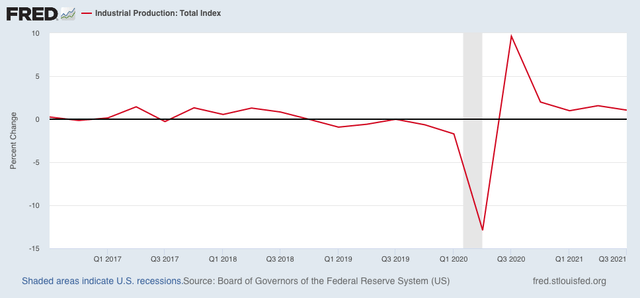
Producers are struggling to keep up with all of that new demand - that’s a big part of the supply chain issue - but forward looking data like factory new orders continue to show that production should continue to expand.

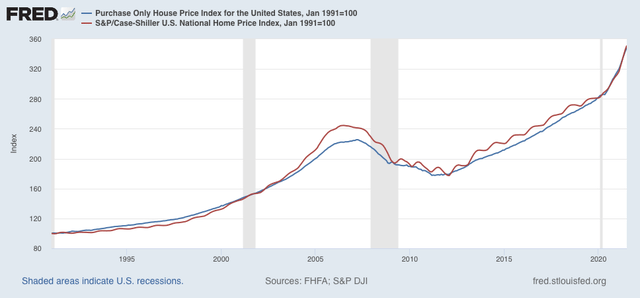
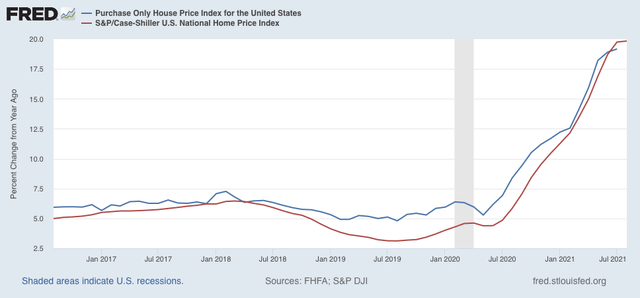
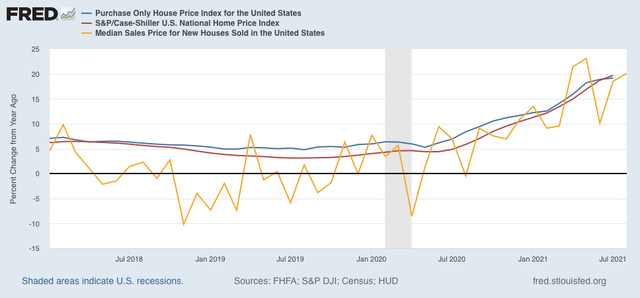
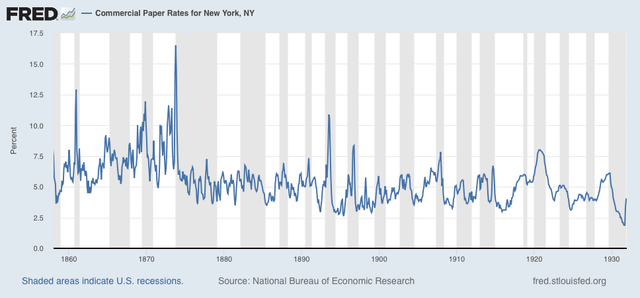
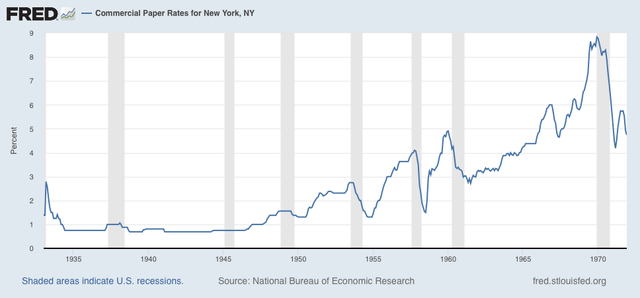
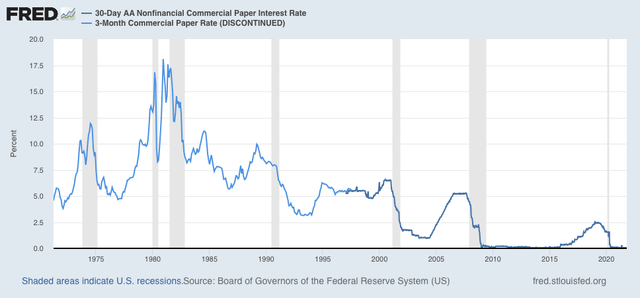
And the background financial conditions continue to show low interest rates, an open spigot for money supply, and also an open spigot for credit being granted.

Maybe sometime next year, the economy will hit a wall. But even one year out, very few indicators are showing signs of trouble. Color me optimistic.
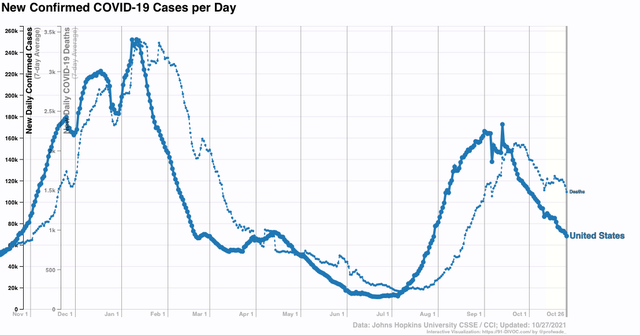
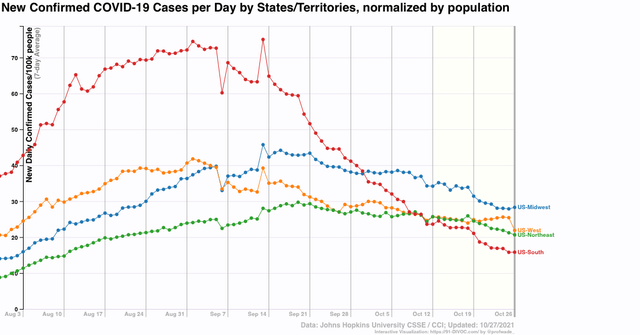
COVID

Here I am also at bottom optimistic, but much more cautiously. One thing I got wrong this year is that I expected vaccinations to continue at a 2 to 3 million per day pace, once they got available, and reluctant people saw that they really did protect the vaccinated. I did not realize the ferocity and power of the disingenuous political opposition that was originally orchestrated by Trump, but then escaped beyond even his control.

That is going to continue, but it is likely to be overcome by factors on the other side.

For example, even though lots of people over 65 are GOPers, the latest data from the CDC shows that 85% of seniors are fully vaccinated, and over 95% have had at least one shot. In other words, they may be telling pollsters that they’re against vaccines, but they quietly went out and got their shots anyway (because they know how vulnerable they are, and they don’t want to die).

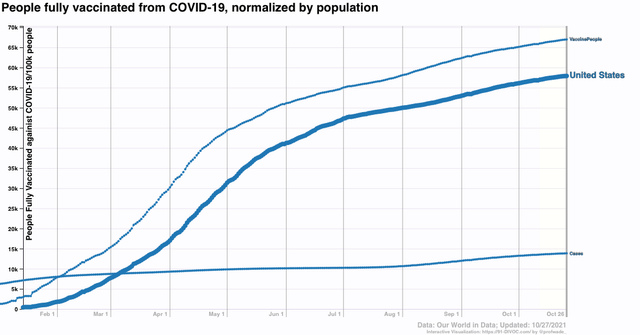
More broadly, almost 70% of all adults are fully vaccinated, and almost 80% have had one shot.

Right now 66% of the *entire* population has had at least one shot, and 57% are fully vaccinated. The percentage of people vaccinated may only be rising by about 0.1% a day, but it has, relentlessly, continued to rise. With the likely approval of vaccines for children ages 5 to 11 (who are about 8.5% of the population), we are going to see a further increase.

Even at 0.1% increase a day, by the end of this year (in two months), it’s likely that about 63% of the US population will be fully vaccinated, and 72% will have had one shot. By March of next year, those numbers will probably be at least 70% and 77%, respectively.

Add to that the fact that, on average, prior infection in the past 1.5 years is the equivalent of a single dose of vaccine, and that it is likely that a little over 2x the number of people have been infected as opposed to cases “confirmed” by tests, currently close to 14%, and probably about 30% of those not vaccinated have some resistance now, and that will probably be over 35% by spring.

In short, by the end of winter, between vaccinations and prior infections, there’s probably only going to be about 15% of the entire population that does not have some resistance. A coronavirus looking to infect its next victim is going to have a 3/4 chance of encountering someone virtually immune, and another 10% chance of encountering someone with some resistance. Not terribly good prospects for wide continuing spread. 

Furthermore, I anticipate more and more vaccine mandates from the federal, State, and local governments, as well as by employers. School mandates are going to be enormously helpful where enacted. I think it is only a matter of time before we get interstate public transport mandates. Finally, entire “Blue” regions like the Northeast may finally impose quarantines with teeth on travelers from places like Florida and Texas. Too bad for them; they should get vaccinated.

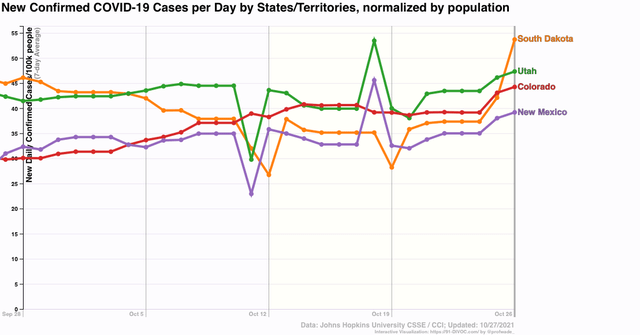
My base case right now is that we do get a winter wave, but it peaks at only about 1/2 to 2/3’s of the cases and deaths of the summer Delta wave. The next wave after that will be about 1/2 to 2/3’s of that wave, and so on. That’s what COVID turning endemic is likely to look like. By the end of next year, I anticipate it really will be “just like the flu” in terms of both infections and deaths.
  
The US political system

Finally, we get to the issue where I am pessimistic - but really, it is just watching what I figured out shortly after Election Day last year coming to fruition.

The President does not decree legislation. It must be passed by the Congress. And Congress has been completely non-functional ever since 2011, except on those things that are allowed to pass with a bare majority of the Senate (tax cuts and judges). This is a blueprint for continued GOP control. Everything they want they can pass with a bare majority, in a chamber weighted towards rural States to begin with. Everything Democrats want requires 60 votes, and they will never get them. A 50/50 Senate means that even 1 dissenter completely destroys any Democratic agenda item.

And here we are. Maybe some scaled down version of Biden’s economic program finally gets enacted. But the scaled down version isn’t going to be nearly enough.

And the situation with regard to voting rights in particular, and democratic integrity in general, is much more dire. 

It’s pretty clear that the filibuster in the Senate is not going to be lifted for voting rights legislation, nor for legislation (that is *clearly* within Congress’s power, as to Congressional elections) dealing with gerrymandering. And Merrick Garland (who, presumably, is following Biden’s wishes) appears to be “looking forward, not back,” thus ensuring that there are no consequences even for an attempted violent overthrow of the 2020 Presidential election, and further ensuring that much more organized attempts will follow, probably successfully.

Meanwhile the Supreme Court is revving up to repeal the entire 20th Century, both as to civil rights and economic regulation. 

About the only silver lining I see there is that, whether Roe v. Wade technically survives or not, it is really clear that abortions are going to be permitted to be outlawed by the States (and I don’t even put it past the Court to declare that the fetus is a “person” and that abortions *must* be prohibited). That will be the first time in the entire history of the US that a personal right that people thought they had - for the last 50 years - is taken away. 

And one thing we know from behavioral economics specifically, and behavioral psychology generally, is that people react *much* more strongly to things that are taken away from them than things that they didn’t have to begin with. I expect a complete firestorm of rage when this happens, and it may very well lead to 2022 midterm election results that defy the usual trend, with a Blue avalanche giving Biden and the Democrats a much better chance to enact a real agenda, up to and including voting rights and Supreme Court reform.

But in the longer term, the Rule of Law in the US is going to end shortly, I suspect. Some day long after that, a new Constitution not encumbered with creaky 18th Century kludges will finally come into existence, long after I am gone.