- by New Deal democrat
I hope all of you had a Happy Thanksgiving. Since I haven’t posted one in a bit, here is an update on the pandemic.
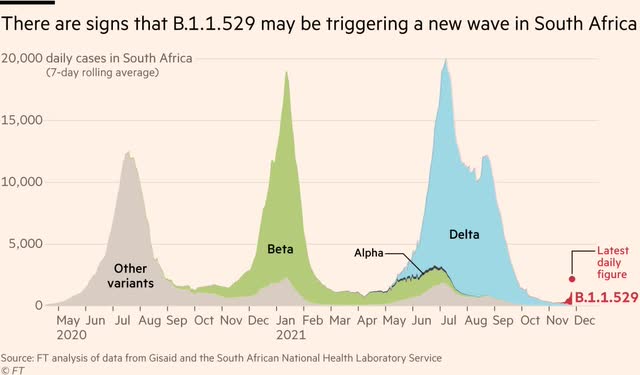
As an initial matter, in the last day or two there has been a mini-panic about a new strain out of South Africa called B.1.1.529 which may or may not get the designation Nu.
While this *may* be a concern, I wouldn’t worry just yet. Here’s a link to an excellent thread from Carl Bergstrom, a bio-statistician who is one of my go-to expert reads.
He writes that “*If* the turn-around is due to increased transmissibility, instead of other e.g. behavior factors, it's going to a rough winter,” but that while “the fraction of B.1.1.529 is increasing faster[, ] I think that is that is largely due to different denominators.”
Bottom line: worth watching, but the rate of increase is based on a *very* low number of cases - perhaps less than 1,000 cases so far, as shown in the below graph also posted by Bergstrom:
The question of the season is how much of a winter wave the US will have. A number of writers have posited that the US is going to have a very bad outbreak just like the EU has had in the last month or so.
That’s certainly possible. If the US *were* to have a winter wave comparable to that of the EU, that would be at least a 5-fold increase from our recent low of 80,000 cases per day to over 400,000 per day.
But I’m not so sure, mainly because unlike Europe, the US has had a recent very bad Delta wave that Europe mainly escaped. Since the UK did not escape Delta this summer (and has all but eliminated all its restrictions) it’s worthwhile to compare the two jurisdictions:
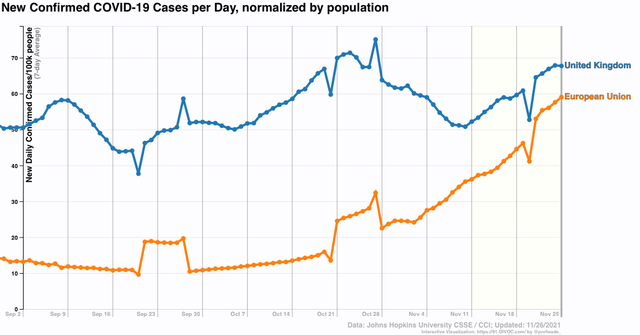
Cases in the UK have risen from about 50 to 68 per 100,000 in the past 45 days or so, while cases in the EU have risen from 10 to 60 per 100,000. While it would be wrong to simply project these trends forward, at least *so far* we can say that the UK has not had a wave anything like the EU (nor, for that matter, has Canada, with 75% of its population fully vaccinated, where cases have only risen from 5 to 7 cases per 100,000; or Israel, where cases in the past two months have dropped from over 100 to only 4 per 100,000 with 65% of its population fully vaccinated but a very aggressive booster shot campaign.
A look at the US by Census region since the beginning of the pandemic is very helpful in tracking climate effects as they affect patterns of infections, because it appears that a pattern has emerged:
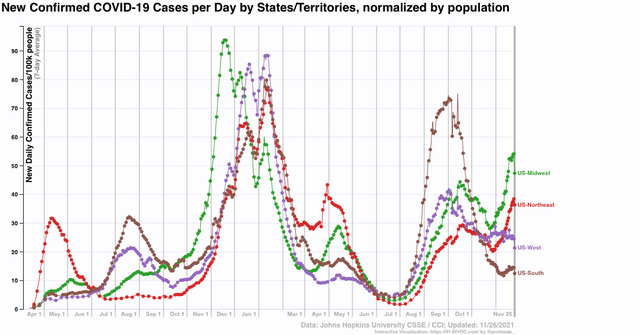
Leaving aside the initial NYC-centered outbreak, where testing was very poor, we see that in both 2020 and 2021 the summer outbreaks started and were most intense in the South, then spread to the West, then the Northeast and finally the Midwest; and that the summer outbreaks were least intense in those last two regions.
By contrast, in both autumn going into winter 2020 and 2021, the outbreaks first started in the Midwest, then the Northeast, before spreading to the West and the South. Again, in the last two Census regions, in 2020 the outbreaks were the least intense - and the same is true this year *so far.*
Also, focusing on autumn 2020, the region which peaked first was the Midwest, right around Thanksgiving week. It is noteworthy that the Midwest outbreak last year was apparently seeded during the August motorcycle rally in South Dakota, and spread out from there, with the Dakotas being particularly hard hit. This year there was another rally, but as the below graph of the two Dakotas shows, infections hit peak in South Dakota in early September and have declined since:
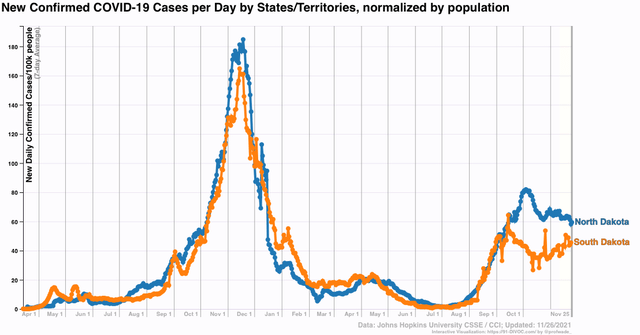
This is certainly evidence that prior infections - and both Dakotas have had *confirmed* infections of over 18% and 20%, and probably double or more that in reality - appear to have a dampening effect on subsequent ones, even of Delta.
So, will the same pattern continue this autumn and winter, with the Midwest peaking now and other regions peaking two weeks after Christmas gatherings? A close-up of the 4 Census regions through Thanksgiving Day (so please ignore the last daily data entry, because it has everything to do with most States not bothering to report on the holiday) appears to suggest that this may be the case:
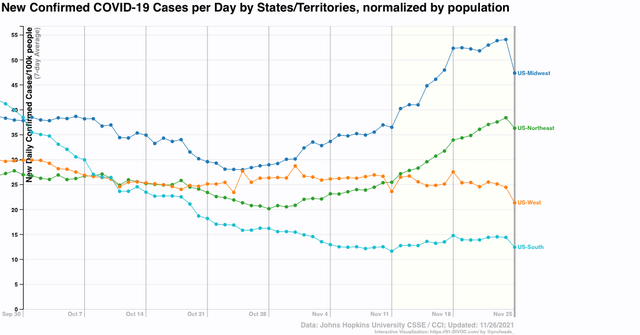
Most notably, there has been no increase in the Midwest since one week ago. There has only been a slight increase in the South in the past 45 days, and none in the West. This is *very* different from last year’s huge increases in all regions during November.
A look at the change in the one week average in cases nationwide for the past 13 months shows that the 7 day average in cases was increasing by almost 2 per 100,000 last November. By contrast, this year cases have increased on average only 0.5 cases per 100,000 per day:
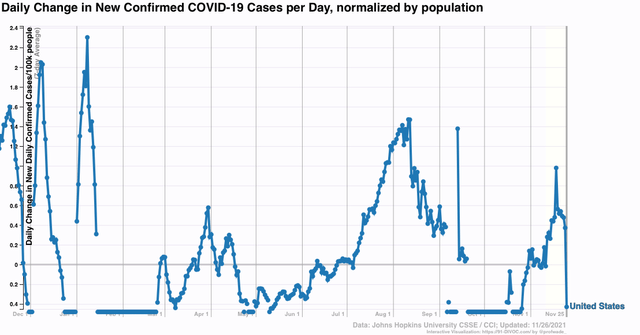
Last winter cases only increased roughly another 25% between Thanksgiving and the early January peak. If that pattern were to repeat this year, this would take us to a peak of about 45 per 100,000, or about 120,000 cases per day - only half of the 250,000 per day at the peak last winter. That’s the optimistic scenario.
Since a 120,000 winter peak is, needless to say, much more preferable than a 500,000 peak, let’s hope that the US’s summer Delta wave does blunt infections during the winter, and the optimistic scenario is the one that pans out.