Saturday, April 4, 2020
Weekly Indicators for March 30 - April 3 at Seeking Alpha
- by New Deal democrat
My Weekly Indicators post is up at Seeking Alpha.
This was the week when the bottom finally fell out of almost all the remaining data.
Clicking over and reading will bring you up to the virtual moment on the economy, and reward me a little bit for the effort I put into this endeavor, especially now that I am devoting most of my time to the likely impacts of the coronavirus.
Coronavirus dashboard for April 4: with lockdowns in place, testing still far behind, no action on necessary “test, track, quarantine” plan
- by New Deal democrat
Here is the update through yesterday (April 3)
I’ve changed the format, moving the “just the facts, ma’am” data to the top, and comments at the end.
The four most important metrics are starred (***) below.
Number and rate of increase of Reported Infections (from Johns Hopkins via arcgis.com)
- Number: up +32,857 to 278,458 (vs. +28,879 on April 2)
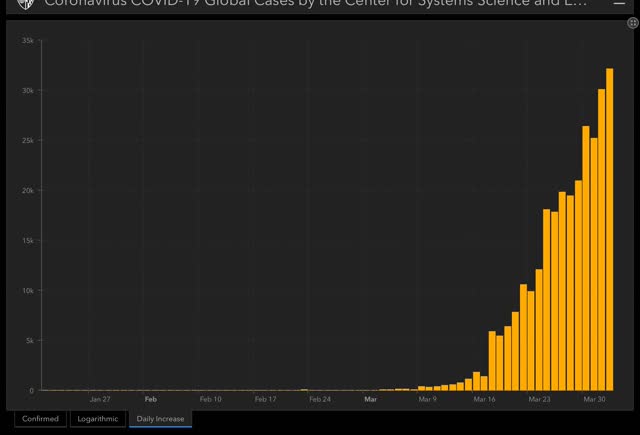
- ***Rate of increase: day/day: 13% (vs. 34.6% baseline, 15% for the past week, and 13% on April 2)
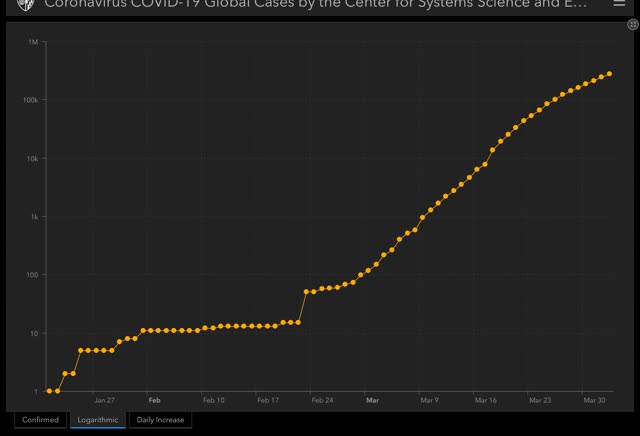
The exponential growth rate began to fall on March 24, but has not made meaningful progress in 6 days. Also, since testing has fallen further behind, some of the rate of growth may be hidden. Voluntary social distancing failed; we don’t yet know how well the State lockdowns are working.
Ben Engebreth is tracking coronvirus infection and testing numbers for each State, with graphs, here.
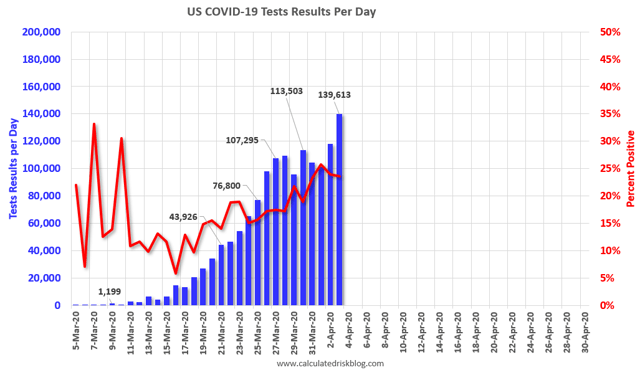
Number of deaths and infections and rate of increase of testing (from COVID Tracking Project)
- ***Number of deaths: Total 5,784, up +1,084 day/day
- Rate: increase of 9% day/day vs. average of 22% in past week
- Number of tests: 139,613, up +21,915 vs. 117,698 on April 1 day/day
- Rate: increase of +19% vs. number of tests previous day
Comparison of rates of increase in documented infections vs. testing
- Infections +9% vs. Tests +19% day/day
Result: The rate of testing had been failing to improve up until the past two days, meaning that we were actually falling further behind. Now we are catching up a little bit. Nevertheless, it remains far below what is needed, which is probably now at least 250,000/day. Note this target number is also increasing exponentially as we try to chase the number of exponentially increasing infections.
Ratio of tests to positives for infection (from COVID Tracking Project)
- Number: 139,613 new tests vs. 32,906 new diagnosed infections
- ***Ratio: 4.3:1
In South Korea, where aggressive testing has led to a near-total disappearance of new cases, the inflection point where the number of new daily cases plateaued was reached when the ratio of tests to new cases found reached 15:1. Any ratio less than that suggests that not enough testing is being done. Yesterday’s ratio of 4.3:1 continues to show that testing is falling further behind the level of new infections.
US States and population in total lockdown, business lockdown, and partial restrictions
- ***Total lockdown: 42 States (AL, MO joined in last 24 hours), 301.6 million, 90.9%
- ***Business lockdown: 3 States (KY, MA, SC*) 16.6 million, 5.0%
- Partial restrictions on business (bars, restaurants): 5 States (IA, ND, NE, UT*, WY) 9.7 million, 2.9%
- School closure only: 2 States (AR, SD) 3.9 million, 1.2%
- No mandatory restrictions: NONE
*some local areas under lockdowns
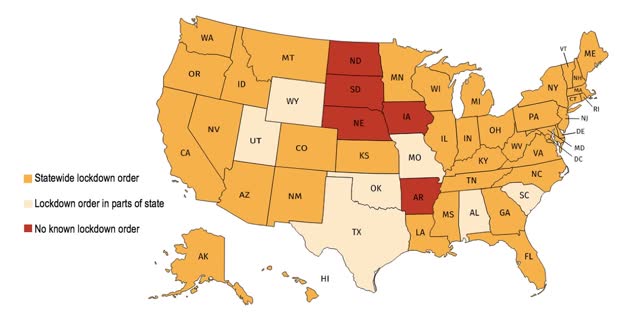
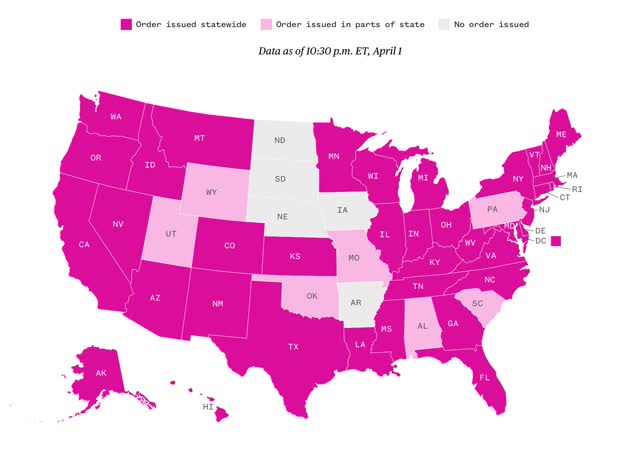
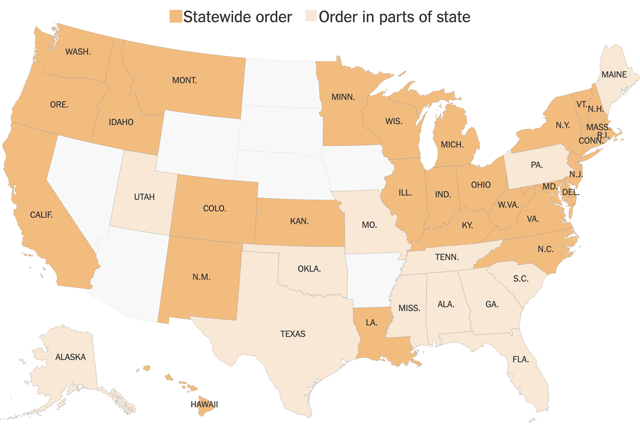
Here is The NY Times most recent graph (Nebraska has since closed some businesses)
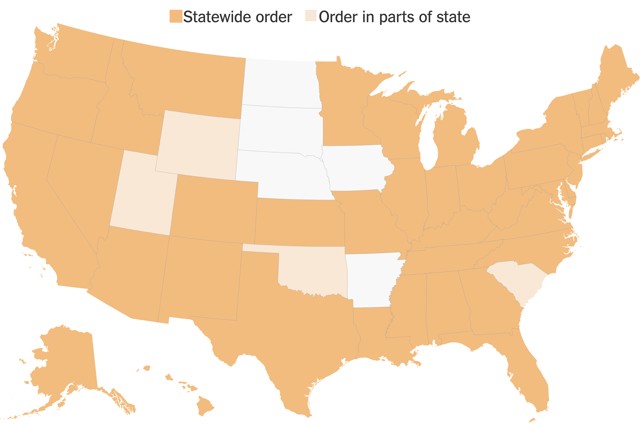
Following Trump’s reversal on Easter Sunday openings, almost all of the holdout States in Dixie have implemented lockdowns. About 95% of the US population is now under stay at home orders.
Summary for April 4
Almost every public health authority who has weighed in has advocated the “Sledgehammer, then Scalpel” approach of a temporary total lockdown, during which time, as the infection rate of growth hopefully moves to flat, the production and distribution of necessary medical equipment is surged. Once enough is in place, a regimen of “test, trace, and quarantine” can be put in place as the lockdown is lifted.
Here’s how we stand:
- Almost 95% of the total US population is - finally - under total lockdown, with only a few States in the Great Plains, plus Arkansas, Utah, and Wyoming holding out.
- While “Social distancing” and lockdowns appear to have lowered the growth rate of new infections, they have failed as a method to halt the virus’s spread.
- The effect of mandatory lockdowns, first implemented on Statewide bases 15 days ago, is only beginning to be felt.
- Travelers from States that resisted lockdowns until this week (especially Florida!) have probably re-seeded new outbreaks in those that went to lockdowns early.
- The number of daily tests has finally improved from about 100,000 to 140,000, but is still probably only half of what is necessary. “Pending” tests of 61,980 are far, far too high.
- So long as the virus keeps spreading at an exponential rate, even a lower one, we are falling further and further behind, I.e., we are failing to catch more new infections. The longer this continues, the longer it will be until total lockdowns can be lifted.
- The Trump Administration has still not mandated a nationwide lockdown.
- The Trump Administration has taken no meaningful steps to mandate mass production of necessary medical equipment.
- The Trump Administration has taken no steps towards a nationwide “test, track, and quarantine” plan that will be needed to lift lockdowns.
- The first State I am aware of - Massachusetts - has begun to develop its own “test, trace, and quarantine” plan. Hopefully this will be adopted by other States quickly.
Friday, April 3, 2020
Coronavirus dashboard for April 2: voluntary social distancing failed
- by New Deal democrat
Here is the update through yesterday (April 2)
Almost 95% of the US population is now under lockdown. It appears that measures to date have lowered the rate of exponential growth of new infections, but the voluntary social distancing that was in effect until the first Statewide lockdowns started 2 weeks ago have failed to end that growth.
But testing in the past 6 days has plateaued (not good) and is not keeping pace at all with the growth in new infections. We will not be able to transition from the Sledgehammer of lockdowns to the scalpel of aggressive testing and quarantines until this changes. Deaths continue to climb at a steady exponential rate consistent with infections 2 weeks ago.
To transition to a South Korea style program, we also need to be able to trace infections and quarantine those newly infected. For that we need millions of thermometers, masks, and other equipment. There is no indication at all that this is happening, particularly at the Federal level.
The four most important metrics are starred (***) below.
Number and rate of increase of Reported Infections (from Johns Hopkins via arcgis.com)
- Number: up +28,879 to 245,601 (vs. +27,089 on April 1)
- ***Rate of increase: day/day: 13% (vs. 34.6% baseline, 16% for the past week, and 14% on April 1)
The exponential rate of growth has begun to slow. The important caveat is that, since testing has fallen further behind, some of the rate of growth may be hidden.
Ben Engebreth is started tracking coronvirus infection and testing numbers for each state, with graphs, here.
Number of deaths and infections and rate of increase of testing (from COVID Tracking Project)
- ***Number of deaths: Total 5,784, up +1,084 day/day
- Rate: increase of 23% day/day vs. average of 25% in past week
- Number of tests: 117,698, up +16,709 vs. 100,989 on April 1 day/day
- Rate: increase of +17% vs. number of tests previous day
Comparison of rates of increase in documented infections vs. testing
- Infections +13% vs. Tests +17% day/day
Result: The rate of testing has been failing to improve (until today) and remains far, far below what is needed, which is probably now at least 250,000/day. Note this target number is also increasing exponentially as we try to chase the number of exponentially increasing infections.
Ratio of tests to positives for infection (from COVID Tracking Project)
- Number: 117,698 new tests vs. 28,239 new diagnosed infections
- ***Ratio: 4.2:1
In South Korea, where aggressive testing has led to a near-total disappearance of new cases, the inflection point where the number of new daily cases plateaued was reached when the ratio of tests to new cases found reached 15:1. Any ratio less than that suggests that not enough testing is being done. Yesterday’s ratio of 4.2:1 continues to show that testing is falling further and further behind the level of new infections.
US States and population in total lockdown, business lockdown, and partial restrictions
- ***Total lockdown: 35 States (NV, PA, & TN joined in last 24 hours), 309.4 million, 93.2%
- ***Business lockdown: 3 States (KY, MA, SC*) 16.6 million, 5.0%
- Partial restrictions on business (bars, restaurants): 6 States (AL, IA, MO*, ND, UT*, WY) 18.8 million, 5.7%
- School closure only: 2 States (AR, SD) 3.9 million, 1.2%
- No mandatory restrictions: 1 State (NE) 1.9 million, 0.6%
*some local areas under lockdowns
Following Trump’s reversal on Easter Sunday openings, almost all of the holdout States in Dixie have implemented lockdowns. Almost 95% of the US population is now under stay at home orders.
Summary for April 3
- Almost 95% of the total US population is under total lockdown.
- While “Social distancing” and lockdowns appear to have lowered the growth rate of new infections, they have failed as a method to halt the virus’s spread
- Travelers from States that resisted lockdowns until this week have probably re-seeded new outbreaks in those that went to lockdowns early.
- The number of daily tests has stalled at about 100,000 (yesterday’s high water mark was still less than 120,000)
- So long as the virus keeps spreading at an exponential rate, even a lower one, we are falling further and further behind, I.e., we are failing to catch more new infections. The longer this continues, the longer it will be until total lockdowns can be lifted - because we don’t have the wherewithal to go to a “South Korea” style regimen of pervasive testing and quarantines.
- The Trump Administration is continuing and will continue to fail. It is up to the States to band together to fill the void.
March jobs report: the leading edge of the catastrophe
- by New Deal democrat
HEADLINES:
- -701,000 jobs lost
- U3 unemployment rate up 0.9% to 4.4%
- U6 underemployment rate rose 1.7% to 8.7%
- January was revised downward, while February was revised slightly upward, but the net was a decline of -57,000 jobs from previous reports.
Leading employment indicators of a slowdown or recession
I am still highlighting these because of their leading nature for the economy overall. With one exception, these were negative to strongly negative:
- the average manufacturing workweek fell -0.3 hours to 40.4 hours. This is one of the 10 components of the LEI and will be a big negative.
- Manufacturing jobs fell by -18,000. Manufacturing nevertheless gained 12,000 jobs in the past 12 months.
- Coal: in 2016, Trump specifically campaigned on bringing back mining jobs. But they declined by -600, and an average of -200 jobs/month in the past year vs. the last seven years of Obama's presidency in which an average of -300 jobs were lost each month.
- construction jobs fell by -29,000. In the past 12 months construction jobs still gained 162,000.
- Residential construction jobs, which are even more leading, rose by 2200.
- temporary jobs declined by -49,500.
- the number of people unemployed for 5 weeks or less rose by 1,529,000 from 2,013,000 to 3,542,000. Just last month was a new expansion low.
Wages of non-managerial workers
Here are wages in the past year:
Here are wages in the past year:
- Average Hourly Earnings for Production and Nonsupervisory Personnel: rose $.10 from $23.97 to $24.07, and is up +3.4% YoY. This is a deceleration from last fall.
Aggregate hours and wages:
- the index of aggregate hours worked for non-managerial workers fell by -1.8%
- the index of aggregate payrolls for non-managerial workers fell by -1.4%
SUMMARY
This report was generated from data during the week of March 13, when layoffs due to coronavirus were just starting. As a result, not only is it likely that the April report will show a loss in excess of 1,000,000 jobs, it might show a loss in excess of -10,000,000 jobs.
All of the leading components but one were down, most of them sharply. Only residential construction remained positive as a reminder of what might have been in store for the rest of the year absent coronavirus.
The huge loss in payrolls will not be compensated for by $1200 checks. A big concern going forward will be to watch for any signs of actual wage cuts. Remember that wage deflation was the driver of the vicious 1929-32 cycle.
If there were competent Executive leadership in Washington, a one month downturn like this, with hope on the horizon, might be excused. But it is probably only a foretaste of what is in store. This an incipient economic catastrophe, and I expect that it will have an enormous impact on the November elections.
Thursday, April 2, 2020
Why the States must surge medical supplies, explained in two easy points
- by New Deal democrat
Point 1:
The most recent “plan” of the Trump Administration is to extend the lockdown through the end of April. It is based on the below graph from a foundation endowed by Bill and Melinda Gates:
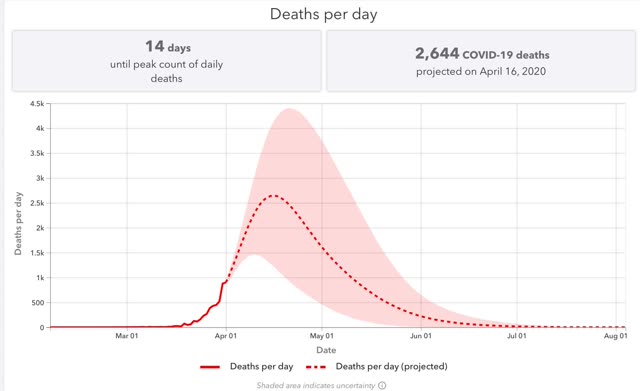
The graph anticipates roughly 100,000 deaths during April and May, peaking in mid-April at about 2500 deaths per day.
But it also presumes that the lockdown remains in place indefinitely, or at very least that a South Korea-style monitoring system is in place by the time the lockdown is released.
Point 2:
From Senator Chris Murphy:
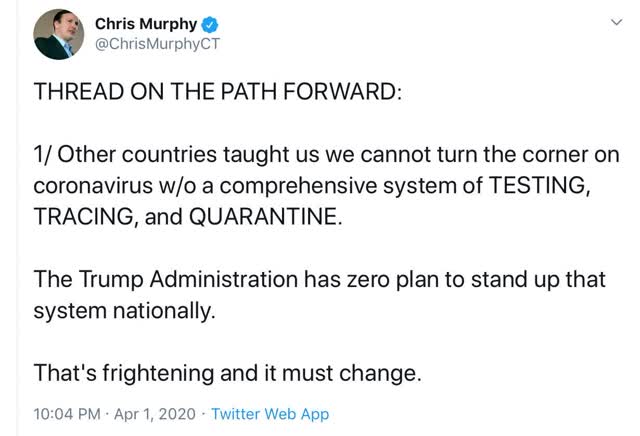
But Trump has no such plan in place, and is not taking any steps to put such a plan in place. He is expecting that the benefits will magically take place anyway.
Which means, since Trump will *never* undertake the necessary actions, either:
1. The lockdown is going to have to remain in place indefinitely, until there is an adequate treatment or vaccine;
Or
2. The States go around Trump and his Administration, and put the system in place, including a supply of the necessary medical equipment such as thermometers and testing, in coordination on their own.
The situation is both that appalling, and that simple.
Coronavirus dashboard for April 2: nationwide lockdown nearly complete, but the surge in testing has completely stalled
- by New Deal democrat
Here is the update through yesterday (April 1)
Close to 90% of the US population is now under lockdown, and it appears to be lowering the rate of exponential growth of new infections.
But testing in the past 6 days has plateaued at about 100,000/day and is not keeping pace at all with the growth in new infections. We will not be able to transition from the Sledgehammer of lockdowns to the scalpel of aggressive testing and quarantines until this changes. Deaths continue to climb at a steady exponential rate consistent with infections 2 weeks ago.
To transition to a South Korea style program, we also need to be able to trace infections and quarantine those newly infected. For that we need millions of thermometers, masks, and other equipment. There is no indication at all that this is happening.
The four most important metrics are starred (***) below.
Number and rate of increase of Reported Infections (from Johns Hopkins via arcgis.com)
- Number: up +27,089 to 216,722 (vs. +25,023 on March 31)
- ***Rate of increase: day/day: 14% (vs. 34.6% baseline, 18% for the past week, and 15% on March 31)
The exponential rate of growth in US cases has begun to slow:
Ben Engebreth is started tracking coronvirus infection and testing numbers for each state, with graphs, here.
Number of deaths and infections and rate of increase of testing (from COVID Tracking Project)
- ***Number of deaths: Total 4700, up +954 day/day
- Rate: increase of 25% day/day vs. average of 26% in past week
- Number of tests: 100,989 down -3,128 vs. 104,117 on March 31 day/day
- Rate: decrease of -3.0% vs. number of tests previous day
Comparison of rates of increase in documented infections vs. testing
- Infections +14% vs. Tests -3% day/day
Result: The rate of testing has been failing to improve (until today) and remains far, far below what is needed, which is probably now at least 250,000/day. Note this target number is also increasing exponentially as we try to chase the number of exponentially increasing infections.
Ratio of tests to positives for infection (from COVID Tracking Project)
- Number: 100,989 new tests vs. 26,000 new diagnosed infections
- ***Ratio: 3.9:1
In South Korea, where aggressive testing has led to a near-total disappearance of new cases, the inflection point where the number of new daily cases plateaued was reached when the ratio of tests to new cases found reached 15:1. Any ratio less than that suggests that not enough testing is being done. Yesterday’s ratio of 3.9:1 continues to show that testing is falling further and further behind the level of new infections:
US States (+DC and PR) and population in total lockdown, business lockdown, and partial restrictions
- ***Total lockdown: 37 States (FL, GA, MS, OK^^ joined in last 24 hours), 268.0 million, 80.8%
- ***Business lockdown: 6 States (KY, MA, NV, PA*, SC*, TN*) 39.2 million, 11.8%
- Partial restrictions on business (bars, restaurants): 6 States (AL, IA, MO*, ND, UT*, WY) 18.8 million, 5.7%
- School closure only: 2 States (AR, SD) 3.9 million, 1.2%
- No mandatory restrictions: 1 State (NE) 1.9 million, 0.6%
*some local areas under lockdowns
^restrictions on entry into State from some other States
^^high risk populations only
Following Trump’s reversal on Easter Sunday openings, almost all of the holdout States in Dixie have implemented lockdowns. Nearly 90% of the US population is now under stay at home orders:
Summary for April 2
- Almost 90% of the total US population is under total lockdown.
- “Social distancing” and lockdowns appear to have lowered the growth rate of new infections.
- But travelers from States that resisted lockdowns will re-seed new outbreaks in those that went to lockdowns early
- The number of daily tests has stalled at about 100,000. So long as the virus keeps spreading at an exponential rate, even a lower one, we are falling further and further behind, I.e., we are failing to catch more new infections. The longer this continues, the longer it will be until total lockdowns can be lifted - because we don’t have the wherewithal to go to a “South Korea” style regimen of pervasive testing and quarantines.
- Since the Trump Administration will continue to fail, it is up to the States to band together to order emergency production of masks, tests, thermometers and other necessary equipment in order to transition to a South Korea type of testing, tracing, and quarantining of new cases.
Wednesday, April 1, 2020
Coronavirus dashboard for April 1
- by New Deal democrat
Here is the update through yesterday (March 31)
Over 75% of the US population is now under lockdown, and it appears to be lowering the rate of exponential growth of new infections.
Based on South Korea’s experience, a ratio of 15:1 in total tests to results showing infection is the level where there can be some confidence that the infections have been contained. But testing in the past 5 days has plateaued (not good) and is not keeping pace at all with the growth in new infections. We will not be able to transition from the Sledgehammer of lockdowns to the scalpel of aggressive testing and quarantines until this changes.
The above three most important metrics are starred (***) below.
Number and rate of increase of Reported Infections (from Johns Hopkins via arcgis.com)
- Number: up +25,023 to 189,633 (vs. +21,555 on March 30)
- ***Rate of increase: day/day: 15% (vs. 34.6% baseline, 19% for the past week, and 15% on March 30)
This looks like confirmation that the exponential rate of growth is beginning to slow.
Also, Ben Engebreth is started tracking coronvirus infection and testing numbers for each state, with graphs, here.
Number and rate of increase in deaths and testing (from COVID Tracking Project)
- Number of deaths: Total 3946, up +807 day/day
- Rate: increase of 27% day/day vs. average of 24% in past week
- Number of infections: 104,117 down -9,386 vs. 113,503 on March 30 day/day
- Rate: decrease of -8.3% vs. number of tests previous day
Comparison of rates of increase in documented infections vs. testing
- Infections +15% vs. Tests -8.3% day/day
Result: The rate of testing has been failing to improve (until today) and remains far, far below what is needed, which is probably now at least 250,000/day. Note this target number is also increasing exponentially as we try to chase the number of exponentially increasing infections.
Ratio of tests to positives for infection (from COVID Tracking Project)
- Number: 113,503 new tests vs. 24,240 new diagnosed infections
- ***Ratio: 4.3:1
In South Korea, where aggressive testing has led to a near-total disappearance of new cases, the inflection point where the number of new daily cases plateaued was reached when the ratio of tests to new cases found reached 15:1. Any ratio less than that suggests that not enough testing is being done. Yesterday’s ratio of 4.3:1 continues to show that testing is falling further and further behind the level of new infections.
Number of States (+DC and Puerto Rico) in total lockdown, business lockdown, and partial restrictions
- Total lockdown (personal + business): 33 (AK, AZ, CA, CO, CT, DC, DE, HI, ID, IL, IN, KS, LA, MD, ME, MN, MI, MT, NC, NH, NM, NJ, NY, OH, OR, PR, RI, TX^, VA, VT, WA, WI, WV)
- Business lockdown: 6 (KY, MA, NV, PA*, SC*, TN*)
- Partial restrictions on business (restaurants and bars): 9 (AL, FL*^, GA*, IA, MO*, MS, ND, UT*, WY)
- School closure only: 3 (AR, OK**, SD)
- No mandatory restrictions: 1 (NE*)
*some local areas are under lockdowns
**some local areas with partial restrictions
^restrictions on entry into State from some other affected States
Number and percent of US population in total lockdown, business lockdown, and partial restrictions
- ***Total lockdown: 228.9 million, 70.0%
- ***Business lockdown: 39.2 million, 11.8%
- Partial restrictions on business (bars, restaurants): 53.9 million, 16.2%
- School closure only: 7.9 million, 2.4%
- No mandatory restrictions: 1.9 million, 0.6%
On Monday MD, DC, VA, and AZ* *(with a lot of loopholes) went to total lockdown, and TN went to business lockdown. Yesterday Maine and Texas went to total lockdown, and South Carolina went to a business lockdown.
Summary for April 1
I started adding the number and rate of increase in deaths as of today.
Over 3/4 of the total US population is under total lockdown. “Social distancing” and lockdowns appear to have lowered the growth rate of new infections. Unfortunately, we still have to wait 1 to 2 weeks for this to have its full effect. Because no action has been taken to “quarantine” incoming travel, including from the recalcitrant States, especially Florida, travelers from those States will re-seed new outbreaks.
Over 3/4 of the total US population is under total lockdown. “Social distancing” and lockdowns appear to have lowered the growth rate of new infections. Unfortunately, we still have to wait 1 to 2 weeks for this to have its full effect. Because no action has been taken to “quarantine” incoming travel, including from the recalcitrant States, especially Florida, travelers from those States will re-seed new outbreaks.
Further, the number of daily tests has stalled at about 100,000. So long as the virus keeps spreading at an exponential rate, even a lower one, we are falling further and further behind, I.e., we are failing to catch more new infections. The longer this continues, the longer it will be until total lockdowns can be lifted - because we don’t have the wherewithal to go to a “South Korea” style regimen of pervasive testing and quarantines.
The federal government will continue to fail. It is up to the States to band together to implement quarantining of visitors from other States, and in ordering emergency production of masks, tests, thermometers and other necessary equipment.
The best “less worse” news of the entire coronavirus pandemic so far
- by New Deal democrat
All is not lost. There can be light at the end of the tunnel.
Italy - the epicenter of the pandemic several weeks ago - has clearly turned the corner, recording fewer new cases day/day (from the Financial Times):
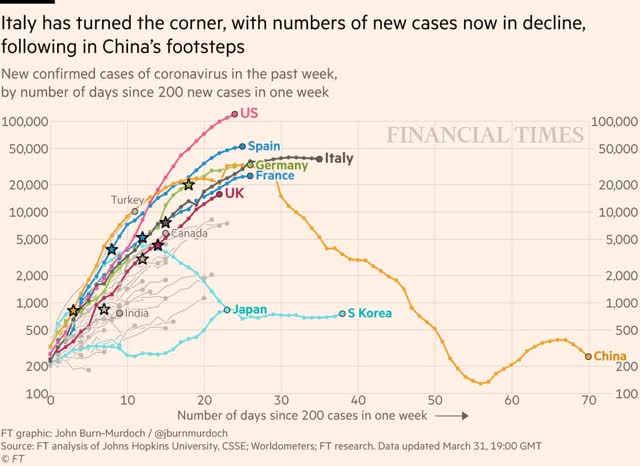
It joins China and South Korea as one of the countries on the downside of new infections. Note that Germany and Spain also look like they are on the verge of peaking as well. And even Spain and the US show signs of “bending the curve.”
The US has gone from a 35% growth rate in most of March, to a 19% growth rate in the past week, to 15% in each of the last three days.
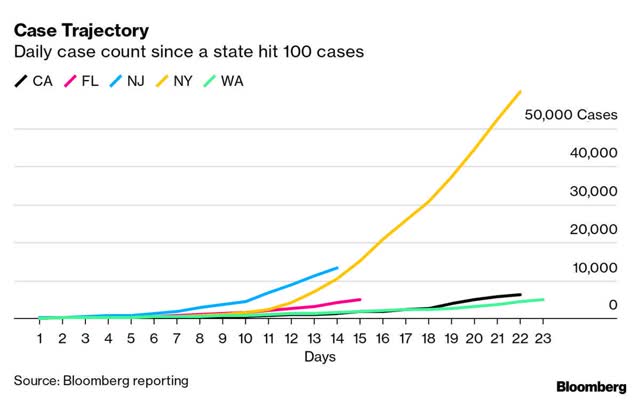
Further, within the US there are indications that those States which moved the earliest to lockdowns in several of their metro areas - Washington and California - have also successfully “bent the curve,” with a far slower rate of increase than other metro areas:
So why does New York City have such a bad trend? I strongly suspect that the inability to test in February and early March meant that the virus spread underground for weeks undetected. It had a running head start. Here’s a map from early March showing infections by US metro areas. Note that San Francisco and Seattle are almost as bad as NYC:
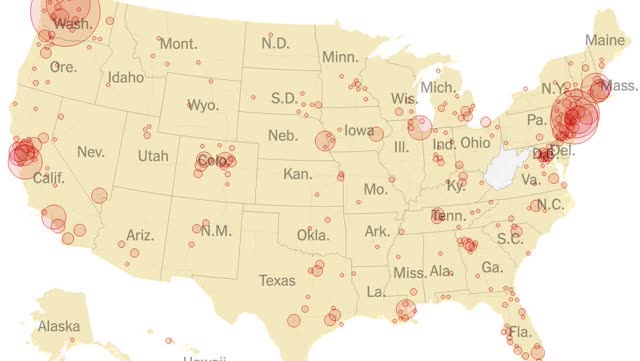
I haven’t been able to find it, but I remember that the earliest versions of that map showed SF and Seattle as epicenters, with curiously few cases in NYC. It sticks out in my mind, because NYC along with the three big West Cost metro regions has the most contacts with China, and I expected the virus to spread there the earliest as well, and I was surprised that the time that it apparently hadn’t.
The first “shelter in place” statewide orders went into effect on Friday March 20. In a few days we should begin to see the effect of those show up in daily infection totals.
Tuesday, March 31, 2020
Coronavirus dashboard for March 31: more States finally implement lockdown; testing rate still poor
- by New Deal democrat
Here is the update through yesterday (March 30)
It looks like there is near-consensus in the medical community that a “first China, then South Korea” (or, “Sledgehammer then Scalpel”) approach is the paradigm to tamp down the pandemic.
Nearly 75% of the US population is now under lockdown, and it may be beginning to break the band of exponential growth.
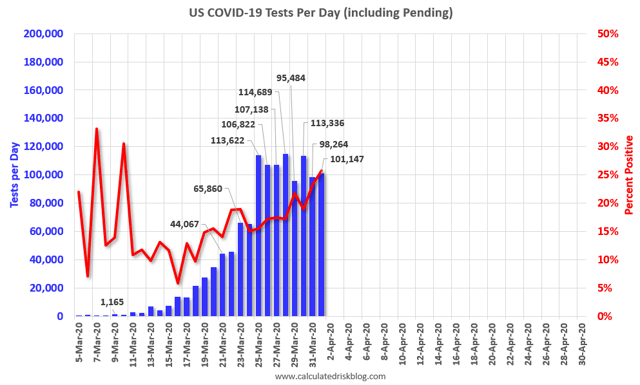
Based on South Korea’s experience, a ratio of 15:1 in total tests to results showing infection is the level where there can be some confidence that the infections have been contained. I pointed that out to Bill McBride a week ago, and he is now including that in his daily testing graphs.
The above three most important metrics are starred (***) below.
Number and rate of increase of Reported Infections (from Johns Hopkins via arcgis.com)
- Number: up +21,555 to 164,610 (vs. +18,369 on March 29)
- ***Rate of increase: day/day: 15% (vs. 34.6% baseline, 20% for the past week, and 15% on March 28)
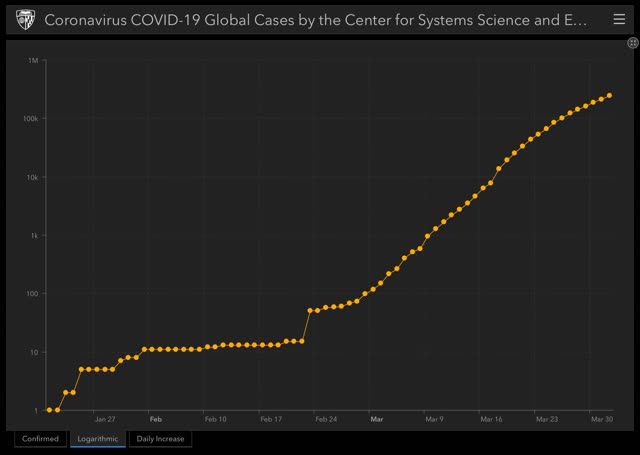
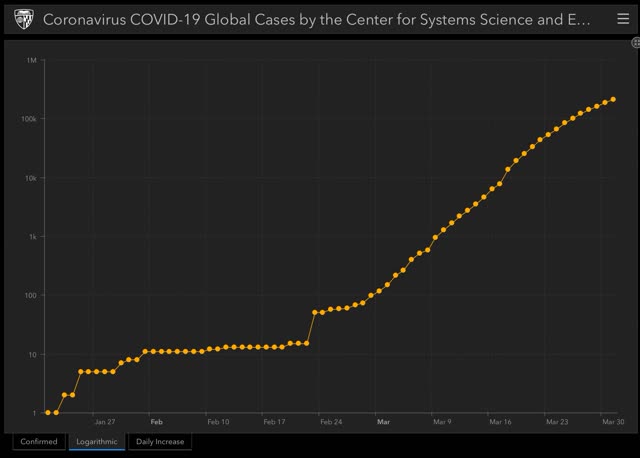
Here is the Johns Hopkins log scale graph comparing the 7 day rate of growth in new cases vs. total infections in the US:
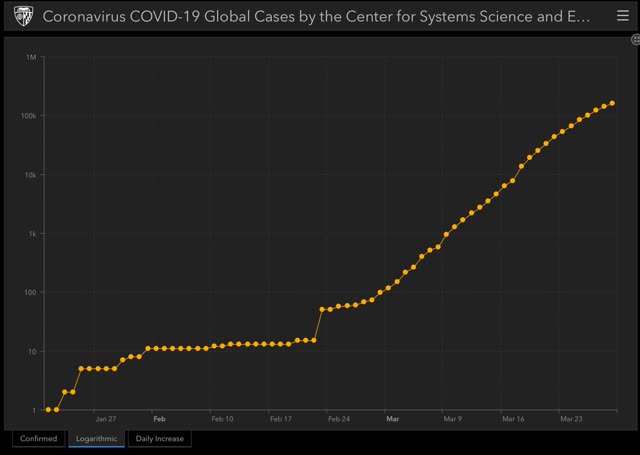
This looks like confirmation that the exponential rate of growth is beginning to slow.
Also, Ben Engebreth has started tracking coronvirus infection and testing numbers for each state, with graphs, here.
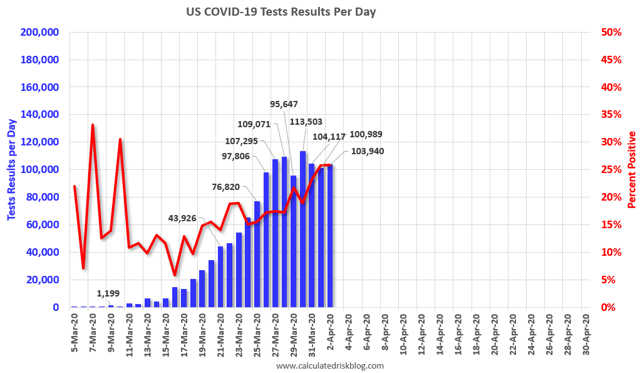
Number and rate of increase of testing (from COVID Tracking Project)
- Number: 113,503, up +17,856 vs. 95,647 on March 29 day/day
- Rate: increase of 19% vs. number of tests previous day
Comparison of rates of increase in documented infections vs. testing
- Infections +15% vs. Tests +19% day/day
Result: The rate of testing has been failing to improve (until today) and remains far, far below what is needed, which is probably now at least 250,000/day. Note this target number is also increasing exponentially as we try to chase the number of exponentially increasing infections.
Ratio of tests to positives for infection (from COVID Tracking Project)
- Number: 113,503 new tests vs. 21,469 new diagnosed infections
- ***Ratio: 5.3:1
In South Korea, where aggressive testing has led to a near-total disappearance of new cases, the inflection point where the number of new daily cases plateaued was reached when the ratio of tests to new cases found reached 15:1. Any ratio less than that suggests that not enough testing is being done. Yesterday’s ratio of 5.3:1 continues to show that testing is falling further and further behind the level of new infections.
Number of States (+DC and Puerto Rico) in total lockdown, business lockdown, and partial restrictions
- Total lockdown (personal + business): 31 (AK, AZ, CA, CO, CT, DC, DE, HI, ID, IL, IN, KS, LA, MD, MN, MI, MT, NC, NH, NM, NJ, NY, OH, OR, PR, RI, VA, VT, WA, WI, WV)
- Business lockdown: 6 (KY, MA, ME*, NV, PA*, TN*)
- Partial restrictions on business (restaurants and bars): 11 (AL, FL*^, GA*, IA, MO*, MS, ND, SC*, TX*^, UT*, WY)
- School closure only: 3 (AR, OK**, SD)
- No mandatory restrictions: 1 (NE*)
*some local areas are under lockdowns
**some local areas with partial restrictions
^restrictions on entry into State from some other affected States
Here is the NY Times’ most recent graph of lockdowns:
Number and percent of US population in total lockdown, business lockdown, and partial restrictions
- ***Total lockdown: 153.2 million, 59.8%
- ***Business lockdown: 35.4 million, 10.7%
- Partial restrictions on business (bars, restaurants): 88.0 million, 26.5%
- School closure only: 7.9 million, 2.4%
- No mandatory restrictions: 1.9 million, 0.6%
Earlier last week, there was a decisive move towards more restrictive measures across the board. This all but ground to a halt across the southern “red” States. Yesterday did see MD, DC, VA, and AZ go to total lockdown, and TN go to business lockdown.
Summary for March 31
Almost 3/4 of the total US population, including metro areas in some non-lockdown States, is under total lockdown. Unfortunately, we still have to wait 1 to 2 weeks for this to have its full effect. Because no action has been taken to “quarantine” incoming travel, including from the recalcitrant States, especially Florida, travelers from those States will re-seed new outbreaks.
It does appear that “social distancing” and lockdowns are bearing some limited fruit. But a deceleration in the exponential rate of increase still means the US as a whole is failing.
Further, the rate of testing, while having increased tremendously, still remains abysmally too low compared with the spread of the virus. In other words, we are still chasing the virus, and we are falling further behind.
It remains the fact that the federal government under Trump will never take the necessary steps - in particular, enforcing a nationwide lockdown or assisting the States in theirs, or ordering emergency production of masks, tests, thermometers or other necessary equipment. Therefore those States which have gone to lockdowns need to cooperate regionally in effectuating a “Sledgehammer, then Scalpel” solution.
Monday, March 30, 2020
A last look at the 2009 - 2020 expansion
- by New Deal democrat
All of the most important economic from February has been reported. Since that was the last month before coronavirus derailed everything, I thought I would take a look back and see what shape the economy was in just before the moment of impact.
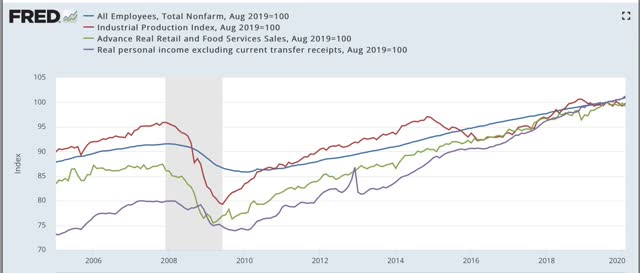
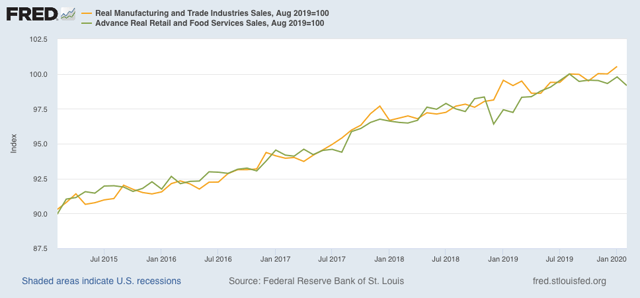
As usual, the 4 coincident indicators that the NBER usually looks for in determining whether the economy is in expansion or contraction are: industrial production, nonfarm payrolls, real sales, and real personal income minus government transfer receipts. Here’s what they look like through February, with each normed to a level of 100 as of August 2019, first in a longer term view:
And now focused on the past year:
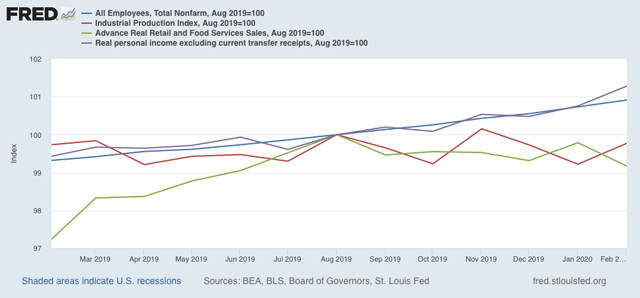
Note that all 4 flattened or rolled over at the outset of the 2008 recession. In 2016, production turned down and income flattened, but both jobs and sales continued to increase. In the latter part of 2019 into early 2020, production and sales turned down, but jobs and income continued to increase.
The NBER looks at a broad measure of sales that includes both manufacturing and wholesale sales as well as retail sales (gold in the graph below), but the former are reported with a several month delay. But since the two usually move in tandem, the shallow downturn in real retail sales will probably also show up in the wider measure:
Also, frequently real personal income doesn’t turn down at all during a recession, or turns later than the other three (e.g., 1960, 1970, 1982):
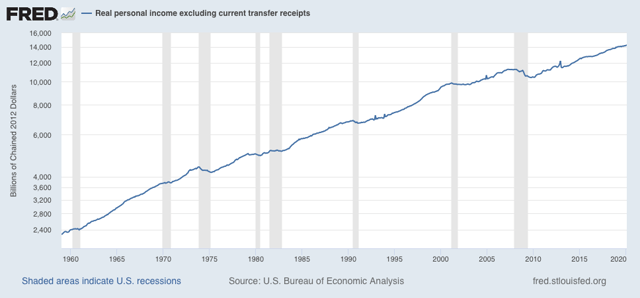
But what it does do is decelerate sharply, especially per capita:
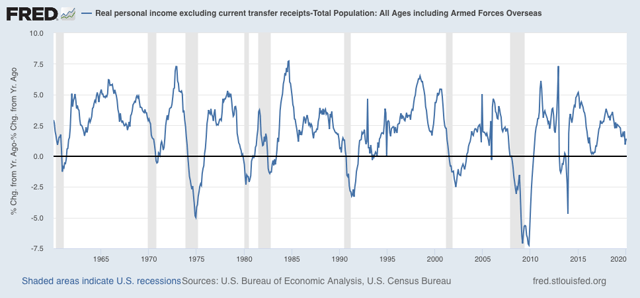
Note that it has not been doing that in the past few months.
On another subject, I have always looked at the housing market as a long leading indicators. In that regard, February single family permits (the least noisy metric) made a new expansion high, and while the much more noisy new home sales decreased slightly, the three month average also made a new expansion high:
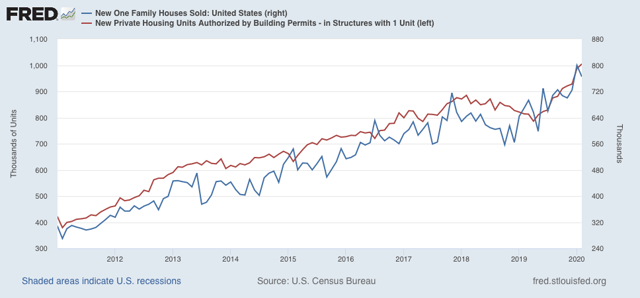
Several other long leading indicators, like real money supply and corporate bond rates (not shown) also were very positive.
In summary, just before the coronavirus pandemic almost certainly ended the expansion, it was in a slowdown, but most likely that slowdown was not severe, and was not going to turn into a recession, as the leading indicators had indicated improvement in the second half of this year.
Once we have more visibility as to the course of the pandemic, it will be worthwhile to look at the short and long leading indicators again to see what the economy is likely to look like thereafter.
Coronavirus dashboard for March 30: exponential growth rate may be decreasing
- by New Deal democrat
Here is the update through yesterday (March 29)
I am pleased to read that it looks like there is near-consensus in the medical community that a “first China, then South Korea” (or, “Sledgehammer then Scalpel”) approach is the paradigm to tamp down the pandemic.
Over 50% of the US population is now under lockdown, and it may be beginning to break the band of exponential growth.
Based on South Korea’s experience, a ratio of 15:1 in total tests to results showing infection is the level where there can be some confidence that the infections have been contained. I pointed that out to Bill McBride a week ago, and he is now including that in his daily testing graphs. Testing in the past 4 days has plateaued (not good) and is not keeping pace at all with the growth in new infections.
The above three most important metrics are starred (***) below.
Number and rate of increase of Reported Infections (from Johns Hopkins via arcgis.com)
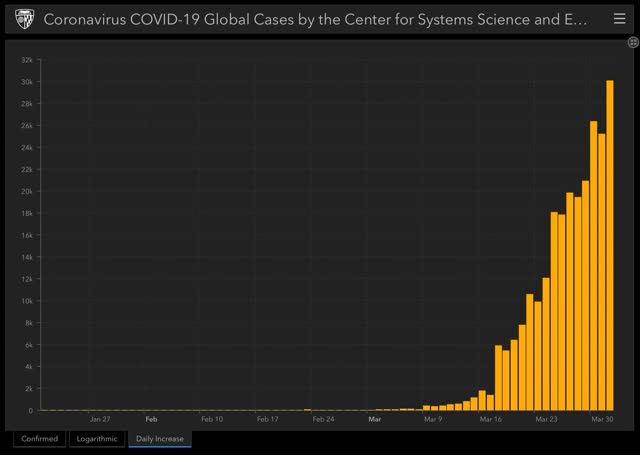
- Number: up +18,369 to 143,055 (vs. +19,849 on March 28)
- ***Rate of increase: day/day: 15% (vs. 34.6% baseline, 22% for the past week, and 19% on March 27)
There’s an excellent video up, showing how comparing the 7 day rates of growth in new vs. total infections can show when the exponential rate of growth is beginning to slow. We may have just arrived at that point.
Note: Ben Engebreth, whose Department of Numbers used to track house prices back in the housing bubble days, has started tracking coronvirus infection and testing numbers, with graphs. You can find it here.
Number and rate of increase of testing (from COVID Tracking Project)
- Number: 95,647, down -13,424 vs. 109,071 on March 28 day/day
- Rate: decrease of -12% vs. number of tests previous day
Comparison of rates of increase in documented infections vs. testing
- Infections +15% vs. Tests -12% day/day
Result: The rate of testing is failing to improve and is far, far below what is needed, which is probably now at least 200,000/day. Note this target number is also increasing exponentially as we try to chase the number of exponentially increasing infections.
Ratio of tests to positives for infection (from COVID Tracking Project)
- Number: 95,647 new tests vs. 20,827 new diagnosed infections
- ***Ratio: 4.6:1
In South Korea, where aggressive testing has led to a near-total disappearance of new cases, the inflection point where the number of new daily cases plateaued was reached when the ratio of tests to new cases found reached 15:1. Any ratio less than that suggests that not enough testing is being done. Yesterday’s ratio of 4.6:1 continues the trend of worsening, I.e., we are falling further and further behind in testing.
Number of States (+DC and Puerto Rico) in total lockdown, business lockdown, and partial restrictions
- Total lockdown (personal + business): 26 (AK, CA, CO, CT, DE, HI, ID, IL, IN, KS, LA, MN, NC, NH, NM, MI, MT, NJ, NY, OH, OR, PR, RI, VT, WA, WI, WV)
- Business lockdown: 7 (DC, KY, MA, MD, ME*, NV, PA*)
- Partial restrictions on business (restaurants and bars): 14 (AL, FL*^, GA*, IA, MO*, MS, ND, SC*, TN*, TX*^, UT*, VA, WY)
- School closure only: 4 (AZ**, AR, OK**, SD)
- No mandatory restrictions: 1 (NE*)
*some local areas are under lockdowns
**some local areas with partial restrictions
^restrictions on entry into State from some other affected States
With the exception of Arizona, all of the remaining States with no restrictions or only school closures are rural.
Number and percent of US population in total lockdown, business lockdown, and partial restrictions
- ***Total lockdown: 153.2 million, 46.2%
- ***Business lockdown: 39.2 million, 11.8%
- Partial restrictions on business (bars, restaurants): 103.3 million, 31.1%
- School closure only: 12.8 million, 3.9%
- No mandatory restrictions: 1.9 million, 0.6%
Earlier last week, there was a decisive move towards more restrictive measures across the board. This all but ground to a halt across the southern “red” States. Continued exponential growth in those cases will teach a brutal lesson.
Over half of the total US population, including metro areas in some non-lockdown States, is under total lockdown. That is the percentage, AT MINIMUM, I think we need to have a chance of following China’s successful strategy for beating back the pandemic.
The deceleration of the rate of increase in new cases may be the first signs that “social distancing” is bearing some limited fruit. But a deceleration in the exponential rate of increase still means the US as a whole is failing.
Further, the rate of testing, while having increased tremendously, still remains abysmally too low compared with the spread of the virus. In other words, we are still chasing the virus, and we are falling further behind.
There is NO HOPE that the federal government under Trump will take necessary steps - in particular, enforcing a nationwide lockdown or assisting the States in theirs, or ordering production of masks, tests, thermometers or other necessary equipment. Therefore those States which have gone to lockdowns need to cooperate regionally in quarantining incoming visitors at airports, train stations and at highway checkpoints.
Subscribe to:
Posts (Atom)