Saturday, February 6, 2021

Weekly Indicators for February 1 - 5 at Seeking Alpha


- by New Deal democrat

My Weekly Indicators post is up at Seeking Alpha.

All of the leading sectors - manufacturing, housing, interest rates, money supply - are revving in place, just waiting for the pandemic to be brought under control.

As usual, clicking over and reading will bring you up to the virtual moment, and bring me a tiny bit of jingle in my pocket.

Friday, February 5, 2021

January 2021 jobs report: a strong divergence between very weak job gains, but a big drop in unemployment; but the only critical number is the doses of vaccine administered


 - by New Deal democrat

For the past several weeks, based on the increase in initial jobless claims, I have warned that the December employment report might have a negative number, or at very least a very weak positive. Once again this was an accurate forecast.

There was a strong divergence between the household and establishment reports this month. And to cut to the chase, the only real critical number is the amount of vaccinations administered.

HEADLINES:
  • 49,000 jobs added, only 5,000 of which were in the private sector and 43,000 in government. The alternate, and more volatile measure in the household report indicated a gain of 201,000 jobs, which factors into the unemployment and underemployment rates below.
  • U3 unemployment rate declined 0.4% at 6.3%, compared with the January 2020 low of 3.5%.
  • U6 underemployment rate fell -0.6% to 11.1%, compared with the January 2020 low of 6.9%.
  • Those on temporary layoff decreased 293,000 to 2,746,000.
  • Permanent job losers increased by 133,000 to 3,503,000.
  • November was revised downward by 72,000. December was also revised downward by 87,000 respectively, for a net loss of 159,000 jobs compared with previous reports.
Leading employment indicators of a slowdown or recession

I am still highlighting these because of their leading nature for the economy overall.  These were mixed: 
  • the average manufacturing workweek increased to 40.4 hours. This is one of the 10 components of the LEI.
  • Manufacturing jobs declined by 10,000. Manufacturing has still lost -592,000  jobs in the past 11 months, or 5% of the total. About 60% of the total loss of 10.6% has been regained.
  • Construction jobs decreased by 3,000. Even so, in the past 11 months -256,000 construction jobs have been lost, 3% of the total. About 80% of the worst loss of 15.2% loss has been regained.
  • Residential construction jobs, which are even more leading, *rose* by 3,600. Since February there have now been actual job *gains,* and employment in this sector is at another new 10 year+ high.
  • temporary jobs increased by 80,900. Since February, there have still been 241,100 jobs lost, or 8% of all temporary help jobs.
  • the number of people unemployed for 5 weeks or less declined by -626,000 to 2.278  million, compared with April’s total of 14.283 million.
  • Professional and business employment rose by 97,000, which is still 825,000, or about 4% below its February peak.

Wages of non-managerial workers
  • Average Hourly Earnings for Production and Nonsupervisory Personnel: rose $0.03 from $25.15 to $25.18, which is a 5.4% YoY gain. This is a level not seen in the past 10 years outside of the first months of this pandemic. Relative gains in this measure reflect that job losses during the pandemic have occurred primarily among lower wage earners.

Aggregate hours and wages:
  • the index of aggregate hours worked for non-managerial workers rose by 0.5%. In the past 11 months combined this has nevertheless fallen by about  5.5%.
  •  the index of aggregate payrolls for non-managerial workers rose by 0.6%. In the past 11 months combined this has nevertheless fallen by about 2.5%. Still, over 90% of the loss from February to April has been made back up.

Other significant data:
  • Full time jobs gained 301,000 in the household report.
  • Part time jobs declined 456,000 in the household report.
  • The number of job holders who were part time for economic reasons decreased by 216,000 to 4.567 million. This is still an increase since February of 1,556,000.
  • UPDATE: The pandemic has had a singular effect on food and drink establishments. Since October, there have been 446,400 jobs lost. “Only” 19,400 of those were in January - so that is at least “less awful.” 

SUMMARY

Once again the household and establishment reports strongly diverged. The household report, from which unemployment rates and the number of full time vs. part time workers are taken, showed strong gains, driven by both increased employment and a slight decrease in the number of people in the jobs market. The establishment report, by contrast, showed weak gains or outright losses, depending on the employment sector. What stands out is the huge gains in temporary employment, which is a leading sector, but also strongly suggests that employers are not willing to make permanent commitments in this volatile environment.

But for the vaccines, the December and January reports together would strongly suggest that a “double dip” recession has started, due to the tremendous surge in new COVID cases during the past 3 months. I suspect, however, that competent policy from the Biden Administration and the continuing improvement I the number of vaccines administered daily, plus the onset of warmer weather in spring, will end these week numbers in a month or two.

Thursday, February 4, 2021

Initial claims decline, continuing claims set another new pandemic low


 - by New Deal democrat

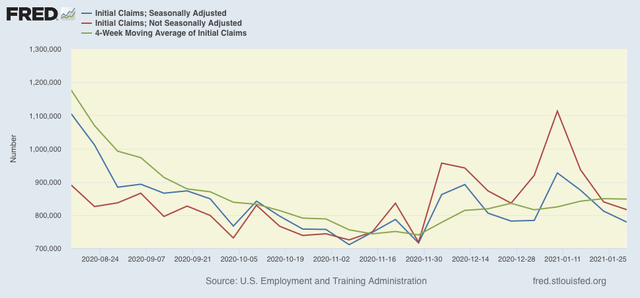
On a unadjusted basis, new jobless claims declined by 23,525 to 816,247. Seasonally adjusted claims declined by 33,000 to 779,000. The 4 week moving average also declined by 1,250 to 848,250. 

Here is the close up since the end of July (these numbers were in the range of 5 to 7 million at their worst in early April): 

Because of the huge swings caused by the scale of the pandemic - typically claims only vary by 20,000 or less from week to week, but since the start of the pandemic, swings of 50,000 or 100,000 per week have happened as often as not, I have been posting the YoY% change in the numbers as well, since they will be much less affected by scale. As a result, there is less noise in the numbers, and the trend can be seen more clearly:

Here’s what that looks like:

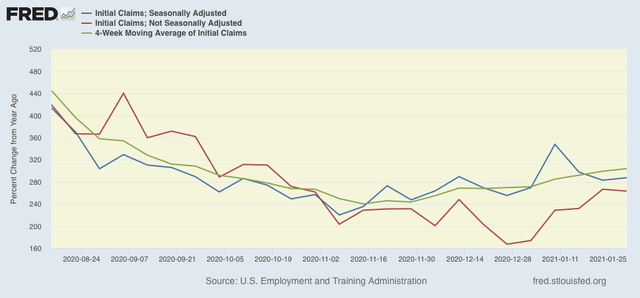
The recent elevation in new claims compared with their November lows is clear. Whether the last several weeks’ declines in new claims, which were over 900,000 only 3 weeks ago, means the upward trend has peaked, will have to await several more weeks’ data.


Meanwhile continuing claims, which historically lag initial claims typically by a few weeks to several months, made still more new pandemic lows this week. Seasonally adjusted continuing claims declined by 193,000 to 4,592,000, while the unadjusted number declined by 127,726 to 5,094,605:


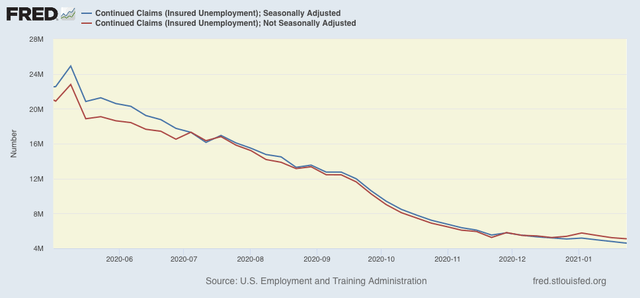
Although I had suspected that we would see an upward reversal, obviously that hasn’t happened. 

As I usually note, a reminder that both initial and continued claims remain at or above their worst levels from the Great Recession.

Finally, tomorrow we will get the January employment report. For the relevant set of weeks, January claims averaged about 20,000 higher than December. Last week, when the average was 40,000, I wrote that it appeared more likely than not that we will see another slightly negative jobs report. We still might, but with the revisions a small gain is equally possible.

Because of the much more coherent, comprehensive, and forceful approach to the pandemic from the new Biden Administration, and the simple fact that the weather will begin to warm up in a month, I am expecting the trend in claims to peak and to reverse again by the beginning of April - hopefully for good.

Wednesday, February 3, 2021

Q4 GDP’s long leading indicators suggest slowing by year-end 2021


 - by New Deal democrat

Last Thursday GDP for Q4 was released. That report contains two long leading indicators, which help fill in the picture for year-end 2021.

I put up a fuller report over at Seeking Alpha.

As usual, clicking over and reading rewards m a little bit for the effort I put into this endeavor.

Tuesday, February 2, 2021

Coronavirus dashboard: Groundhog Day


 - by New Deal democrat

Today is Groundhog Day, America’s version of the midwinter festival, where people can at least begin to look ahead to the coming of spring in the near future. That’s a good analogy for where we are in the COVID pandemic. 


Let me start with the ghastly news.

First, there have been over 26 MILLION confirmed cases. Since many unsymptomatic cases have gone undiagnosed, it is very likely that over 33 million, or 1 in every 10 Americans, has been infected with the disease:  


Further, in the 10 worst hit States, roughly 1 in every 500 people in the entire population has died. In the case of New Jersey, it’s 1 in 400:


As has been the case throughout the pandemic, panic has bred caution. The total number of new infections in the past week has been at a 3 month low:


And all 4 regions of the country are showing a decline, with the lowest regions being the warmer ones of the South and West Coast, where presumably people are engaging in more activity outdoors rather than risky indoor groups:


The States which have historically done the best in this pandemic: Maine, Vermont, Oregon, and Alaska, continue to do well, as shown in the below graph of the 10 States and territories with the lowest death rates, plus Ontario, Canada for comparison:

 
Finally, vaccine administration is continues to ramp up arithmetically, currently averaging 1.35 million doses daily for the past week:


At the current rate of increase, we will be at 2 million doses a day in about 3 weeks. That would enable us to vaccinate the entire population by the end of this year. 

The best news of all comes from this spreadsheet. In the trials for the five leading vaccines, about 75,000 people were vaccinated. Exactly *ZERO* of the participants subsequently have been hospitalized or died of COVID:


These are simply extremely effective vaccines.

Spring is coming.

Monday, February 1, 2021

The two most leading sectors of the real economy - manufacturing and construction - remain “on fire”


 - by New Deal democrat

Data for January 2021 started out this morning with the ISM manufacturing index, while the December laggard of construction spending was also reported. 


While the ISM manufacturing reading declined from 60.7 to 58.7, since 50 is the break even point, this is still a very strong positive. The even more leading new orders subindex also declined from 67.9 to 61.1, also still a very positive reading:


The manufacturing sector remains very healthy.

Turning to construction, one of my consistent themes in the past few months has been how the housing market is priming the economy for strong growth in 2021 as soon as the pandemic is brought under control. That was further confirmed as December construction spending surged yet again, confirming what we have already been seeing in housing permits and starts.


First of all, here are both total and residential construction spending for the past 25 years:


In raw, non-inflation-adjusted terms, both made new all-time highs last month.

Of the two, residential construction is the more important because it is more leading, indicator. Commercial and government construction, which are included in the total, relatively speaking lag.

Because permits have to be taken out before construction can begin, typically these lead construction spending (although in fairness that really hasn’t been true in the past 2 years). Below I show the YoY% change in both, which helps take care of the fact that residential construction spending isn’t adjusted for inflation:


Beginning last May, residential construction spending has been increasing at a pace equivalent to its best in the past 5 years, just as permits have done even better. In short, soaring permits should mean soaring construction continuing through this spring and summer.

Simply put, this morning’s two reports together show that manufacturing and housing, the two most important leading sectors of the real economy, continue to be “on fire.”

Sunday, January 31, 2021

The historical use of the filibuster in the Senate


 - by New Deal democrat

I came across the below table and explanation in the twitter feed of Matt Yglesias, I think, and wanted to post it here for preservation. It is a recapitulation by decade through 2009 of the use of the filibuster, and cloture motions, in the Senate:

Note that in the two year period of 2007-09, cloture was invoked more often than in the entire decades before 1980. And the Congress of 2009-11 had even more cloture motions than that.

In short, the filibuster has gone from a rarely-used, extreme instrument, to an ordinary course of business during our lifetimes.

Beyond that, as it currently exists, the filibuster overwhelmingly favors the GOP agenda. Since they don’t want to pass any new programs, or even enforce existing ones, a 60 vote requirement to enact those suits their purposes.  But the two things they *do* want - tax cuts and conservative judges - can be enacted with simple 50+1 vote majorities.

 The only downside for Democrats, if they did away with the filibuster - and it’s a big one -  is that the GOP would use the new rules to repeal whole rafts of one-standing progressive enactments - like Social Security, Medicare, and   the EPA - the next time they get the trifecta of House, Senate, and Presidential victories. Since an extreme backlash would follow, democrats would have to re-enact those things after the next Presidential election if they were victorious. 


But the current situation is simply intolerable.