- by New Deal democrat
I haven’t “officially” updated my take on the long leading indicators - those that forecast a recession at least one year beforehand - in almost two years. That’s because the hurricane force tailwind of the supply-side deflationary unlinking of the global supply chain completely swamped everything else. So if I were to examine, e.g., corporate bond prices, is the appropriate comparison with 2021, or with 2023, after the supply chain had unlinked? Since there’s no clear answer to that, I haven’t seen the point.
But the same isn’t really true of the non-financial indicators. These detail producer and consumer well-being out in the real world. If their fortunes are waxing, the economy should continue doing well; if they are waning, there’s likely trouble ahead.
So I thought now might be a good time to look at those. Below I’ll look at five such long leading indicators. Two have to do with the housing market, two with corporate health, and one with consumer spending. (The three financial indicators I’ve eliminated are the yield curve, corporate bond prices, and money supply, all of which are more or less under the control of the Fed, and are strictly financial).
Let’s start with housing. Housing permits have long been known as a long leading indicator. Below I show total (blue) and single family (red) housing permits:
With the sole exception of the 2001 recession, which was focused on producers, housing permits have declined over 10% - and usually over 20% before the onset of recessions, with the peak occurring over one year before. In our present situation, both total and single family permits are down almost -25% since their peaks in January 2022. As I’ve written several times in the past couple of months, this is recessionary, although in a recession I would expect them to decline even further. We’ll get the next update of these numbers on Wednesday.
A similar tale is told by private residential fixed investment as a share of GDP. Calculated both in real and nominal terms, this metric also turned down typically between one and two years before a recession. In real terms the ratio peaked in 2021; in nominal terms in 2022:
So, both of our housing metrics are telling us to beware of recession.
Now let’s turn to the producer sector. Corporate profits deflated by unit labor costs also typically turn down a year or more before a recession. This makes sense, because once profits turn down, executives start looking for ways to cut costs, and frequently that means cutting staff.
With the exception of 1974, this metric has always declined at least one year before the onset of a recession. It did decline from the last quarter of 2021 to the last quarter of 2022, but has risen since then to an all time high in Q2 of this year, before declining a tiny -0.2% in Q3:
If this is generally positive, the picture of corporate borrowing is more mixed.
Corporate demand for loans has been declining for several years. The nadir of its decline was in 2022. While still negative, it had generally been improving since then - a typical marker of an economy coming *out* of a recession - until this past quarter:
We won’t know for several more months whether or not this is the beginning of a new slide.
The closest I’ll get to a financial indicator in this series is the percentage of banks tightening vs. loosening standards for corporate loans. Banks have progressively been making conditions less tight for the past year. Again, this is something we typically see coming out of recessions:
If corporate profits recover from their slight decline in Q3, then this is all just a blip, and producer health is very positive. If they don’t, then I’d want to see if loan demand continues to slide.
Finally, let’s look at the consumer side. In the modern era, real per capita retail sales have generally turned down at least one year before a recession. This is typically the sale of goods more than services. If consumers are pulling in their horns buying actual stuff, then producers react - with a lag - by cutting production and/or staff.
Here the news has been relentlessly negative since 2021, and in the past two years in all but three months real sales have actually been lower YoY:
This has looked very recessionary for several years.
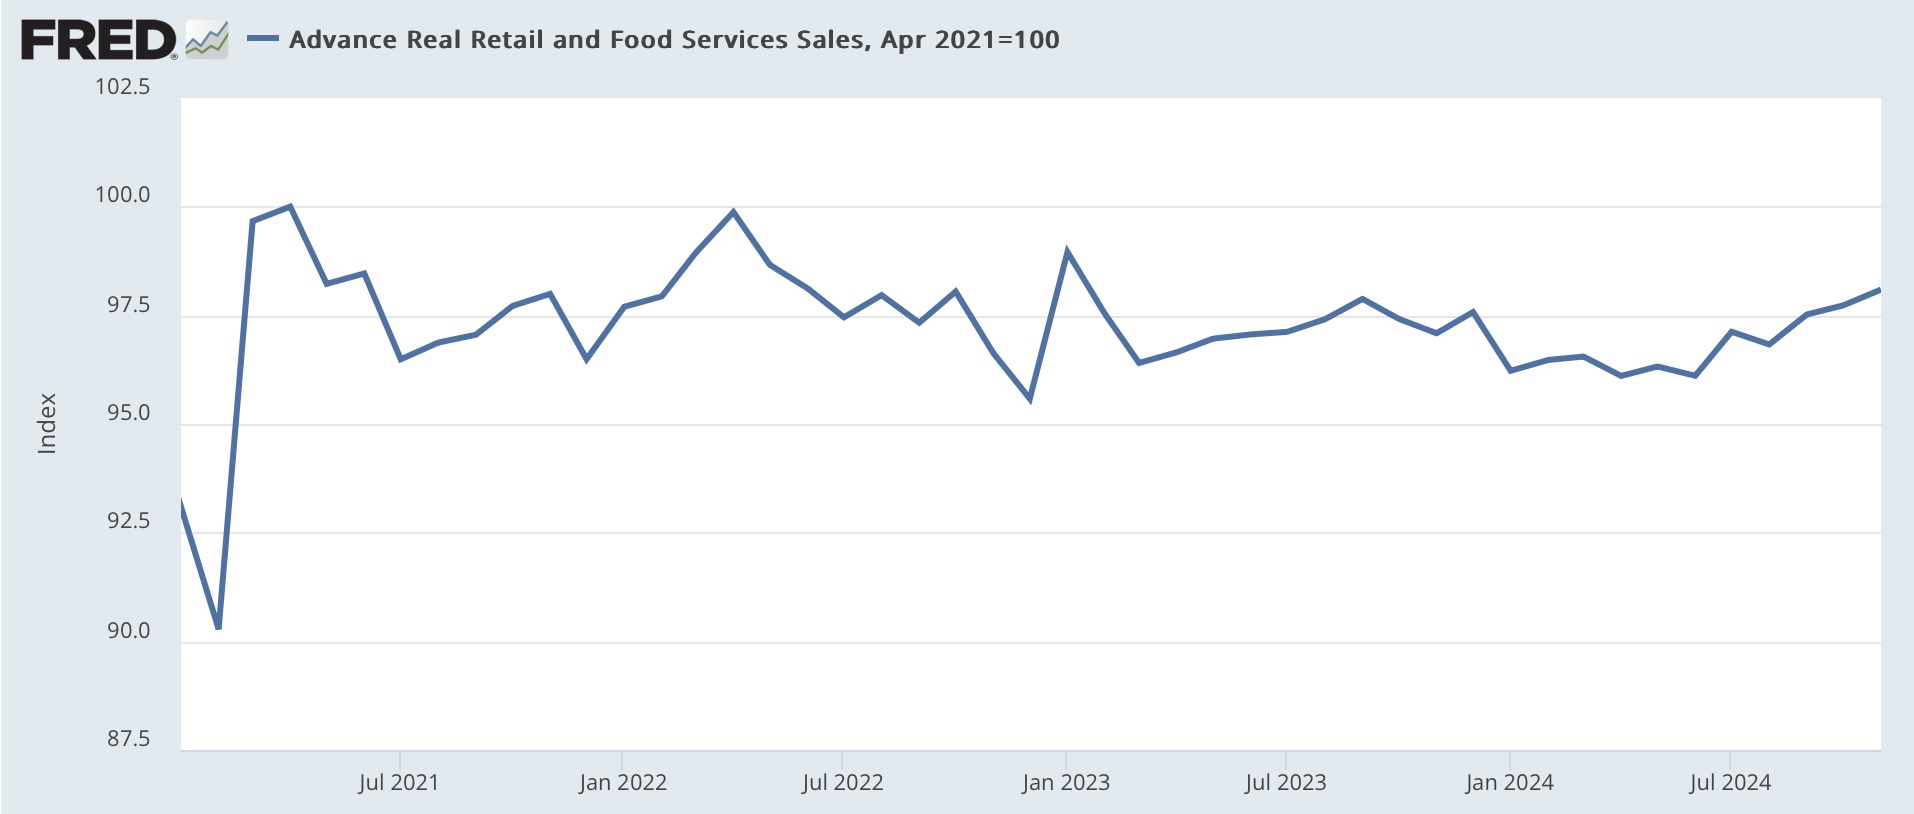
But because similar measures, like real personal consumption expenditures for goods have been very positive, it made me wonder if the difference was all about the deflator, because shelter costs are 1/3rd of the entire CPI measure, but are a much smaller share of the personal spending deflator. So this next graph deflates retail sales by CPI less shelter, and there the story is quite different:
Basically, take out rent and the fictitious owners’ equivalent rent, and real sales per capita have been increasing off and on for over two years. Shelter costs are squeezing consumers, but they’re spending their money on other stuff just fine.
The conclusion I come to looking at the above nonfinancial long leading indicators is that the economy, excluding the housing sector, is not poised to enter a recession in the next few quarters. What happens with the housing sector will depend very much on mortgage interest rates. The next crucial measure to watch is whether corporate profits resume growth, or whether Q2 of this year was their high water mark for the cycle. Even in the most negative case, that would suggest no recession until at least the latter part of next year at the earliest.