Friday, March 31, 2023

Real income in February rises slightly; real spending declines slightly; real total sales in January rose sharply, as expected


 - by New Deal democrat


As I wrote earlier this week, personal income and outlays is one of the two most important data releases at the current time, along with the monthly jobs report. That’s because these are the two sectors of the economy that have most prominently not rolled over, and are keeping us out of recession.

This morning’s February release was the proverbial mixed bag.

Nominally, personal income rose 0.3% and spending rose 0.2%. But because the deflator also rose 0.3%, in real terms income was unchanged, and spending actually declined -0.1%. Here’s what they both look like since before the pandemic (normed to 100 as of 12 months ago):


YoY real spending rose 2.5%, and real income rose 1.1%. For comparison, here is the YoY% change over the past 20 years up until the pandemic:


A 2.5% increase in real spending is about par for the course for the past 20 years, while the 1.1% increase in real income is lower than almost all times outside of recessions (and for 2013, after Social Security withholding was increased by 1%):


Meanwhile, the personal savings rate rose 0.1% to 4.6%, which is a nice rebound from last June’s all-time low:


But on the other hand, a rise in the savings rate is typically seen just in advance of recessions, as consumers grow more cautious.

The personal income and spending release is also important because it feeds directly into 2 of the 4 coincident indicators most relied upon by the NBER to determine if the economy is in expansion or recession.

The first of the 2 is real personal income less government transfer receipts. This rose less than 0.1%, rounding to 0. While this has risen 0.9% in the past 6 months, it has only risen 0.25% for the last three:


In other words, this important coincident indicator could very well be peaking - and indeed, have peaked - in February.

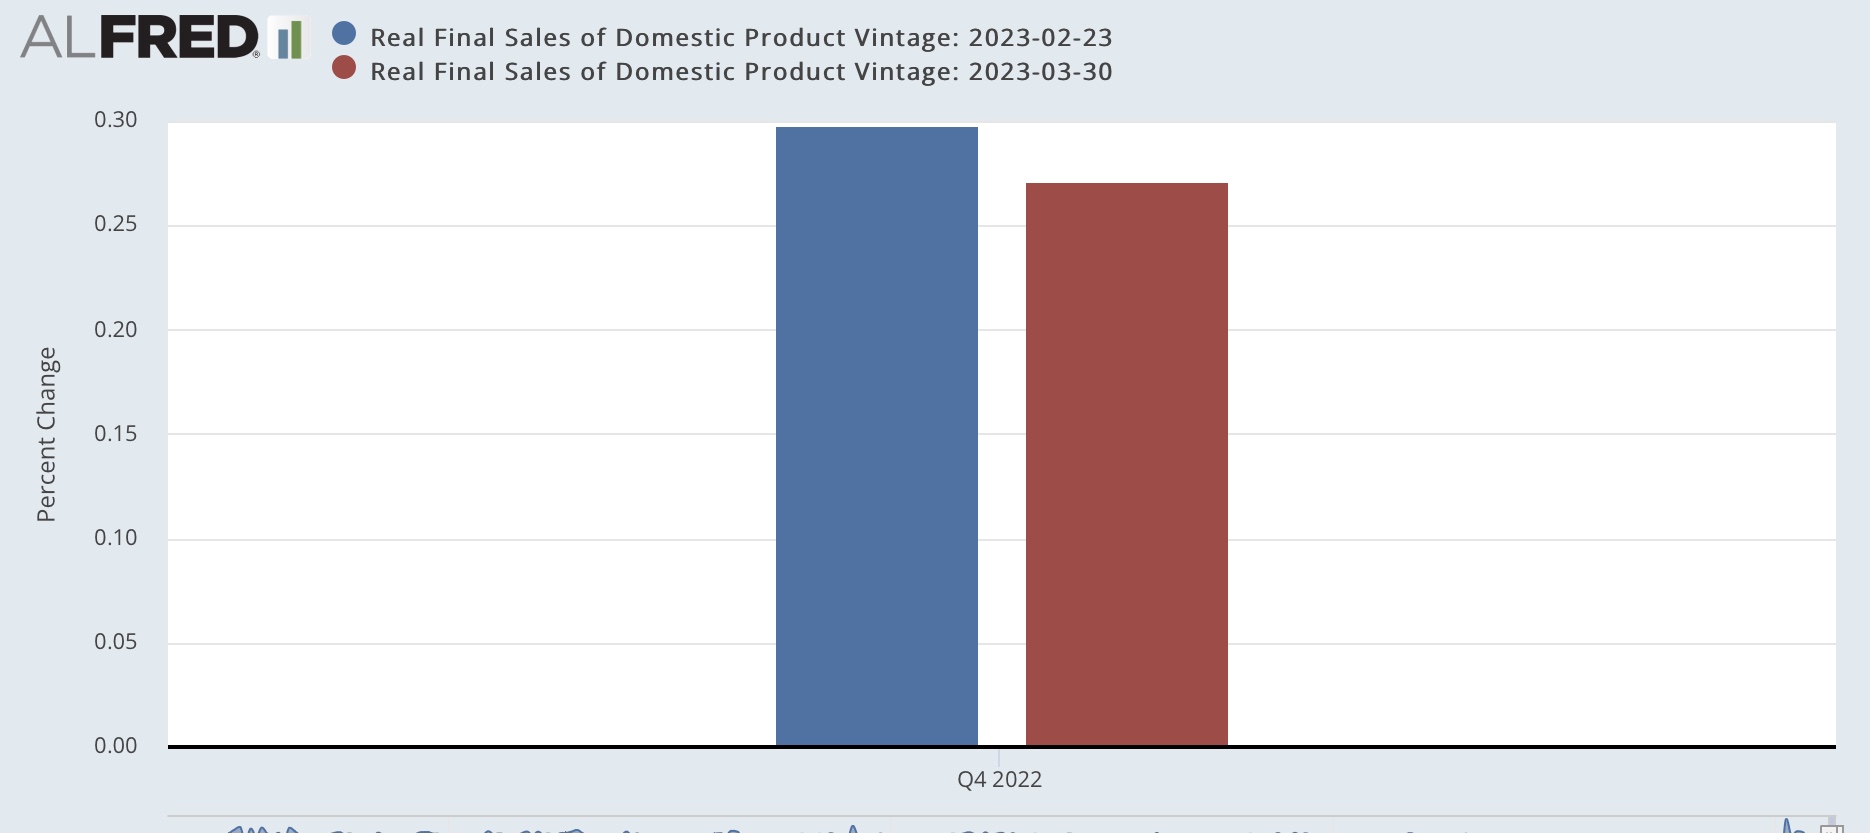
The second of the 2 is real manufacturing and trade sales, which relies in part on the PCE deflator. This increased a sharp 0.5% for January, which sounds good:


But the big January increase was telegraphed by the huge 2.7% January gain in real retail sales (which make up about 1/3rd of the number) that we’ve already known about for the past month and a half. 

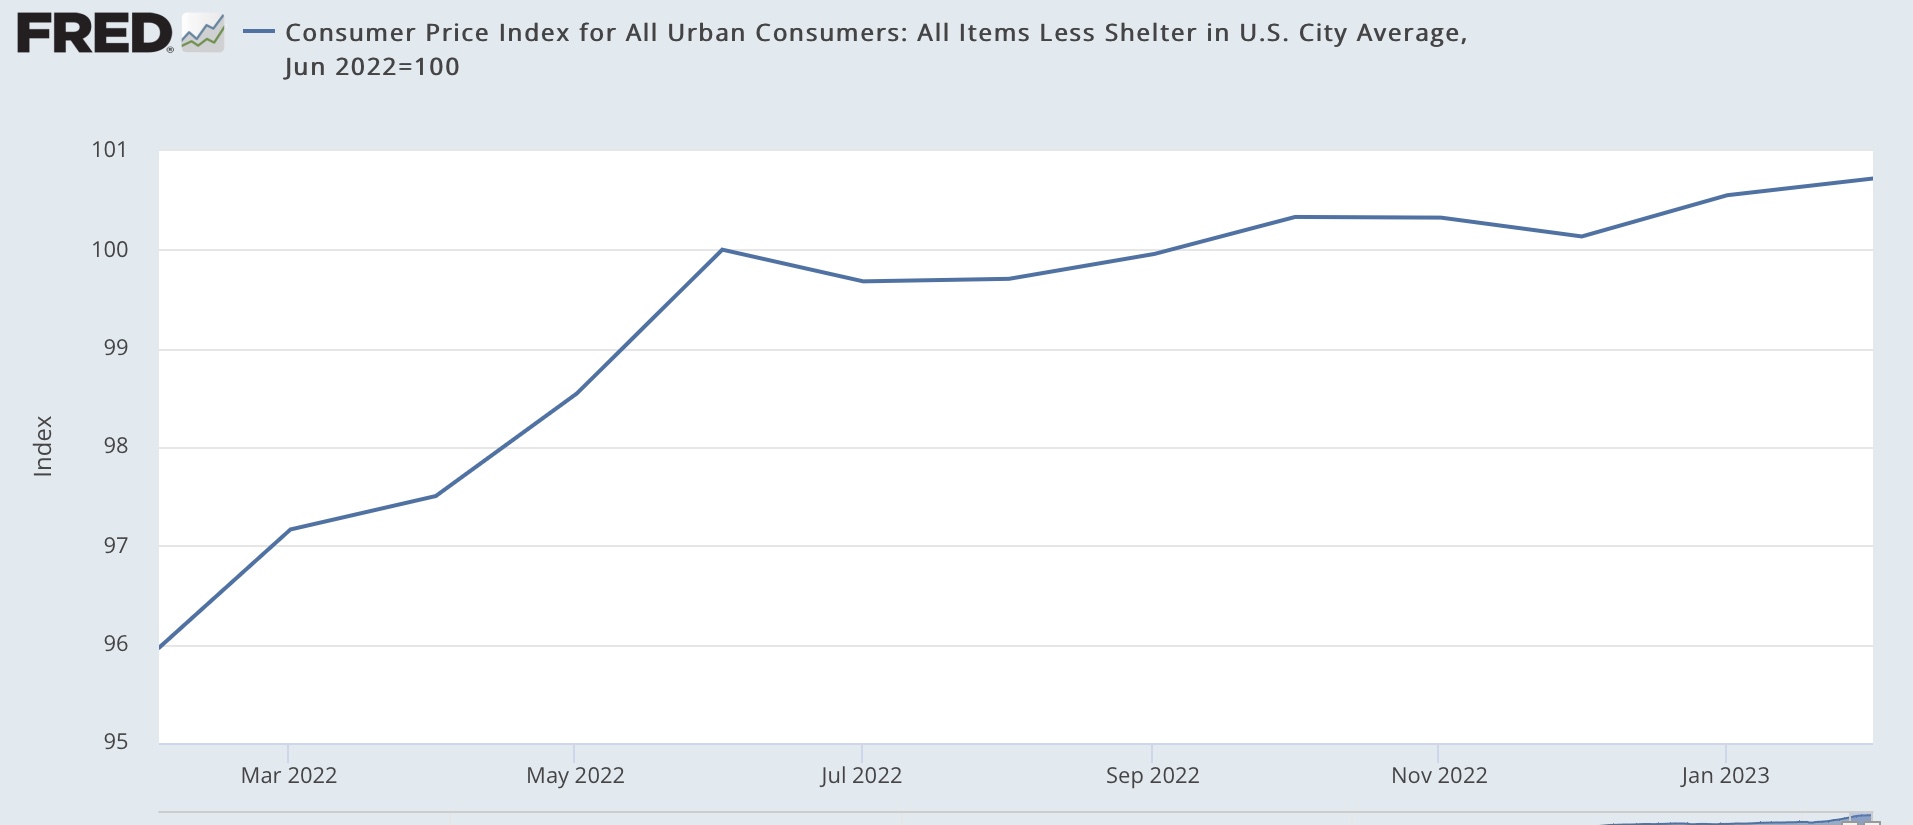
Because this economic series lags so much, you may recall that several weeks ago I premiered two systems to estimate it on a more timely basis. At that time I wrote:

“For January 2023 [using CPI rather than the PCE deflator] , the estimate is an increase of 0.8%. … Because “real” manufacturing and trade sales for December were only 0.4% lower than their all-time record in January 2022, the estimate forecasts that when the official result is reported on March 31, more likely than not it will set a new record.”

The second, more timely system is to average industrial production and real retail sales. Using that estimate, I wrote:

This method is not so accurate as the 2nd estimate I discussed several days ago, but does give us the main thrust. Like the 2nd estimate, for January it forecasts a sharp increase (+1.5% vs. the +0.8% of the 2nd estimate), followed by a -0.4% decrease in February. Like the 2nd estimate, it indicates a new record high for January.”

As shown above, setting a new record for January is exactly what happened, with the early estimate’s +1.5% being not nearly so good as the later estimate’s +0.8%. I’ll be able to update the February estimate in a couple of weeks.

So to summarize: real personal income and spending were slightly positive to slightly negative, with real income and the savings rate both being consistent with a near recession. Similarly, real personal income less transfer receipts has been decelerating significantly, and may even have peaked in February. Finally, real manufacturing and trade sales rose sharply in January on the back of retail sales, but are likely to decline in February; indeed January may also have marked their peak.


Thursday, March 30, 2023

Revisions to Q4 GDP made real final sales worse, a potential portent of near in time recession


 - by New Deal democrat


A month ago, following another blogger, I took a look at real final sales, and real final sales to domestic purchasers, in the GDP - which increased less than 0.5% and just above 0% in Q4, and showed that in the past 60 years, only in the deep slowdowns of 1966 and 1987 were the numbers that low without having been followed within 1-3 quarters by a recession. Here’s a link to the full post from last month.


Well, in this morning’s final revision to Q4 GDP, both got revised even lower.

Here is the revision to real final sales:


And here is the revision to real final sales to domestic purchasers:


In the grand scheme of things, these are quite small revisions. But the fundamental point is that Q4 GDP was held up by inventories, which will have to be liquidated at some point. As I pointed out last month, that process of liquidation has typically meant production cutbacks as well as layoffs of some of the workers on those production lines.

With the advent of “just in time” inventories in the 1990s, manufacturers had been doing that quite quickly, which meant without enough disruption to give rise to a recession. But I noted that the pandemic had replaced that with a “just in case” mentality; and wrote that what happened to manufacturers inventories during the months of Q1 would be important.

Well, we did get January inventories several weeks ago, and the news was not good. Inventories increased to just below their high levels of 2022:


Tomorrow we will see if real manufacturing and trade sales - one of the 4 monthly recession indicators most tracked by the NBER - continued their rebound from last June’s lows in January.


Almost nobody is still getting laid off, but this week, it’s not good enough


 - by New Deal democrat


Today and tomorrow update the two remaining positive sectors of the economy: jobs and real personal income. And the first one continued to give excellent historical readings, but relatively speaking suffered in comparison to their all-time best readings from exactly one year ago.


Initial jobless claims rose 7,000 to 198,000, while the more important 4 week average rose 2,000 to 198,250. By any historical measure, these are excellent readings. Continuing claims, with a one week delay, rose 4,000 to 1,689,000 also historically very good:


Note that the “high” readings at the left end of the graph, from November 2021, would have been considered extremely low during any previous economic expansion.

The fly in the ointment, as I wrote above, is that on March 19 of last year initial claims made a 50+ year low of 166,000, and the 4 week average made its all-time low of 170,500 on April 2 of last year. Thus the YoY% change is over 15% for the former, and over 11% for the more important 4 week average:


Per the historical record, if the 4 week average is more than 10% higher for a month or more, that is a yellow flag for a potential recession. If it gets close to 15%, it is a red flag. As I indicated above, next week will be the “worst” comparison week. By mid-May of last year, the average was back over 200,000. So I suspect we won’t get there, unless there is significant deterioration in the next few weeks.

Wednesday, March 29, 2023

More on the sharp deceleration in YoY house price gains, and the Fed’s chasing the phantom menace


 - by New Deal democrat


Since there is no big economic news again today, let me fill in a little more detail on house prices through January, reported yesterday, vs. CPI for shelter.


Here is the monthly % change for the past 18 months for Owners Equivalent Rent in the CPI (blue), vs. the Case Shiller national index (gold) and the FHFA purchase only index (red) (note: both house price indexes /2.5 for scale):


Month over month the Case Shiller index declined -0.2% on a seasonally adjusted basis, while as I noted yesterday the FHFA index increased 0.2%.

But the most important detail is comparing the early 2022 changes with the last 6 months. Owners Equivalent Rent has increased between 0.6% and 0.8% monthly ever since last May. By contrast, both house price indexes started declining sharply m/m beginning last June. In other words, there are still two more months (March and April) where Owners Equivalent Rent will be compared with values below 0.5% in the same months from 2022, meaning that YoY OER is likely to continue to increase at least slightly for several more months.

Meanwhile, as the YoY% graph including the Case Shiller and FHFA indexes indicate, YoY price increases have continued to decelerate sharply, down to +3.8% and +5.3% respectively as of January:


which (after /2.5 for scale) suggest that OER will be well contained by next winter.

As I wrote several weeks ago, CPI less shelter is only up +0.7% in the 8 months since last June, i.e., at only a 1.0% YoY rate:


In making its case for continued rate hikes, the Fed has ignored this and been hanging its hat on services inflation in the broader measure of. personal consumption expenditures, which will be released on Friday.

Tuesday, March 28, 2023

YoY house price gains continue to decline


 - by New Deal democrat


Today is a travel day so I have to keep this brief. 


On a monthly basis for January, prices rose 0.2% as measured by the FHFA house price index. But because that was far less of an increase in January last year, YoY house prices as measured by the FHFA index declined to +5.3%. This implies that by January next year OER as measured in the CPI will inly be up about 2.1% - well within the Fed’s comfort zone:


Unfortunately we still have at least several months to go before OER starts any kind of meaningful decline. Still, this is further evidence that the Fedcontinues to chase a phantom menace.

Monday, March 27, 2023

3 graphic signs of financial stress


 - by New Deal democrat


The theme of my weekly “high frequency” economic indicators update over the weekend was the sudden deterioration in some measurements of financial stress.


Tomorrow we’ll find out that house prices as measured by both the FHFA and Case Shiller have decline further, and that increases are substantially lower than as measured by the CPI, and on Friday we’ll find out what two of the NBER’s important measurements: real personal income and spending, as well as real manufacturing and trade sales, are, but since today there’s no big news, let’s take a look at those financial stress indicators I mentioned above.

First, the Leverage subindex of the Chicago Fed’s Financial Conditions Index got bigly revised last week (from gold to red in the graph below), to show that leverage is now more restrictive than at any times not shortly before or during recessions (compared with the YoY change in the Fed funds rate, blue, for comparison):


This tells us that credit has actually been pretty tight for the last year, and especially the past few months.

Second, the St. Louis Fed’s Financial Stress index, which had been below zero, i.e., un-stressful as late as one week prior, suddenly shot up to levels not seen outside the last several recessions (see sliver at far right), except for the Long Term Capital Management crisis of 1998:


Third, in the past two weeks 2.3% of all deposits have been withdrawn from smaller commercial banks:


The only other time except for the past week that deposits YoY in commercial banks have been negative was in 1985-86:


If you have any significant money on deposit, whether in savings, checking, or money market accounts, you would do well to find out what the highest interest rate a bank in your area is paying for new money, and then march into your current bank and demand that they match that rate, or you will pull your money out. Especially if your bank has been piggish about continuing to pay almost non-existent interest, chances are very good you will get what you want.

It’s getting harder and harder to find any signs outside of employment that are not flashing warning signs of recession in the immediate future, if not already here.