Saturday, June 25, 2022

Weekly Indicators for June 20 - 24 at Seeking Alpha


 - by New Deal democrat

My Weekly Indicators post is up at Seeking Alpha.

The weakness in the long leading indicators is increasingly spreading to the short leading indicators. The more this happens, the more inevitable a recession is, and the sooner it gets here.

As usual, clicking over and reading should be educating for you, and rewards me just a little bit for my efforts.

Friday, June 24, 2022

New home sales rebound, but downtrend in sales intact; prices continue to climb


 - by New Deal democrat

In response to April’s dismal report, I wrote that “new home sales are heavily revised after the first report. It is not unusual at all for big monthly moves like this to suddenly look much less severe when the number gets revised one month later. I would not be surprised in the slightest if that happened to this month’s cliff dive, when next month’s report comes out.”


That’s exactly what happened, as last month was revised higher by 38,000 to 629,000 units annualized. May came in at 696,000.

That’s still a big decline of -17% from their most recent peak last December, and -33% from their pandemic peak of August 2020 (blue in the graph below):


This is frequently - but not always! - consistent with an oncoming recession.

The particular value of new home sales is that, although it is a very noisy number, they frequently do peak and trough before either permits or starts, and did so again during this expansion. So for sales, this month was further confirmation that the declining trend is intact.

As to prices, in the graph above note that the median price of a new home (red) continued to rise. 

But the pace of the increase in prices has slowed considerably from +24% YoY last July to +15% in May:


In the past, as shown by the below comparison with the housing bubble and bust, prices have continued to rise sometimes for over a year after sales went into steep declines:


So prices may continue to rise for a number of months more before stalling or declining (and as I indicated the other day, I now expect significant declines).

Finally, sales and prices both lead inventory, as shown in the below graph including sales (blue) and inventory (gold) of new homes for sale:


Inventory is increasing even as sales decline. This of course is yet another reason to expect outright price declines soon. Just not as of yet.


Thursday, June 23, 2022

Resurrecting the metric: initial claims lead the unemployment rate; no recession signal so far


 - by New Deal democrat

 Initial jobless claims declined -2,000 to 229,000 last week, vs. the 50+ year low of 166,000 set in March. The 4 week average rose 4,500 to 223,500, compared with the all-time low of 170,500 eleven weeks ago.  Continuing claims rose 5,000 to 1,315,000, which is 9,000 above their 50 year low of 3 weeks ago:


Initial claims have been in an uptrend over the past 2.5 months. If this continues until the end of this month, they will no longer qualify as a “positive” in my array of short leading indicators, although they have not risen to levels that would change their rating to a negative.

Since the normal DOOOMers are baying that we are already in a recession, now is a good time to resurrect the construct that initial jobless claims lead the unemployment rate.

Why? Well, for example, the Sahm Rule is that when the 3 month moving average of the unemployment rate rises by 0.5% relative to its low in the previous 12 months, you’re in a recession. That’s somewhat conservative. On at least two occasions, 1953 and 1970, the unemployment rate only went up 0.1% for 1 month before a recession started. Paul Volcker started a recession in 1981 where the unemployment rate hadn’t moved up at all!

But in general, while the unemployment rate is a lagging indicator coming out of a recession, it is actually a negatively over-sensitive one, as it is a  slightly *leading* one going into recession.

With that in mind, here is the long term graph of initial jobless claims (red) vs. the unemployment rate (blue, right scale):


Typically a uptrend in initial claims leads an uptrend in the unemployment rate by 2-4 months.

Here’s the past two years:


The very mild uptrend in initial claims we’ve had in the past several months is similar to the one at the beginning of 2021 during the first winter wave of the pandemic. That led to a pause in the decline of the unemployment rate a few months later during spring 2021.

At worst, the current uptrend in claims (so far!) is consistent with a potential 0.1% uptick in the unemployment rate going into autumn.

Which means, while it’s not impossible, it’s very unlikely that the unemployment rate will signal the onset of a recession during that time.

Wednesday, June 22, 2022

Housing unaffordability closes in on bubble peaks; expect substantial price declines and increased foreclosures in the likely oncoming recession


 - by New Deal democrat

I last looked at the issue of housing affordability at the beginning of April. As we all know, mortgage rates have continued to skyrocket in the past several months. At present they are just under 6.10%:


This has changed the calculus on housing affordability considerably. So let’s take a look.

In April house prices in real terms were already almost identical to their 2006 highs. Depending on what house price index you use, nominally prices are up somewhere on the order of 60% since then. For example, here is a graph of new home prices and the FHFA index for the 2000s:


And here is the past several years:


Meanwhile the median price for an existing home peaked in July 2006 at $230,200. As we saw yesterday, as of last month they were $402,000. 

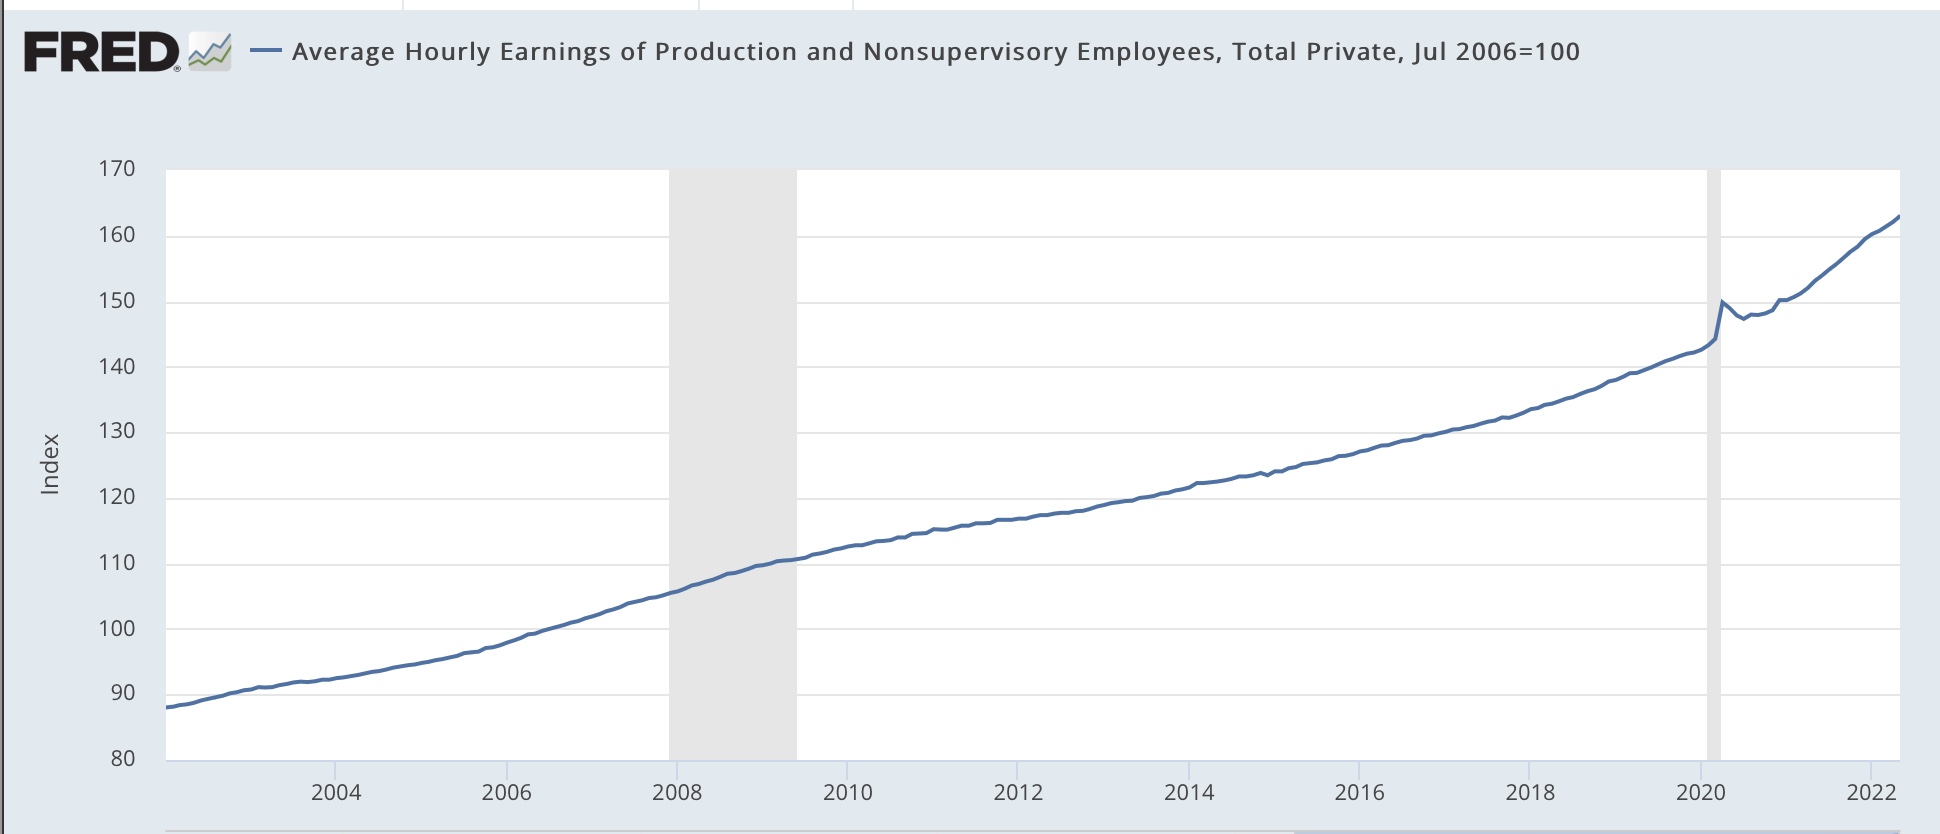
Average hourly wages for non-supervisory workers are also up a little over 60% since 2006:


Since in real, wage-adjusted terms, house prices are about the same now as they were at the peak of the housing bubble, let’s compare an identical mortgage then and now as well, for simplicity’s sake using $250,000, at the prevailing mortgage rates. Here’s the monthly payment for each:

April 2006: $1865.
July 2006: $1913.
April 2022: $1583.
June 2022: $1798.

The bottom line is that the average monthly mortgage payment has increased by about 13.6% in the past two months, and now is about 96% in real, wage-adjusted terms, of what it was at the peak of the bubble.

Even before yesterday’s report, the NAR’s “Housing Affordability Index” had dropped to 105 in April. How low is that? Well, for comparison here’s what the Affordability Index was during the 2000s:


At the worst of the housing bubble, it sat right at 100.

In short, housing is equal to its worst affordability levels in the past 35 years.

Frankly, I have been very surprised at this, since mortgage lenders are being much more careful now than they were at the peak of the bubble, when anything that fogged the mirror could get a loan.

This changes the calculus of the housing market - and the economy - going forward significantly. 

While I don’t see the banking system fallout that we had in 2008, when all the birds came home to roost on those ridiculous loans, creating a cascade of financial system defaults, I *do* now see it as being almost inevitable that there will be another significant decline in house prices that will last a number of years. This will trap a large number of younger homeowners in houses that are financially “underwater,” as they make payments on a house they can’t sell for the price at which they bought. And an increase in unemployment during a recession next year that looks increasingly inevitable will mean a substantial increase in foreclosures for some of these buyers as well.

Not so good.

Tuesday, June 21, 2022

Existing home sales: the freight train of price appreciation rolls on


 - by New Deal democrat

Although existing home sales are less economically important than new home sales, what has been happening with their prices, given the experience of the housing bubble and bust 15 years ago, is of added importance.


The simple summary is that sales have declined substantially, while price appreciation keeps rolling on.

Sales of existing homes were down 3.4% for the month, seasonally adjusted; down 8.6% YoY; down almost 20% from their January 2021 peak; and, at 5.41 million annualized, the lowest level since June 2020:


This isn’t a crash - at least, not yet. But it is certainly at a level consistent with an oncoming recession.

The story is completely different as to prices. At $407,600, the median price of an existing home increased 4.8% for the month and 14.8% YoY (Note: prices aren’t seasonally adjusted, so the YoY view is the best measure; graph does not show this morning’s data):


Prices were up over 25% YoY last June, so while this is a 40% deceleration, it is consistent with continued price appreciation if we were able to seasonally adjust.

Additionally, in May inventory was still down -4.1% YoY. Importantly, the NAR’s weekly update showed inventory increasing YoY in the last week of May and the first several weeks of June, so this may be the last hurrah for that metric.

Bottom line: Prices follow sales, and will in this case as well, but they haven’t - yet.


Monday, June 20, 2022

Coronavirus dashboard for June 19: documenting the transition from pandemic to endemic


 - by New Deal democrat

The COVID-19 pandemic is ever so gradually transforming into an endemic illness, the major risks of which still mainly fall on seniors.


Here is the long-term view of cases (dotted line) and deaths (solid line) in the US:


While cases are similar to the peaks of 2020, but far below those of 2021, deaths are lower than at any point except for June and July last summer.

Similarly, hospitalizations remain lower than at any point except several months during summer 2020 and 2021:


Focusing on the last 3 months, cases have been generally unchanged in the range of 100-110,000 for the past month, and deaths have varied between 250-330 for the past 1.5 months (the several gaps higher in deaths are due to periodic data dumps by North Carolina that can be ignored):


Essentially, both cases and deaths have plateaued at current levels, despite the changing landscape for variants, as Ba.2.12.1 replaced Ba.2, and now Ba.4&5 are increasing.

Here is the latest from Biobot, which tracks wastewater, an early warning system:


“Real” cases are down sharply in the Northeast, where Ba.2.12.1 was most prevalent, and slightly down in the Midwest and West, but rising again slightly in the Midwest.

We should know within a week or two whether the emergence of Ba.4&5 as the dominant strain is going to create any renewed wave or not. So far, very preliminarily, the answer is “not.”