Saturday, July 25, 2020
Weekly Indicators for July 20 - 24 at Seeking Alpha
- by New Deal democrat
My Weekly Indicators post is up at Seeking Alpha.
There was no significant change this week in any of the indicator time frames. I expect that to change in a hurry once the pain of the ending of the supplemental $600/week unemployment benefits is felt. That was all going to spending, and that spending is going to very abruptly stop.
As usual, clicking over and reading brings you up to the virtual moment on the economy, and rewards me a little bit for the work I do.
Friday, July 24, 2020
New home sales roar back to pre-pandemic levels
- by New Deal democrat
At some point - probably three or four months after Joe Biden takes the oath of office on January 20 of next year, G*d willing - the coronavirus pandemic is going to be brought under control in the US. At that point the long leading indicators are going to be very important in terms of the immediate direction of the US economy.
And the news on that score is very good, as shown by new home sales for June, reported this morning.
New home sales are extremely noisy and heavily revised, but they are the most leading of all of the housing metrics - even before permits. This morning they were reported at 776,000 units annualized (blue in the graph below), the highest since the onset of the Great Recession over 12 years ago:
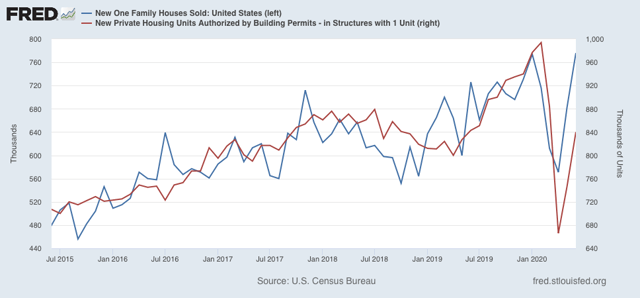
Single family home permits (red in the graph above, right scale) are much less noisy, and tend to follow new home sales with a slight lag of 1 to 3 months. As you can see, these also rebounded sharply in June, although only half the way back to their pre-pandemic levels. Based on low mortgage rates and new home sales, I expect building permits and starts to follow shortly, and return to pre-pandemic levels as well.
Because home construction feeds through into the broader economy over a period of 12 to 18 months, this will provide a tailwind for economic growth once the public feels safe in resuming normal activity.
Thursday, July 23, 2020
Initial claims: a jolt of bad news, as Mitch McConnell and the GOP dawdle on an emergency benefit extension
- by New Deal democrat
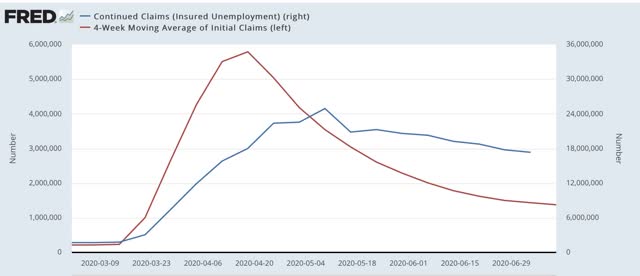
This morning’s report on initial and continuing claims, which give the most up-to-date snapshot of the continuing economic impacts of the coronavirus on employment, was a jolt of bad news, as claims increased by over 100,000 to the worst level in 4 weeks. The trend of slight improvement to “less awful” since the end of March was broken, and there was also a slight negative revision to last week’s number.
Here is the week over week % change since the end of March:
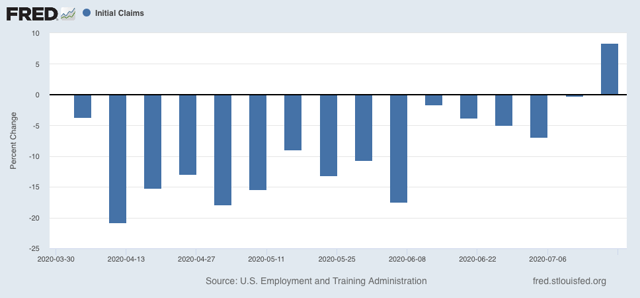
There were 1.416 million new claims, 109,000 more than one week ago.
Continuing claims (red in the graph below, right scale), which lag by one week, did continue to decline by just over 1.1 million, from 17.304 million to 16.197 million, as opposed to the increase in initial claims (blue, left scale):
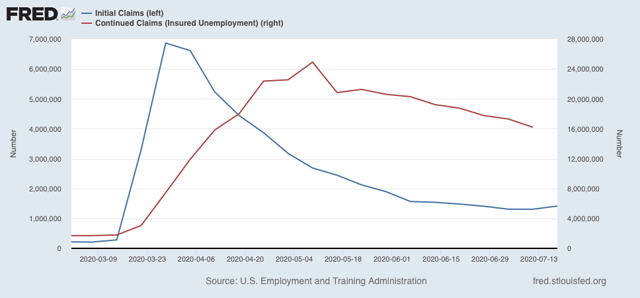
I expect continuing claims to also reverse and I move higher in the next week or two.
This morning’s report was discouraging on several levels. Having over 1 million new claims each week more than four months after the start of the pandemic means that severe economic damage continues to spread out. That claims rose means that the damage is starting to worsen again, presumably as some re-opened businesses close again, probably some of them for good. Finally, the $600/week Congressional emergency unemployment relief is expiring this week, which means that starting next week, the damage will be amplified considerably.
The lack of Congressional action can be laid entirely at Mitch McConnell’s feet. He deliberately waited until the benefits were set to expire, planning to hold them hostage and jam up House Democrats. Instead, his own caucus is apparently deeply fractured, and not on the same page as the White House. Since there is no deal that can be done in time, all of the pressure has boomeranged back on him and his caucus. I expect enormous pressure to be brought to bear for a simple, “clean,” extension of the emergency benefits, and the longer McConnell and the GOP dawdle, and the more they try to reduce the benefits, the worse the political damage will be for them.
Tuesday, July 21, 2020
The short leading indicators and the 2020 Presidential election forecast
- by New Deal democrat
As I pointed out on Sunday, polls and poll aggregations really aren’t forecasts, they are nowcasts. They tell you who would win and by how much *if the election were held today.* They don’t tell you whether or by how much that is likely to change over the next few months. Further, candidates, campaigns, and voters react to them, and so change the dynamics. And in the case of several of them, most notably Nate Silver’s aggregations, since they only give you *probabilities* of each candidate winning, in a fundamental sense they are non-falsifiable — e.g., “well I *told* you that Candidate X had a 6% chance of winning, my model was correct!”
Models based on economic fundamentals, however, *can* forecast, because in the case of leading indicators, what the data is likely to show on Election Day is “baked in the cake” months before. For example, the model based on Q1 polling plus the Index of Leading Indicators are the end of Q1 already forecasts a Biden victory, by a substantial margin. That’s because the Index is supposed to tell you what the economy might be like 6 to 8 months later.
Short leading indicators are those which forecast where the economy is likely to be over the next 3 to 8 months, rather than a year, later. Several decades ago, Prof. Geoffrey Moore identified 11 of them:
S&P 500 stock price index
Average workweek in manufacturing
Layoff rate under 5 weeks
Initial claims for unemployment insurance
ISM manufacturing vendor performance
ISM manufacturing inventory change
Journal of Commerce change in commodity prices
Change in deflated nonfinancial debt
New orders for consumer goods and materials
Dun and Bradstreet change in business population
Contracts and orders for plant and equipment
With the exception of the Dun and Bradstreet data (which I don’t think even exists anymore), the other 10 are still around, and the results through June are in for all but the two “new orders” categories. So taking a look at them ought to give us a good look at what the economy is likely to look like just before Election Day. To cut to the chase, they have all improved some of them almost back to pre-coronavirus levels, since April, but in general they are still worse than they were at the beginning of this year. So here they are in order.
S&P 500 stock price index:
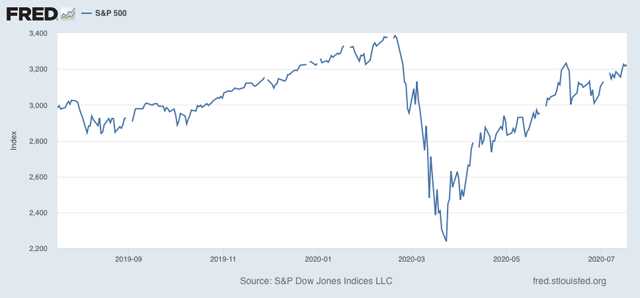
These have not made a new high since February, but have recovered over 3/4 from the March lows.
Average workweek in manufacturing:
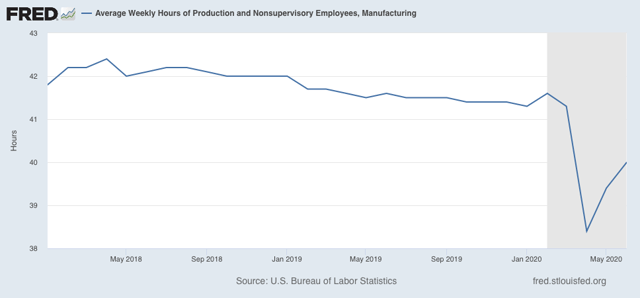
These have improved since April, but are still less than half the way back to pre-coronavirus levels.
Layoff rate under 5 weeks
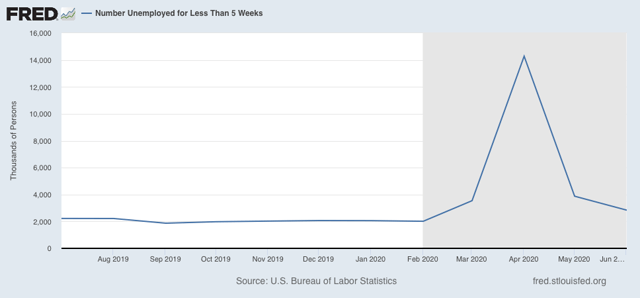
Initial claims for unemployment insurance
The former has improved by about 3/4’s from its worst levels. The latter has improved by about 90%. But both are still at levels comparable to their worst during the Great Recession.
ISM manufacturing new orders
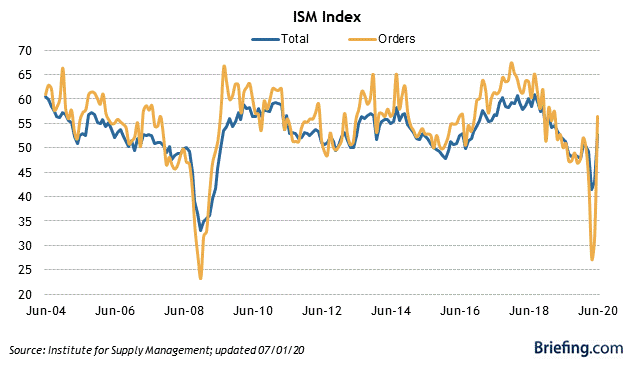
New orders have returned to expansionary levels.
Journal of Commerce change in commodity prices
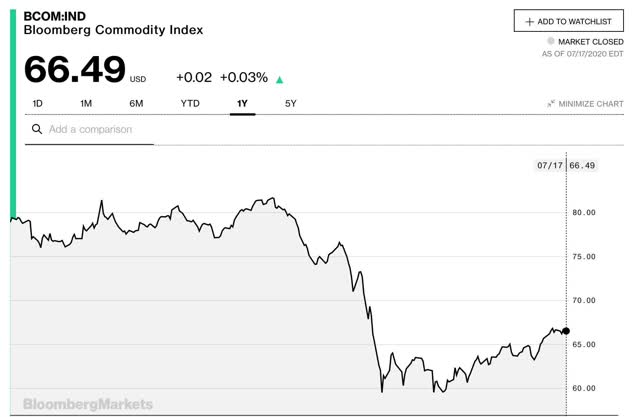
Commodity prices have only rebounded by about 1/3 to their pre-coronavirus level.
Change in deflated nonfinancial debt
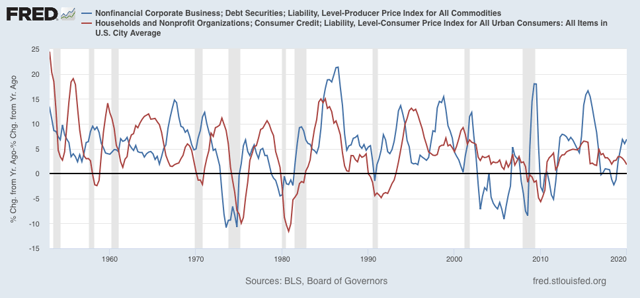
This is only updated quarterly. Through Q1, consumer nonfinancial debt was decelerating, while corporate nonfinancial debt was steady at an elevated level.
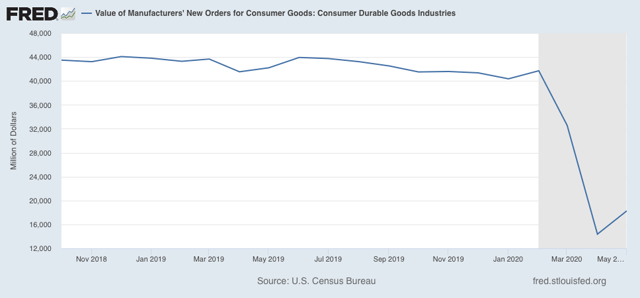
New orders for consumer goods and materials
Contracts and orders for plant and equipment
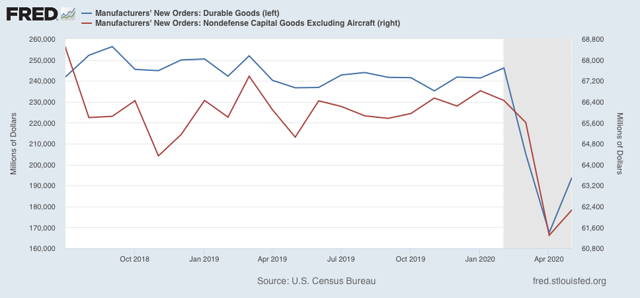
This data is only available through May. At that point, the rebound was slight compared with its decline when the pandemic struck.
Conclusion:
When we examine all of the short leading indicators, we see an economy that is set to improve in the next few months, but not all the way back to where it was before the pandemic struck in March. Needless to say, this will be affected by the course of the pandemic - whether it leads to partial or total shutdowns again, whether by edict or simply by lack of consumer confidence - between now and then.
Because Biden has been leading at all points this year, this points to a Biden victory, by more than the percent by which he was leading in the first quarter, but by less than he has been leading in the last couple of months.
Monday, July 20, 2020
Coronavirus dashboard for July 20: decisive evidence that deaths have increased since the beginning of July
- by New Deal democrat
Total US cases: 3,773,260
Last 7 days’ average: 66,903
Total US deaths: 140,534
Last 7 days’ average: 761
I have been waiting to see if the death rate remained elevated once the 4th of July week was completely out of the 7 day average (because there was an additional “slow” day caused by the holiday, followed by 4 “compressed” weekdays rather than 5. Those last 4 days continued to affect the 7 day average for, well, another 7 days. That period is over as of this past weekend, and here is the result:

There were 2.32 deaths per million Saturday and 2.31 deaths per million yesterday, the highest (excluding the NJ data dump several weeks ago) since June 11.
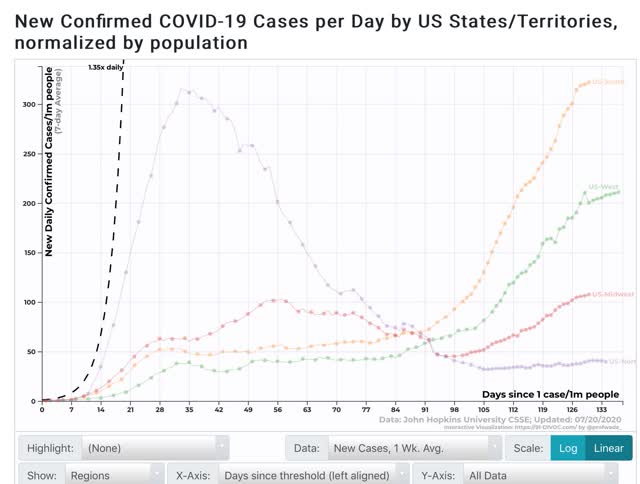
Regionally, in terms of cases, the South continues to be the worst, followed by the West, with the Midwest having a significant increase as well, and the Northeast a very slight increase:
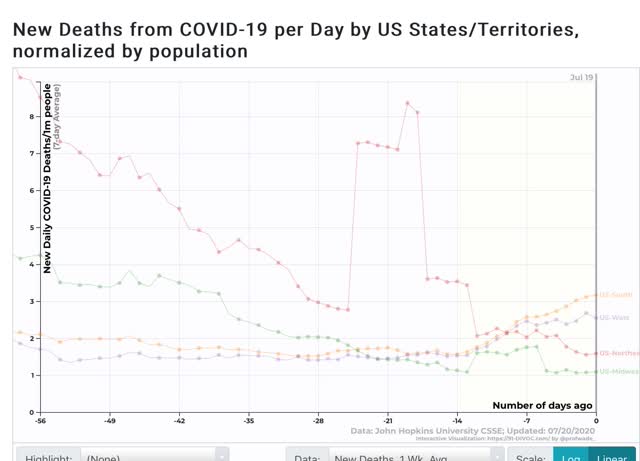
In terms of deaths, the Midwest and Northeast continue at their low levels, but only the Northeast has recently improved:
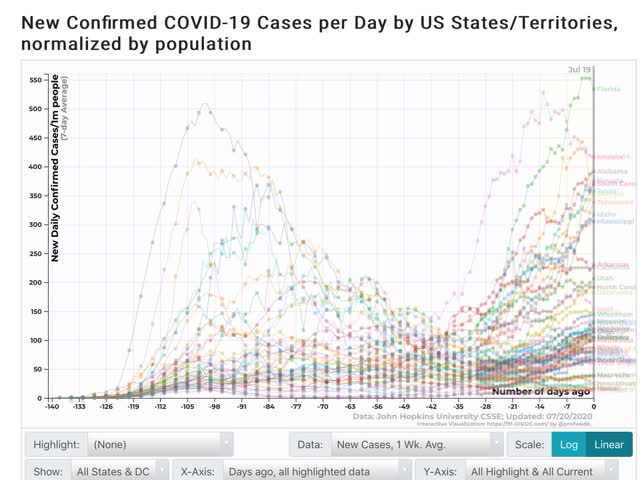
Turning to the States, in terms of cases, Florida has made an all-time high per capita, even exceeding NY’s old record, with Arizona, Louisiana, and Alabama close behind:
In terms of deaths, however, even Arizona, at 10 per million on average for the last 7 days is nowhere near the levels of NY, NJ, and several other States early in the pandemic:
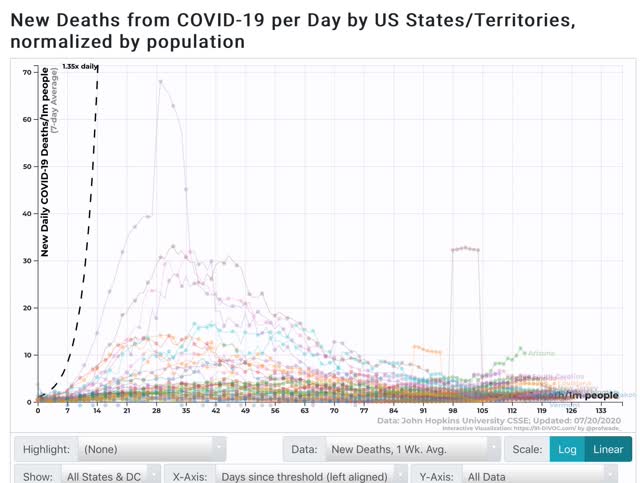
This is most likely demographics at work. Remember that 1/3 to 1/2 of all deaths in the first several months were at nursing homes and other assisted living centers, full of elderly people in poor health, together 24/7 with recirculated air. The pandemic went through them like dry tinder. More recently it has been younger people, with lower death rates, at bars, restaurants, gyms, and private parties who have been spreading the disease.
But the bottom line is that the evidence is now overwhelming that the increased infections that began at Memorial Day weekend have finally flowed through into deaths since the beginning of July.
Subscribe to:
Posts (Atom)