Saturday, October 27, 2018
Weekly Indicators for October 22 - 26 at Seeking Alpha
- by New Deal democrat
My Weekly Indicators post is up at Seeking Alpha.
Weakness, which had been confined to the long leading indicators, is now showing up in some of the short leading indicators as well.
Meanwhile, Trump's tariffs look like they are taking an immediate bite out of economic activity. In other words, all of that front-running that boosted inventory accumulation that showed up in Q3 GDP may be ending, replaced by a hole that has opened up under the mainly agricultural goods which have been the targets of China's retaliation.
Friday, October 26, 2018
A note on Q3 GDP UPDATED with link to Seeking Alpha
- by New Deal democrat
I submitted my piece on Q3 GDP to Seeking Alpha at about 9"30 this morning. As of now, they have not posted anything whatsoever from any author discussing this report. Dunno why.
Anyway, the takeaway is that this was a mediocre - not bad, just not particularly good - GDP report that was bolstered to the tune of 2% by inventory accumulation (probably front-running the increased costs of tariffs). And housing has most definitely turned.
I'll update with a link as soon as SA posts my take.
UPDATE: And, here's the link. One long leading indicator is still doing well. The other, not so much.
Thursday, October 25, 2018
When the stock market headlines the political blogs . . .
- by New Deal democrat
Here is a graph I saw on Digby's blog this morning:

There was also a highly-recommended, heavily-commented piece at Daily Kos.
Here's a pro tip: when you see a daily stock market move leading the political blogs, it's a sign of a bottom, not a top.
That's because it's a sign of emotion, and it means that amateurs are paying close attention. By the time that happens, the big move is over, or at least almost over.
Even with the big drop yesterday, the S&P 500 isn't down -10% from its recent high last month. That's not even a "correction," which typically happen at least once a year. We've had as big or bigger moves downward a number of times during this bull market, including a -20% down move in 2011.
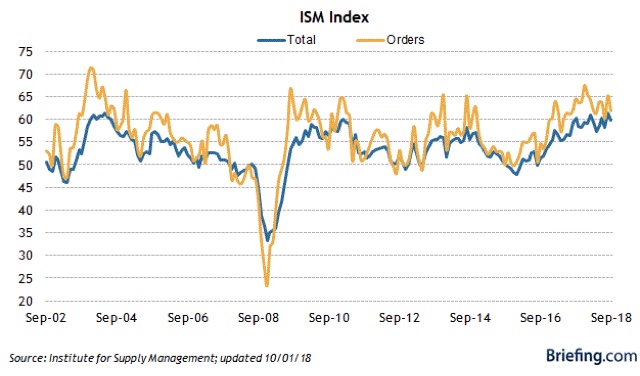
Could the market move still lower? Of course! In fact, a "re-test" of yesterday's low is likely. But in terms of this signaling a recession in the next 3-6 months? No way. The long leading indicators haven't turned decisively south yet, let alone other reliable short leading indicators like the ISM manufacturing surveys:
or even more reliable and less noisy, initial jobless claims:

These are well within their five year declining track, and show absolutely zero sign of stress. If they started showing up at 225,000 or higher for a few weeks, or went negative YoY, I'd start paying more attention. This morning's report was 215,000.
Yawn.
Wednesday, October 24, 2018
New home sales bombed in September
- by New Deal democrat
Needless to say, this morning's report on new home sales was another big miss in the housing sector. Not only were sales a new 12 month low, they were the lowest in nearly 2 years, and are off over -150,000 from their peak 10 months ago:

Typically new home sales are down about -200,000 when a recession starts.
That median prices have fallen in sync with sales, and not with their typical lag:

makes me think that the tax law change of last December, which capped the mortgage tax deduction in a way calculated to hit the highest priced housing markets the hardest, is a big driver of the decline.
Obviously this is not good for the economy next year, and bodes poorly for fixed private residential investment, which will be reported as part of Q3 GDP on Friday.
BUT, one important caveat: new home sales are among the most volatile, and most heavily revised, of all data series, which is why I pay more attention to housing permits. So it wouldn't be a surprise at all for most of this month's decline to be revised away in next month's report.
I'll have more tomorrow or Friday with my comprehensive housing update for the month.
Q3 2018 update: "Kasriel Recession Warning Indicator"
- by New Deal democrat
One of the methods I incorporate into my long leading indicators is the "Kasriel Recession Warning Indicator." This is something I first read about in 2007, when the eponymous Paul Kasriel, then of Northern Trust and now of Legacy Private Trust Co., wrote that it forecast a recession within the next year. Needless to say, his call was on the mark!
The indicator consists of a monetary and a yield curve component. Kasriel issued another forecast based on the model two months ago. I took a detailed look over at Seeking Alpha.
As always, clicking over and reading should be worthwhile for you, and also for me by way of rewarding me for my efforts.
Tuesday, October 23, 2018
An update on yield curve dynamics
- by New Deal democrat
So I submitted this wonderful piece to Seeking Alpha yesterday morning, and figured I would just link to it today. But as in the best laid plans of mice and men, somehow it reverted to a draft without ever being reviewed by the site's editors, which means it isn't up there yet and there is no big economic news today.
Sigh. So in the meantime, consider this ....
The bond market is behaving in totally typical fashion in response to the Fed raising interest rates. Typically the yield curve doesn't invert because long duration yields come down to short duration yields. Rather, *all* durations of yields rise. It's just that shorter duration yields rise faster, and ultimately overtake longer duration yields. Here's the relevant graph for the past 40 years:

If we think of interest rates as "the cost of renting money," then the economy slows because that cost increases across all time frames, and enough producers and consumers decide to put off "renting money" in order to purchase things that the economy slows down or goes into reverse.
Now here is a close-up on the same information since the beginning of this year. I've added +0.25% to the 2 year bond (red line) since my cutoff line for where I rate the yield curve as "neutral" is when the 2 year yield is within 0.25% of the 10 year yield:

In the above graph, we see that (a) both lines are rising, and (b) the red line overtook the blue line beginning in August. It took long rates rising to new 7 year highs above 3.10% to interrupt that dynamic. But if you look to the far right, you can see that in the past couple of days the lines are converging again. As of this morning the 2 year yield is only 0.27% less than the 10 year yield, even with the 10 year yield at 3.15%.
If the recent trend continues, we will probably see an inversion in the 2 to 10 year yield spread by St. Patrick's Day next March. I already see enough signs out there to have forecast a slowdown in the economy by roughly midyear next year. If I'm correct, the outstanding question will be whether the Fed reacts by lowering interest rates again quickly, or else stubbornly sticks to its "normalization" rubric and thereby brings about a recession. This in turn may depend upon whether producer price inflation rises again and leaks over into consumer prices.
Monday, October 22, 2018
A follow-up on the reasons for prime age labor force non-participation
- by New Deal democrat
Here is something interesting I found in an article by staffers at the Kansas City Fed a couple of weeks ago.
They broke down the 25-54 prime age labor force participation group for men into 10 year slices, by education, and by reason for not participating in the labor force. They focused on men, because including women confounds the results by the secular societal change whereby women entered the labor force en masse between the 1960s and 1990s.
First of all, it turns out that the prime decade driving the increase in non-participation is the 25-34 age group:
First of all, it turns out that the prime decade driving the increase in non-participation is the 25-34 age group:

That finding is amplified by breaking down each prime age decade by education level:

Across all age levels, the biggest jumps by far in non-participation were among those with high school degrees and some college, and especially so among the youngest decade.
Next, they broke down non-participants by the reason given for non-participation, using the monthly household survey that is issued as part of the jobs report. The Census Bureau asks non-participants if the reason they are not in the labor force is disability, family care, education, retirement, or other:

In accord with the above, among the 25-34 age group, the biggest jump in the reason for non-participation was education. Interestingly, among the 35-44 and 45-54 age groups, the big increases were family care and retirement(!). The rate of those claiming disability actually decreased (a big surprise). These increases were similar across all levels of educational attainment.
I have two takeaways from this: first, there is likely an "education arms race" going on, where ever-increasing levels of education are deemed necessary in the competition to obtain good-paying jobs. Seventy-five years ago, a high school degree is what was necessary. Forty years ago it was a college degree. Now it may take a graduate degree. Ultimately this is a self-defeating waste of resources, and worth its own lengthy article.
I have two takeaways from this: first, there is likely an "education arms race" going on, where ever-increasing levels of education are deemed necessary in the competition to obtain good-paying jobs. Seventy-five years ago, a high school degree is what was necessary. Forty years ago it was a college degree. Now it may take a graduate degree. Ultimately this is a self-defeating waste of resources, and worth its own lengthy article.
Second, this is evidence for the "child care cost crunch" I wrote about several years ago. As the cost of daycare has increased, and wage growth has decreased, an increasing share of households are finding that it makes more sense for one spouse -- in this case, "Mr. Mom's" -- to stay home and raise the kids.
Subscribe to:
Posts (Atom)