Friday, June 9, 2023

Real business sales estimate: up 0.3% in April, but still below January peak


 - by New Deal democrat


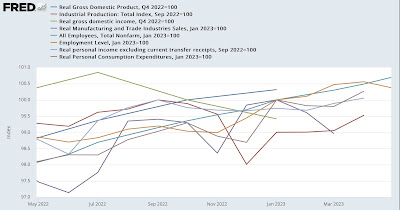
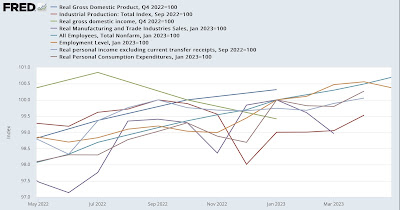
Let me start today by re-upping this graph of the current state of the coincident indicators mentioned by the NBER as data that they track:


As I wrote earlier this week, the two positives keeping the economy in expansion are real spending on services, and jobs. The other indicators are either flat or down from their peaks. In fact I’ve mentioned a number of times that at the moment the monthly report on personal income and spending is one of the two most important datapoints for the economy, along with nonfarm payrolls.

In that regard, I hope to have some Major Economic Analysis next week (maybe Monday) of some leading and (relatively) lagging aspects of the Personal Income and Spending report that will help us understand why they are where they are now, and where the more lagging aspects are likely to go in the near future.


So tay tuned. In the meantime, since there is no noteworthy economic news today, let me update some nerdy analysis about another one of those coincident indicators, real business sales.

The problem with the real business sales data is that it comes out two months after the month on which it reports. I’ve come up with several methods to make more timely estimates. The preliminary method (less reliable) is to average industrial production and real retail sales. The final method is to average the total of manufacturing, wholesale, and retail sales by 3 PPI measures plus CPI.

We won’t get manufacturing sales for April for another week, but in the meantime yesterday we did get wholesale sales. This allows me to do an intermediate measure by averaging industrial production, wholesale sales, and retail sales deflated by the 4 inflation measures mentioned above.

Here is what nominal total business sales (blue) and the intermediate estimate (red) look like since just before the pandemic:


Here is the month by month comparison:


You can see that this estimate does a very good job of capturing the monthly changes as well as the overall trend. I won’t bother with the long term chart, but the same holds true going all the way back to the start of the data.

For April, the intermediate estimate above rose by 0.4%.

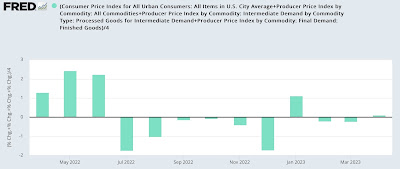
Next, here is the monthly breakdown of the 3 PPI and CPI measures for the past 12 months:


In April, the average measure was up 0.1%.

Subtracting -0.1% from the 0.4% nominal gain gives us an intermediate estimate of real manufacturing and trade sales for April of +0.3%. That takes back some of March’s big decline, but still leaves us -0.7% below the January peak.

The official data won’t get reported for 3 more weeks, along with the May update for personal income and spending.

Thursday, June 8, 2023

Initial and continuing claims: yellow caution flag reinstated


 - by New Deal democrat


Initial claims rose sharply last week, up 28,000 to 261,000 (an 18 month high). The 4 week average rose 7,500 to 237,250, still lower than its April peak. Continuing claims, with a one week delay, declined -37,000 to 1.757 million:


When we had a similar spike a month ago, it turned out to be a artifact of mis-reporting by Massachusetts, so take this with a grain of salt until we have more clarity that it won’t be revised away.

Nevertheless, with that caveat YoY weekly claims are up 18.1%. The more important 4 week average is up 10.3%, and continuing claims are up 27.1%:


As I wrote last week, continuing claims have never been this much higher YoY without a recession having already started. The 4 week average, having risen back over 10%, merits reinstatement of the yellow caution flag.

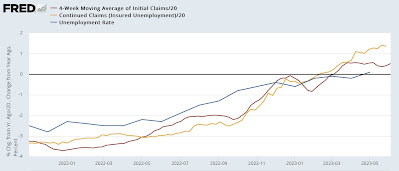
Here is an updated look, with this week’s data, of initial claims YoY vs. the unemployment rate (remember that the former leads the latter):


The implication is that the unemployment rate is likely to rise at least slightly more during the next several months.

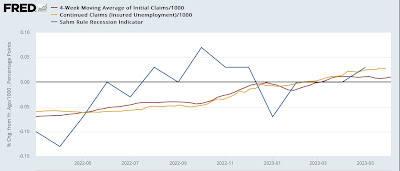
Finally, because the Sahm rule for recessions lags even the turn in the unemployment rate, both initial and continuing claims lead that as well (note: claims /1000 for scale)


The current Sahm rule value is +0.03; +0.5 is the trigger level, which typically occurs after a recession has already started. By that time the median YoY% increase for claims has been 20%+.

So, the yellow flag is reinstated; but it is only one week’s data. I would need to see the 4 week average higher by 12.5% or more for a full month before it triggers a recession warning. Which would include of course an implication of a significantly higher unemployment rate.

Wednesday, June 7, 2023

Scenes from the employment report: an important trend in self-employment; and real aggregate payrolls


 - by New Deal democrat


We’re still in the week of drought following the payrolls release last Friday. Today let’s take a look at a few more items of interest from the Household Survey side.


As you probably recall, the bottom line employment numbers in the 2 reports diverged sharply in May, with the Establishment survey showing a 339,000 gain, but the Household survey showing a -310,000 decline.

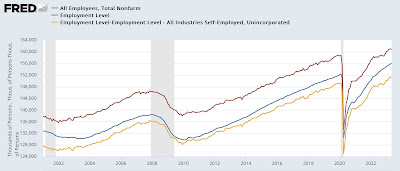
I have to credit a commenter at Econbrowser for this, but it turns out what made the lion’s share of difference was self-employment. And it turns out that self-employment has been a significant player for over 2 years.

Here is what the number of reported self-employed looks like for the past 30 years:


While there’s no overwhelming driver as to the overall number, there’s no denying that there was a big surge in reported new self-employment in the year after the pandemic hit. This peaked at about 10.3 million in July 2021. As of last month, it had declined all the way back to its pre-pandemic baseline of the previous 10 years at 9.4 million.

It’s a noisy series, and a rebound in June would hardly be a surprise. But in general, the number of self-employed has declined on average about 40,000 each month for the past 2 years. It’s also worth noting that in the past 30 years, a declining trend in self-employment has been in place before each recession, which makes perfect sense, although the data is noisy enough over the longer term that I don’t want to go beyond that.

But also, since the self-employed are not counted in the payrolls survey (blue in the graphs below), once you subtract them from total employed in the Household survey (red), you get a number much closer to the payrolls number:


And when you look at that monthly since 2021, you see that self-employment has been a major contributor to the Household survey’s overperformance then, and its underperformance since March of 2022:


In particular, in the past year in all but 2 months, non-self-employed employment in the Household survey has been better than the headline number, and significantly closer to the payrolls number.

Which leads to an interesting proposition: that with a tight labor market, higher pay, and many companies continuing to allow work from home, about 40,000 self-employed each month have decided to become employees. Since both sides of the transaction are counted in the Household survey, but only the gain in employment at a firm is counted in the Establishment survey, this accounts for about 40,000 a month in payrolls’ relative outperformance.

Next, let’s turn to one of the best “fundamental” indicators in the report: real aggregate payrolls. This tells us how much the working/middle classes in the US as a whole are taking home, in terms of buying power. As shown in the YoY graph below, it has had an excellent record in nowcasting expansions and recessions:


If YoY inflation is higher than YoY aggregate payroll growth, you’re in a recession. Otherwise, you’re in an expansion. Note that in the case of several slowdowns that were not recessions, notably 1966, 1984, and 1995, the two lines came close to crossing but did not do so.

Here’s what the same data looks like since the pandemic:


Since last September, the two lines have gotten no closer, and have even parted a bit, consistent with a slowdown that has not been a recession.

Here’s what that looks like on a monthly as opposed to YoY basis:


Although nominally aggregate payrolls growth has been erratic this year, it is holding up at better than +0.5% on average per month. Meanwhile inflation has been generally abating since last June. We can expect this trend in inflation to continue at least for the next several months until gas prices no longer compare with the spring 2022 spike.

Bottom line: real aggregate payrolls is perhaps the best single datapoint arguing that the 2022-23 slowdown has not turned into a recession, and that is likely to continue in the immediate future.

Tuesday, June 6, 2023

The consumer may finally be faltering


 - by New Deal democrat


At this point I think the “smart” econ take is that either any recession is very much delayed, or even not going to happen at all. While everything is possible, I’ve argued in several places that if you date a potential business cycle peak to January of this year, the data doesn’t look so rosy.


To wit, below is a graph with all of the main monthly data series the NBER has said it relies upon normed to 100 as of January, with the exception of industrial production and real personal income, which are normed to their prior peaks of September 2022. The two quarterly series, real GDP and GDI, are normed to Q4 2022 to better show their increase/decrease in Q1 of this year:


As of their last readings, industrial production, real manufacturing and trade sales, and real GDI are all below 100. Real personal income less government transfer payments is only 0.1% higher. The only series significantly higher are the Establishment and Household employment numbers, plus real personal spending. In fact, most of the Q1 increase in real GDP was the big increase in real personal spending in January.

Further, we can decompose real personal spending into goods vs. services spending, below:


The *entirety* of the real personal spending increase since January has been on services, not goods (goods are very much affected by gas prices, so the increase in the 2nd half of last year was very much about the big decline in those prices).

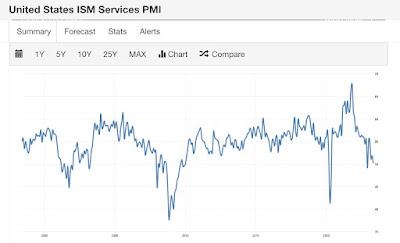
So yesterday’s report of the ISM non-manufacturing index is unusually important.

Normally I don’t pay too much attention to this release, partly because it only has a 25 year history, partly because there were methodology revisions just as the 2008 recession hit, and partly because it is a nowcast rather than a leading indicator.

But yesterday’s report was the 3rd reading in a row below 52, at 50.3 (50 being the dividing line between expansion and contraction). Here is the long-term view of the entire series:


Two things ought to stand out as important: (1) this series crossed 50 to the downside right at the onset of the last 3 recessions, in May 2001, January 2008, and May 2020; and (2) the sharp decline in the values of this index also are comparable to the sharp declines just before or the onset of the 3 last recessions well.

In other words, this index looks now just like it has at the outset of all 3 recessions since it came into existence.

Yesterday the manufacturers’ new orders reports also came out. The good news is, both total new orders and core capital goods orders (leading indicators!) both made new all-time highs, at least in nominal terms:


But the consumer side showed declines for both durable and non-durable goods. Here’s the long-term view, showing declines in consumer durable goods (blue) before all 3 of the last recessions, and non-durables only following later:


Here is the close-up since July 2021:


Non-durables have actually declined more than durables, but all are now in decline.

There’s no clear correlation between new consumer goods orders and consumer spending, but let me conclude with this. Here is the long-term view of the monthly % change in real personal spending up until the pandemic (the series only began in 2002):


And here is the same data since July 2021:


While there is usually at least one monthly decline each year, and occasionally 2 in a row, beyond that it only happened during the Great Recession. We’ve had 4 declines in the last 6 months.

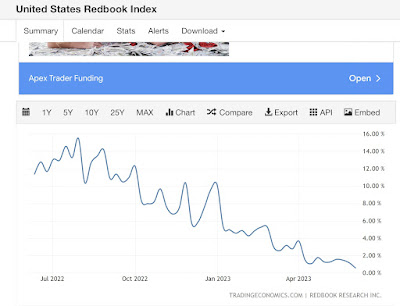
Meanwhile, as I have been composing this piece, the weekly Redbook consumer spending report came out at +0.6% YoY, the weakest number since the pandemic recession:


The consumer may finally be faltering.

Monday, June 5, 2023

Scenes from the May employment report: leading indicators and the big picture


 - by New Deal democrat


As I wrote Friday, the May employment report was deeply bifurcated, with a strong Establishment survey, but a weak Household survey.  


Let’s take a look at some of that bifurcation, focusing on the leading indicators.

There are 4 leading indicators in the Establishment portion of the report: manufacturing, residential construction, and temporary help jobs; plus the manufacturing work week. These are not my discoveries; they have been known for decades. In the Household survey, short term unemployment is also a leading indicator.

Here’s what these 3 sectors looked like before the 2001 ad 2008 recessions:


While there is no fixed pattern, in both cases they declined beginning about a year before the onset of the recession, and they declined significantly, generally by substantially more than 5%.

Turning to our present situation, in May, manufacturing jobs declined slightly, the manufacturing work week was unchanged, and both residential construction and temporary help jobs gained. Here is what their trends look like in the past 2 years:


All three have likely peaked, perhaps manufacturing just now. But with the exception of temporary help jobs, the scope of the decline is far less than before both of the above recessions. In great part, this is due to the continuing effects of supply bottlenecks in the construction and vehicle manufacturing industries.

Next, here is the long term view of the manufacturing work week:


I don’t need a closer-in view for.this metric, because it is easy to see that it has declined by close to 1.0 hour, totally consistent with its declines before nearly every recession in the past 75 years.

Note that until 1980, hours normally had to decline below 40 to be consistent with the onset of recession. Since then, “leaner and meaner” factory production has meant fewer staff with more overtime. But the present level is consistent with its level before the last 3 recesssions before the pandemic.

Now let’s turn to the Household survey. Here’s a long-term view of short term unemployment of fewer than 5 weeks (blue, left), with the 4 week average of initial jobless claims (gold, right):


Both are somewhat noisy, but initial claims are far less noisy than the 0-5 week unemployment metric, and initial claims also tend to lead by a short period of time.

Here is the present situation:


While initial claims have turned higher, there is no discernable trend to the short term unemployment metric in the jobs report - at least not yet.

On the other hand, the unemployment rate turned 0.1% higher YoY, just as I suggested last week that it might in my discussion of initial jobless claims, which turned higher YoY in March:


Once again, initial claims have led the unemployment rate.

Finally, one graph giving the most important Big Picture reason of why the weakness in the above leading indicators hasn’t translated into negative or even objectively weak job growth.

Below shows the number of people in the civilian labor force (blue), plus additionally those not in the labor force but who nonetheless say they want a job now (gold). By definition, everybody else is out of the labor force and doesn’t want a job at present (e.g., they are retired). This is contrasted with real personal consumption expenditures (red). All are normed to 100 as of the onset of the pandemic:


Even including those who want a job but haven’t actively sought one, the potential labor force has only grown about 2% since then. But consumption, even after adjusting for inflation, has grown over 8% and the trend is still higher.

Typically over time real consumption has increased annually about 2% faster than the labor force. But in the last 3 years, it has grown about 3% faster on average. 

There are simply a lot more jobs available to take care of that increased demand. But there still aren’t enough potential employees to fill the slots, even though the imbalance has gotten much less extreme (see also the continuing elevated “job openings” level in the last monthly JOLTS repot). Since in the aggregate employers can make more money by filling those slots, even at higher wage rates, employment has continued at a strong if decelerated pace.