Saturday, September 9, 2023

Weekly Indicators for September 4 - 8 at Seeking Alpha


 - by New Deal democrat


My Weekly Indicators post is up at Seeking Alpha.

The tug of war between the headwind of high interest rates and the tailwind of low commodity and consumer inflation continues.

As usual, clicking over and reading will bring you right up to the present on the data and bring me a smal $$$ reward for my efforts.

Friday, September 8, 2023

Coronavirus update: the virus is back; everyone should return to their prior precautions and get boosted this fall


 - by New Deal democrat

At the beginning of this year, I indicated that I anticipated only writing about Covid if something significant was happening.  It is, so let’s look at the data.


Almost all State and Federal testing data is gone, but we do have a very good source in Biobot’s waste monitoring. Here’s the long term view (truncated to eliminate the huge original Omicron spike):


The number of particles per milliliter has nearly quadrupled since late June, from 165 to 618. In the past, this has equated to roughly 125,000-150,000 new cases per day.

All 4 Census regions of the country are affected:


Through one week ago, daily new hospitalizations - which in the past lagged infections by about a week or so - have nearly tripled, from 6,300 to 17,400, the highest level in almost 6 months, and only about 5,000 below last autumn:


And weekly deaths, which in the past has lagged several weeks behind hospitalizations, have also increased from below 500 to over 600:


It is very important to note that the last reliable deaths data (blue in the graph above) is from a full month ago. We already know that the following two weeks (gray) had higher death tolls, but we don’t know by how much. If deaths quadruple as cases have, then we will probably find out by Halloween that by the end of September there were about 2,000 deaths per week, which is back in the range of much of the earlier part of the pandemic.

Why has the wave that started this summer persisted? It does not appear because any of the new subvariants, particularly EG.5 and BA.2.86, are particularly virulent. Indeed, indications are that the next round of boosters, which were tailored to XBB, are highly effective against these variants as well. Rather, as explained in the linked CNN article, tests have indicated that “The people with the highest neutralizing antibodies were those who had recently recovered from an XBB infection.”

In other words, very few people have had new booster shots within the past 6 months, and we know that resistance from mRNA boosters wanes after 4-6 months. The very fact that there were so few new infections in the spring and early summer means that many more people have less resistance now.

The bottom line is, everyone should be going back to their Covid safety precautions, like wearing masks in indoor public places, and everyone eligible should sign up for the new booster this autumn.

Thursday, September 7, 2023

Despite 6+ month low in initial claims, yellow caution flag remains


 - by New Deal democrat


Last week the initial claims numbers justified restarting the yellow caution flag. This week initial jobless claims declined -13,000 to a 6+ month low of 216,000. The 4 week moving average declined -8,500 to 229,250. With a one week lag, continuing claims declined 40,000 to 1.679 million:


Since last year ago at this time also saw a steep decline, it is possible that there is some unresolved post-pandemic seasonality in these numbers.

The YoY% changes were +9.6% for the weekly number, +11.3% for the more important 4 week moving average, and +27.6% for continuing claims:


Additionally, and most importantly of all, the monthly average for August was up +13.1%:


Recall that in the nearly 60 year history of claims, 2 consecutive months of YoY% increases in excess of 12.5% have more often than not meant that a recession is close to beginning. Between the monthly YoY increase, and the +10.3% increase YoY in the 4 week average, there is enough to justify a yellow flag caution - although if we continue to get numbers like this week’s 216,000, that won’t last long.

Wednesday, September 6, 2023

Scenes from the August employment report - and a warning


 - by New Deal democrat


The weekly lull after last Friday’s employment report will end tomorrow. In the meantime, let’s take a deeper dive into a few important trends in that report.


First, the unemployment rate rose 0.3% to 3.8% - which is totally not surprising at all.

As I wrote last Thursday, initial jobless claims have a nearly flawless 60+ year record for forecasting the trend in the unemployment rate. Here’s the supporting graph:


The red line (the unemployment rate measured YoY) follows the blue line (initial jobless claims) almost like clockwork.

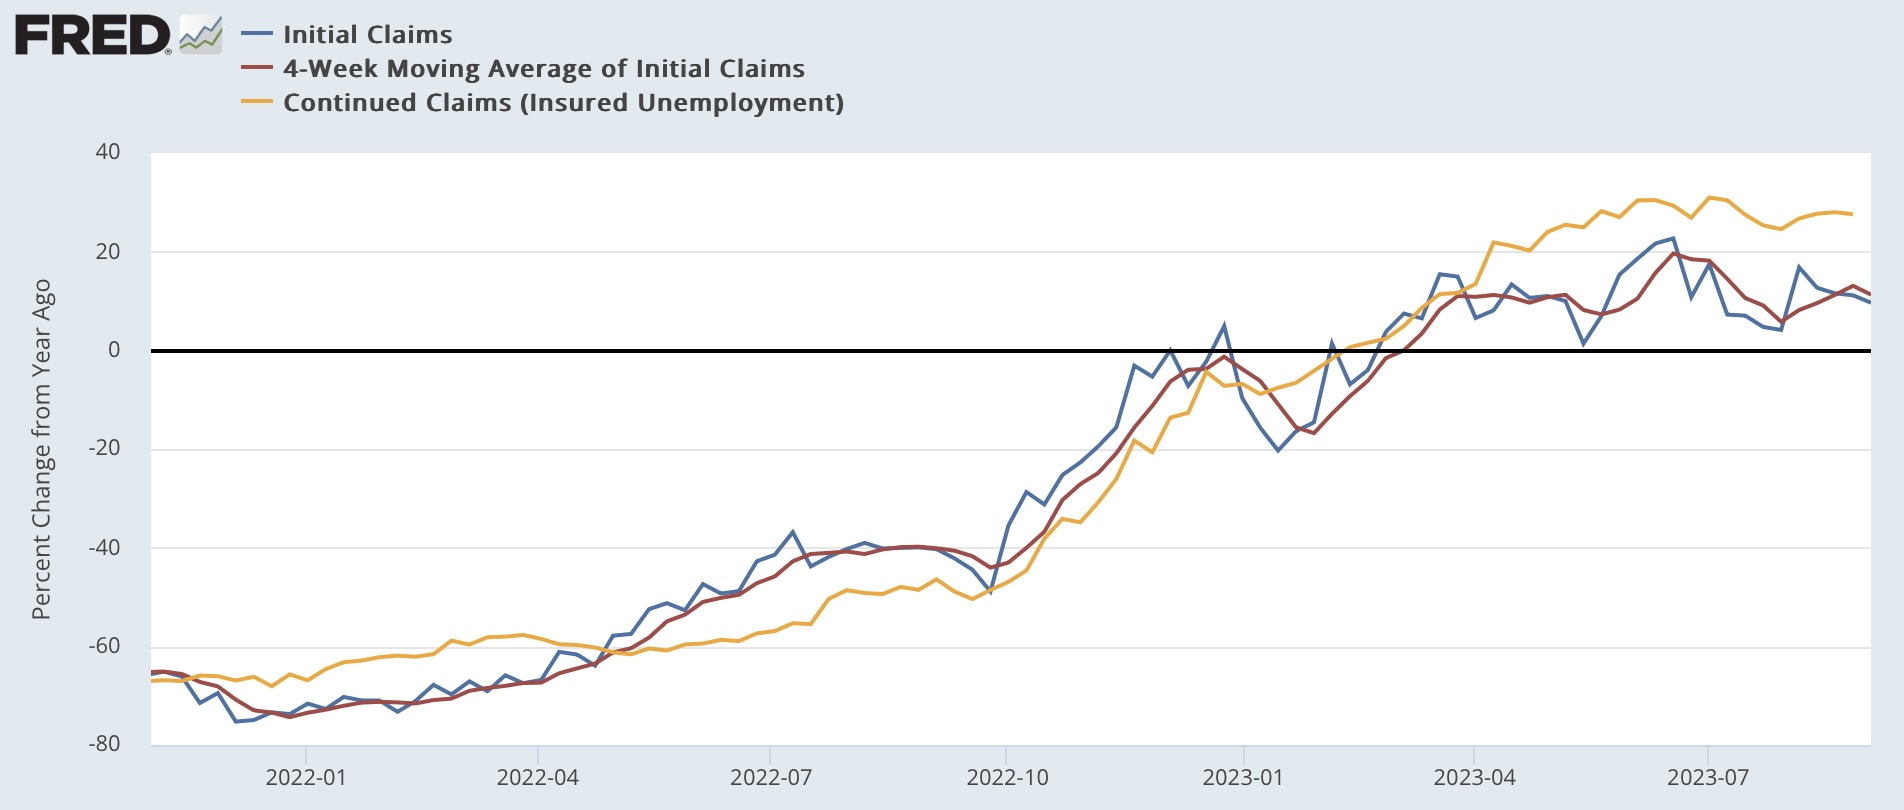
Here’s the past two years of the same graph:


Initial jobless claims turned higher YoY in March. The unemployment rate has followed. With jobless claims up about 10% YoY, an increase from 3.5% to 3.8% or 3.9% (i.e., 1.1*3.5%) was right in line with the forecast.

Although it would take several months of a 4.0% or higher unemployment rate to trigger the Sahm recession Rule, one similar unemployment rate-based metric has been triggered, which compares the short term monthly average of the unemployment rate with its 12 month average. If both are rising, and the former turns higher than the latter, in the past 50 years that has *always* signaled a recession, with *zero* false positives or false negatives:


Meanwhile, the deceleration in monthly jobs gains, on average about -20,000 per month, has continued for 2 years now:


If this trend continues, we will get actual job losses in about 9 to 12 months.

In general, goods employment turns south before a recession begins, while services employment only follows later, and may never turn negative YoY. I track a variety of leading jobs sectors in my monthly blurb. Here’s what total goods employment (red) looks like compared with a number of other leading sectors, all normed to 100 as of August:


You can see that several - temporary jobs, residential construction, and trucking - have already turned down. Manufacturing jobs are flat. Only total construction jobs are still rising strongly. 

Finally, as I’ve frequently noted, real aggregate payrolls are an excellent coincident recession indicator. When working and middle class households earn less money in real terms, they have always cut back spending, and this marks the onset of recessions. Here’s the long term comparison of total payrolls YoY (blue) vs. CPI YoY (red):


There are no false negatives, and only one arguable false positive (2002, a near miss) in the past 60+ years.

Here is a close-up on the last four years:


The YoY% change in wage gains is a long lagging indicator, starting up only after unemployment and underemployment decline, and also after the rate of job openings (red in the graph below) increases:


With job openings continuing to decline, the YoY% of wage gains (a component of aggregate payrolls) is likely to continue decelerating. But, as a number of writers including myself have pointed out in the past several months, gas prices have resumed increasing (spiking over $90/barrel yesterday):


making it more likely that the CPI YoY will increase.

Decelerating wage gains and increasing CPI means it is more likely that real aggregate payrolls will turn negative in the coming months, signaling recession.

And what should be of special concern is that a US recession in 2024 that causes Biden to lose and Trump to return to power is just about the #1 foreign policy priority of both Russia and Saudi Arabia, both of which have announced curtailment of their oil output in the past several weeks.

Tuesday, September 5, 2023

Vehicle sales and residential and manufacturing plant construction continue to outweigh general manufacturing downturn


 -  by New Deal democrat


No important economic news today, but on Friday in addition to the employment report we did get our typical 1st of the month snapshot of manufacturing, vehicle sales, and construction, so let’s look at each.


The ISM manufacturing index has had an excellent record going all the way back to the 1940s, but it has one drawback which is that it is a diffusion index, so if 90% of manufacturing is in slight decline, but 10% is going gangbusters, it will not accurately reflect the overall situation.

And that exception is probably the case now.

For the past year, the new orders subindex has been below 50, indicating contraction. The overall index joined several months later. Last month in August, they were both still in contraction, although slightly “less worse” than in July:


The readings all this year and even at the end of last year frankly indicated recession. And yet, here we are, with no recession.

The reason why can probably be found in the next two graphs, which are light vehicle sales (blue) vs. heavy truck sales (red, right scale), which report was also released on Friday.. First, here’s the historical look:


These have always turned down in advance of recessions. In particular, heavy truck sales have turned down generally well in advance, and with much less noise. 

Here is the current look:


Light vehicle sales have not turned down at all. Heavy truck sales have declined from their peak in the past two months, but are still above any other month during this expansion up until May of this year. I would need heavy truck sales to turn below 500,000 annualized (.500 on the right scale in the graph) before I would consider the downturn true signal.

Further support for why the general downturn in manufacturing has not manifested in a recession comes from the construction spending report for July which was also released on Friday.

Construction spending on manufacturing plants, subsidized by last year’s Inflation Reduction Act, has stabilized, but at a level 50% above any previous amount before 12 months ago:


Both total construction spending and spending on construction of residences also increased nominally, the former to yet another all-time high, the latter continuing its rebound from last winter:


Deflated by the cost of construction materials, residential construction spending still rose, to about the mid-point of its post-pandemic average:


Until we see the vehicle manufacturing and residential construction sectors roll over, we almost certainly are not looking at any economic downturn.