Friday, September 13, 2019

August retail sales confirm healthy consumer sector


 - by New Deal democrat

Retail sales are one of my favorite indicators, because in real terms they can tell us so much about the present, near term forecast, and longer term forecast for the economy.

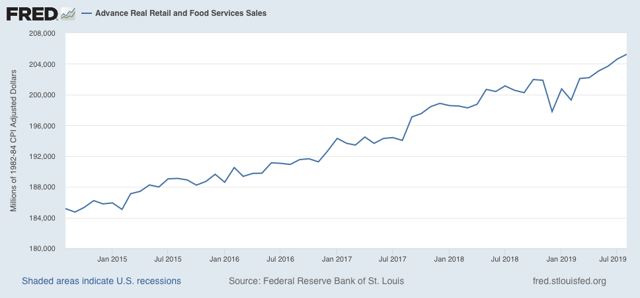
This morning retail sales for August were reported up +0.4%, and July, which was already very good at +0.7%,  was revised upward by another +0.1% as well. Since consumer inflation increased by +0.4% over that two month period, real retail sales have risen +0.7% in the past two months. As a result, YoY real retail sales, which had been faltering earlier this year, are  now up +2.3%.

Here is what the last five years look like:


Others may use other deflators. I use overall CPI because:
1. I’ve been doing it this way for over 10 years. 
2. This is the deflator used by FRED.
3. It has a 70+ year history.
4. Over that 70+ year history, it has an excellent record as a short leading indicator for employment and recessions. That’s the kind of track record I like.

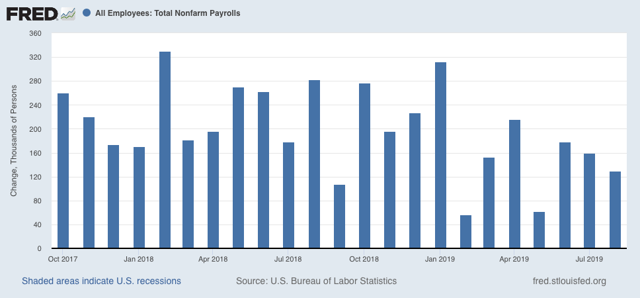
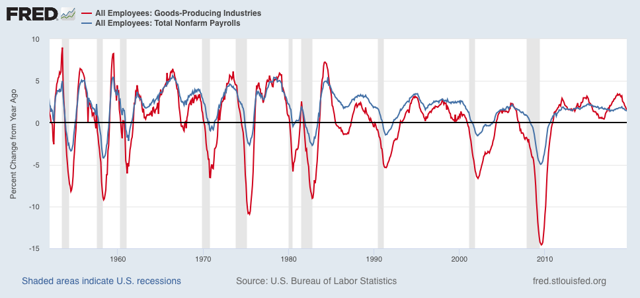
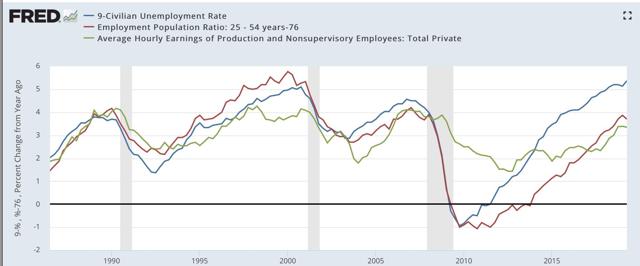
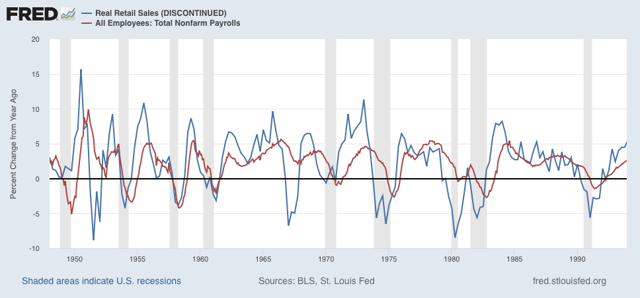
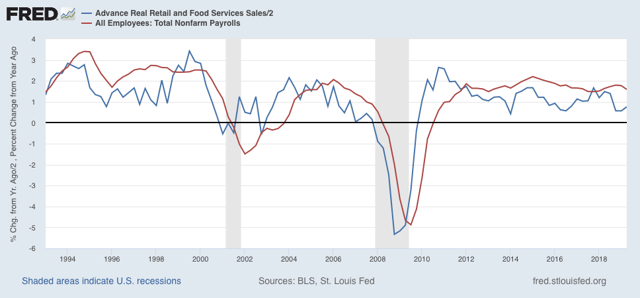
As I mentioned above, although the relationship is noisy, real retail sales measured YoY tend to lead employment (red in the graphs below) by about 4 to 8 months. here is that relationship for the past 70 years, measured quarterly to cut down on noise:


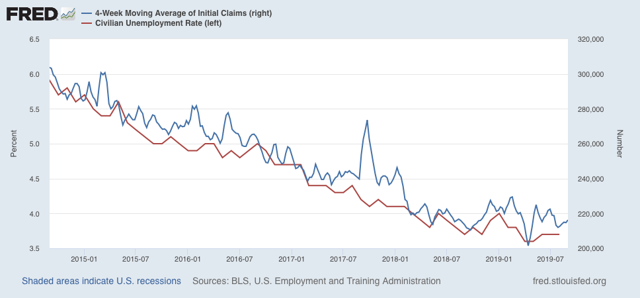
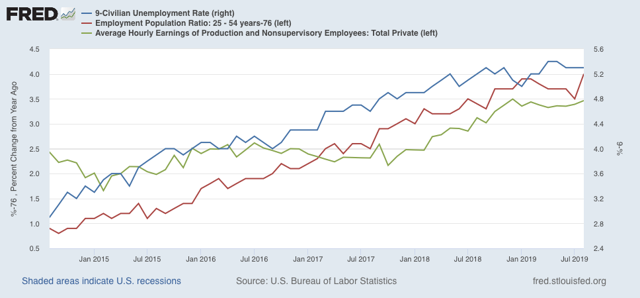
Now here is the monthly close-up of the last five years. You can see that it is much noisier, but helps us pick out the turning points:


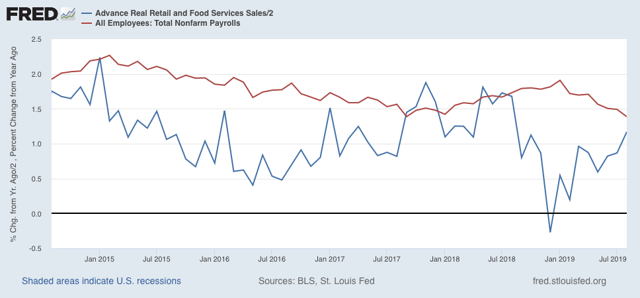
The recent peak in YoY employment gains followed the recent peak in real retail sales by roughly 6 months, and the downturn in real retail sales at the end of last year has already shown up in weakness in the employment numbers this year. Similarly I expect the improvement in retail sales to show up in an improvement in the employment numbers by about next spring. 

Finally, real retail sales per capita is a long leading indicator. In particular it has turned down a full year before either of the past two recessions:


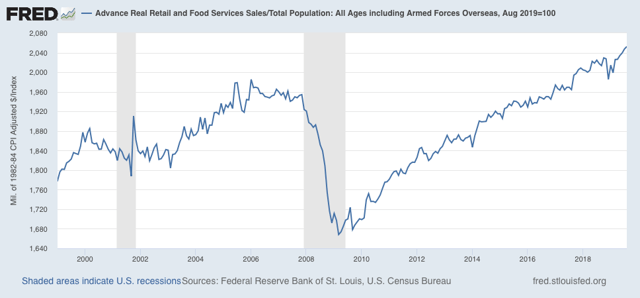
With the past several months setting new highs, this is evidence against a recession within the next year.  Further, in the last 70 years, this measure has always turned negative YoY at least shortly before a recession has begun. Although there have been some false positives, there are no false negatives. In other words, this is a very reliable positive indicator. 

To sum up, real retail sales are evidence against the current slowdown turning into a full-fledged recession, and argue for an improvement in employment and the economy as a whole starting about next spring — assuming the economy is left to its own devices, and Tariff Man does not hit American companies and households with further substantial stealth tax increases (currently standing at about $460 per household annualized).

Thursday, September 12, 2019

Real average and aggregate wage growth for August


 - by New Deal democrat

Now that we have the August inflation reading, let’s take a look at real wage growth.

First of all, nominal average hourly wages in June increased a strong +0.5%, while consumer prices increased +0.1%, meaning real average hourly wages for non-managerial personnel increased +0.4%. This translates into real wages of 97.5% of their all time high in January 1973, a new high following revisions to prior months:


On a YoY basis, real average wages were up +1.7%, still below their recent peak growth of 1.9% YoY in February:


Aggregate hours and payrolls were up strongly in August’s household jobs report, so real aggregate wages - the total amount of real pay taken home by the middle and working classes - are up 29.7%  from their October 2009 trough at the beginning of this expansion:


For total wage growth, this expansion remains in third place, behind the 1960s and 1990s, among all post-World War 2 expansions; while the *pace* of wage growth has been the slowest except for the 2000s expansion.

Finally,  several months ago I raised a concern that real aggregate wages had decelerated sharply this year. That is because, typically, real aggregate wage growth has decelerated by 1/2 or more from its 12 month peak just at the onset of recessions, although there have been 3 false positives during slowdowns that did not turn into recessions. As of August, YoY growth has declined to 2.6% vs. a revised 4.7% at the beginning of this year, although it rebounded from July:


Note that we have had two similar declines already during this expansion. For now, this is just confirming that we are in a slowdown.

Wednesday, September 11, 2019

An update on forecasts


 - by New Deal democrat

I have a new post up at Seeking Alpha, describing the order in which data has tended to deteriorate before consumer-led recessions. A few conditions have been met; most others have not.

I have previously written that if a recession is in the works over the next few quarters, it is more likely to be a producer-led recession, a la 2001. In that regard, a few weeks ago I said that Q2 corporate profits would be a crucial report.

Well, they were reported a couple of weeks ago. I hadn’t linked to that article before, but that too was posted at Seeking Alpha.

The bottom line is that both the nowcast and the long-term 12+ month forecast are reasonably clear. The short term, 3 - 9 month forecast, is a lot dicier, and depends greatly on whether Tariff Man can resist the impulse to keep adding on de facto tax increases on American producers and consumers.

As usual, clicking over to SA and reading the posts should be educational for you, and helps reward me with a little $$$ for the effort I put in.

Tuesday, September 10, 2019

July JOLTS report: m/m improvement, but slowing trend


 - by New Deal democrat

This morning’s JOLTS report for July was in general surprisingly positive on a monthly basis, but continued to show a slowing trend.

To review, because this series is only 20 years old, we only have one full business cycle to compare. During the 2000s expansion:


  • Hires peaked first, from December 2004 through September 2005
  • Quits peaked next, in September 2005
  • Layoffs and Discharges peaked next, from October 2005 through September 2006
  • Openings peaked last, in April 2007 
as shown in the below graph (quarterly, normed to 100 as of May 2018):


Here is the close-up on the past three years (monthly):


In today’s report, all of the above series improved month over month. But the only series that is meaningfully higher than it was one year ago, was voluntary quits.


Next, here is the history of the “hiring leads firing” (actually, total separations) metric:


As Is again apparent, both hires and fires have essentially gone sideways for the last twelve months. It is possible both are at a turning point, but it is impossible to know.

Finally, although I normally don’t bother with the “jobs openings” series because I consider it soft and unreliable data, it is the one series that declined in July, and it is the only series that is negative YoY:


Since it was the last series to turn south before the 2007 recession, this is noteworthy, although — again, because the JOLTS metrics are less than 20 years old — it is impossible to know what if anything at all this may portend.

In summary, while almost all the monthly changes were positive, this month’s report does little to show an improving jobs market. The main takeway is deceleration just barely above neutral levels.

Monday, September 9, 2019

Scenes from the August jobs report


 - by New Deal democrat

The August jobs report was the mirror image of most earlier reports this year: a lackluster Establishment report but a strong Household report. Let’s take a look.

By now the fact that there has been a jobs slowdown is pretty well established. In the last 7 months, only 964,000 jobs have been added, an average of 138,000 per month. If we subtract this month’s temporary census hiring of 25,000, those numbers drop to 939,000 and 134,000, respectively:


And keep in mind that the number of jobs added between March 2018 and March 2019 is going to be reduced from roughly 210,000 to 167,000 per month.

Since last December, of the leading employment sectors, only residential construction has continued to increase significantly. Manufacturing has added only 19,000 jobs in the last 6 months, and temporary jobs have actually declined since the end of last year:


Here’s what the month to month breakdown of all three leading sectors looks like compared with 2018, showing the slowdown this year - except, so far, for this past month:


Further, because even with August’s increase, the average manufacturing workweek is down almost 1 full hour per week YoY (blue in the graph below), we should expect actual losses in manufacturing jobs going forward:


Before 1980, manufacturing jobs’ growth or decline typically followed hours by roughly 2 months. Since then, the time period has lengthened to more like 6 months.

That being said, if a similar pattern is followed to what happened in 2016, by the end of next spring, we should expect *no* net YoY in manufacturing jobs, which means a decline of at least -25,000 jobs during roughly the next 9 months.

On a similarly granular level, it seems that each month in my jobs report write-up, I comment on a surprising *increase* in temp jobs, despite the worsening YoY decline in the American Staffing Association’s temporary jobs Index:


And yet, as you can see from the graphs above, temporary jobs have indeed declined this year. So I went back and compared the original numbers for temporary jobs in each jobs report this year (1st column) with the final number (2nd column), and as I suspected, the revisions have been very asymmetrical:

JAN +1500 -26,300
FEB +5800 +7000
MAR -5400 -10,500
APR +17,900 +4300
MAY +5100 -2000
JUN  +4300 -2900
JUL +2200 -7300*
AUG +15,400 ——
*1st revision only

As originally reported, every single month this year except for March was positive. But as finally revised, only two months have been positive so far. Given the worsening comparisons in the Staffing Association’s Index in August, I would be very surprised if the initial rosy number for temporary jobs in August’s jobs report holds up.  Needless to say, this is the kind of thing that happens at turning points.

Stepping back a bit to look at the goods-producing sector overall, this has also slowed down considerably, adding only 73,000 jobs in total since January, or 10,000 per month:


As shown in the graph below, goods producing jobs (red) are much more pro-cyclical compared with jobs overall (blue):


There have been YoY losses in goods-producing jobs before all of the past 3 recessions, and going back 70 years, counting 12 recessions, in all but 3 there has been steep deceleration before and actual losses no later than two months into the recession. We’re not quite there yet.

Turning to unemployment, labor force participation, and wages, let’s update the graph of how initial jobless claims slightly lead the unemployment rate:


Initial jobless claims have trended only slightly lower in the past 18 months, and are flat over the past 12. The unemployment rate has continued to trend slightly lower, but I expect that to end in the next several months, with no new lows, and more likely a drift sideways at 3.7% or even slightly higher to 3.8% or even 3.9%.

Finally, in the past 30 years, the unemployment rate has tended to start declining after recessions before the prime age employment to population ratio improves, and that in turn has turned higher before YoY wage growth finally turns higher (note: averaged quarterly to cut down on noise; unemployment rate inverted):


Similarly, at recent peaks, the unemployment rate may slightly lead prime age employment, which in turn declines before YoY wage growth does.

As the below close-up of recent monthly changes shows, gains in both the unemployment rate and the prime age participation rate seem to be slowing overall, and this year wage growth has as well:


We should expect the unemployment rate to turn up, and the E/P ratio to turn down, several months before any recession. Wage growth is a lagging indicator, however, and only turns up well into expansions, and can continue right into the next recession.