Friday, October 6, 2023

An excellent headline jobs number may mask unresolved seasonality, while unemployment weakness “stuck” at a higher level


 - by New Deal democrat


As per my reporting earlier this week, my focus this month was on whether wage and jobs growth continue to decelerate, and whether the unemployment rate would remain “sticky” at its higher, 3.8%, rate.

Two of those three came to pass. The third, jobs growth, emphatically did not! But it may well have been the result of the same unresolved seasonality that we have seen with initial jobless claims in the past month.

Here’s my in depth synopsis.


HEADLINES:
  • 336,000 jobs added. This is the highest since January. 
  • July and August were both revised higher, by +79,000 and +40,000, respectively. This is the first time we have seen such upward revisions all this year. As a result, the 3 month moving average rose to 266,000 from a revised 193,000, the highest since March.
  • Private sector jobs increased 263,000. Government jobs increased by 73,000. Only January and July were higher in the past 12 months.
  • On the other hand, the alternate, and more volatile measure in the household report rose by only 86,000 jobs. The YoY% gain in this report is +1.7%.
  • The U3 unemployment rate remained at 3.8%, tied with last month for the highest since February 2022 . The civilian labor force, the denominator in the figure, rose only slightly (by 90,000), and the numerator, the number of unemployed, rose very slightly  (by 5,000).
  • The U6 underemployment rate declined -0.1% to 7.0%, but still close to the highest since May 2022. 
  • Further out on the spectrum, those who are not in the labor force but want a job now rose 80,000 to 5.450 million, vs. its post-pandemic low of 4.925 million set this past March.

Leading employment indicators of a slowdown or recession

These are leading sectors for the economy overall, and help us gauge how much the post-pandemic employment boom is shading towards a downturn.  These were mainly positive:
  • the average manufacturing workweek, one of the 10 components of the Index of Leading Indicators, was unchanged at 40.7, equal to its lows earlier this year and down -0.8 hours from its February 2022 peak of 41.5 hours.
  • Manufacturing jobs rose by 17,000.
  • Within that sector, motor vehicle manufacturing jobs rose 8,900. 
  • Construction jobs increased by 11,000.
  • Residential construction jobs, which are even more leading, rose by 6,700. There has been a sharp rebound in the past two months, but so far It continues to appear likely that January was the peak for this sector.
  • Goods jobs as a whole rose 29,000. These should decline before any recession occurs. They remain up 1.6% YoY, which remains a very good pace compared with most of the last 40 years.
  • Temporary jobs, which have generally been declining late last year, declined further, by -4,200, and are down -233,600 since their peak in March 2022.
  • the number of people unemployed for 5 weeks or less declined -170,000 to 2,051,000.

Wages of non-managerial workers
  • Average Hourly Earnings for Production and Nonsupervisory Personnel increased $.06, or +0.2%, to $29.06, a YoY gain of +4.3%. This is the lowest since June 2021.

Aggregate hours and wages: 
  • the index of aggregate hours worked for non-managerial workers increased 0.2%, and is up 1.2% YoY, a slight uptick from July’s recent low of 1.1%, which was the lowest since March 2021.
  •  the index of aggregate payrolls for non-managerial workers rose 0.4%, and increased 5.7% YoY, a -0.1% decline from last month, and the lowest since March 2021. Nevertheless this is significantly above the inflation rate, meaning average working class families have more buying power.

Other significant data:
  • Leisure and hospitality jobs, which were the most hard-hit during the pandemic, rose 96,000, -184,000, or -1.1% below their pre-pandemic peak.
  • Within the leisure and hospitality sector, food and drink establishments rose 6100, and for the first time ever exceeded their pre-pandemic peak, by almost 30,000.
  • Professional and business employment rose 21,000. These tend to be well-paying jobs, But this series has been decelerating, and is currently up 1.2% YoY, its lowest YoY gain since March 2021.
  • The employment population ratio was unchanged at 60.4%, vs. 61.1% in February 2020.
  • The Labor Force Participation Rate was also unchanged at 62.8%, vs. 63.4% in February 2020.


SUMMARY

As is so often the case, this month was a tale of two very divergent reports. The establishment report was excellent, both in headline jobs and in most of its internals, including almost all the leading jobs sectors. Food and drink establishments finally exceeded their pre-pandemic levels. Although it showed continued slow deceleration in terms of aggregate hours and pay growth, at +0.4% this month the latter almost certainly exceeded the inflation rate, meaning average Americans got more spending money in their pockets last month. If there was a fly in the ointment, it was that government jobs accounted for an outsized percentage of all the growth. This may well be of a piece with the big declines in initial jobless claims all last month, which I suspect had to do with a change in the post- vs. pre-pandemic patterns.

On the other hand, the household report was lackluster, with a meager 86,000 jobs gain. Both the unemployment and underemployment rates “stuck” close to or at their highs from last month.

So: there was continued deceleration in wage gains, and higher un- and under-employment rates “stuck,” But the monthly gain in jobs was very good. I should point out, however, that Q4 job growth last year deviated seasonally to the downside compared with pre-pandemic trends. I suspect we may see some of the same this year as well.

Thursday, October 5, 2023

Very strong initial jobless claims probably the result of unresolved post-pandemic seasonality


 -  by New Deal democrat


It continues to be reasonably clear that there is some unresolved post-pandemic seasonality in initial jobless claims, which nose-dived last September and rebounded during October. So far the same pattern is evident this year.

To wit, initial claims rose 1,000 last week to 207,000. The more important 4 week moving average declined -2,500 to 208,750. With a one week lag, continuing claims declined -1,000 to 1.664 million:


More importantly for forecasting purposes, YoY initial claims were up 4.5%, the 4 week average up 9.4%, and continuing cliams up 27.8%:


This is the best YoY showing in several months.

On a monthly basis, in September initial claims rose 10.4% YoY. Since initial claims lead the unemployment rate by several months, this implies that the average unemployment rate by the end of this winter is likely to be approximately 4.0% (i.e., one year ago the average unemployment rate was 3.6%; 3.6*1.104 = 4.0):


Since the monthly YoY change is the most important comparison, we remain just barely into “yellow caution flag” territory. We’ll see if last year’s seasonal increase in jobless claims in October happens again this year (I think it will).

In the meantime, the implication for tomorrow’s jobs report is that last month’s jump in the unemployment rate from 3.5% to 3.8% is likely largely to “stick.” We might see a decline to 3.7%, but I strongly suspect the months of 3.5% or even 3.4% unemployment rates are over. Additionally, per my writing earlier this week, I am expecting YoY nonsupervisory wage gains to decelerate, and there is every reason to believe the deceleration in jobs gained monthly will decelerate as well, at least on a 3 month average basis. 

Wednesday, October 4, 2023

The current economic “big picture”: by no means are we out of the woods


 - by New Deal democrat


There is no particularly important economic news out today, so let me take this opportunity to step back and give you more of a “big picture” view of my current thinking.


To the extent there is a consensus, it is that a recession has been avoided and a “soft landing” of low inflation and positive jobs and income news will continue. So far, the first is true, but I am increasingly skeptical of the second.

As you know by now, I track “long leading indicators,” background economic conditions that set the stage for what will happen a year or more ahead; “short leading indicators,” which generally turn about 3 to 12 months before the economy as a whole does, and “coincident indicators,” which mark the turn itself.

So let me start that by noting that while there have been recent rebounds in both the short leading indicators, the long leading indicators have remained negative. Perhaps most noteworthy, the Fed has given no indication that it is about to “pivot” to lowering interest rates. In fact, in the past 6 months interest rates in the form of bond yields have risen about 1.5%. Most importantly, here are mortgage rates, which are now the highest since late October in the year 2000:


As of yesterday, a new 30 year mortgage averaged 7.72%.

What this means is that a prospective home buyer with a 3% interest rate, paying $1000/month interest currently, would see that monthly interest payment rise to $2575/month if they bought a home for the exact same price.

Unsurprisingly, this has all but killed the mortgage market. As of this morning, purchase mortgage applications made a new 28 year low; they haven’t been this low since 1995:


Although I won’t repeat the graph, while they backed off a little last month we have seen repeated new all-time highs in multi-family building construction (apartments and condos), which are something of “substitute goods” for a single family home. To see why apartment buildings in particular might continue to be built at a rapid clip, here is a graph of CPI for rent of primary residence (i.e., an apartment or other rental unit):


While this has increased 18.8% since before the pandemic, that means a previous $1000 payment on average has increased to $1188, compared with the $2575 for a comparable new mortgage payment as shown above.

Nevertheless I suspect that this building spree has peaked. If the building of multi-unit dwellings turns down, we will see a further downward drag on the construction sector as a whole.

Another long leading indicator, corporate profits, got some positive press last week as nominally the final revision for Q2 showed that they rose 0.8%. The problem here is that the actual leading indicator requires that they be deflated by unit labor costs. Here’s what that looks like:


So adjusted, corporate profits declined slightly in Q2, and are only 0.3% higher than Q4 of last year.

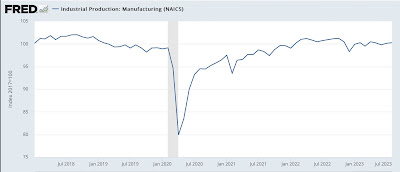
Turning to the short leading indicators, meanwhile manufacturing is still down compared with where it was in 2022, and is up only 0.4% since January of this year, as indicated by the relevant industrial production index:


Recall that vehicle manufacturing has been the standout positive in this sector, and is a specific short leading indicator as well. After home purchases, it has typically been the next consumer sector to turn down. As to which, let’s re-run the graph from yesterday showing that vehicle sales of both heavy trucks as well as sedans and SUV’s may have peaked several months ago:


Part and parcel of this is that the interest rates for auto loans have also risen sharply:


If construction and manufacturing are faltering, we would expect the stock market to take notice (and despite the well-known fact that “the stock market is not the real economy,” nevertheless it is a well-known if volatile short leading indicator). In that regard it is noteworthy that the stock market recently failed to surpass its January 2022 high, and in the past month has turned back down:


Finally let’s look at consumer spending. Real consumer spending on goods has typically peaked shortly before or after the onset of a recession. Here’s the long term view:


So far not only has this not turned down, but it is 2.2% higher than it was one year ago.

The weekly retail series I track, Redbook, also recently had a rebound, and is currently higher YoY by 3.9%:


Much of the consumer rebound - indeed of the economy as a whole - has been the decline of gas prices from $5/gallon in June 2022 to about $3.05 at the end of last year. Although oil prices recently made a new 12 month high over $90/barrel, gas prices at the pump have not followed (probably having to do with the switch from summer to winter fuel blends):


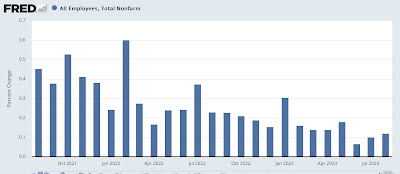
On Friday we’ll get the latest update on employment. As I noted yesterday in discussing the JOLTS report, the trend decline in voluntary quits indicates that the YoY gains in wages will continue to decelerate. For the past 24 months, the 3 month average in employment gains has also decelerated from roughly +0.4% per month to +0.1% per month:


Based on the leading indicators discussed above, I expect that to continue. If job gains continue to decelerate, and wage gains continue to decelerate, aggregate payrolls will decelerate. Meanwhile inflation looks like to continue at least a stabilized levels. This means that real aggregate payrolls could peak in the next few months, a very accurate sign of an oncoming recession.

In short, while at the moment things look relatively rosy, by no means do I think we are out of the woods.

Tuesday, October 3, 2023

August JOLTS report: a pause in deceleration, but the trend remains intact


 - by New Deal democrat


Last month I concluded my post on the July JOLTS report’s sharp declines by noting that “None of these statistics move in a straight line, so it would be a mistake to project this report’s relatively big moves forward. But the trend clearly remains in place.”

This month’s report for August showed that was the case, as all of the major metrics improved, most slightly, but openings strongly. Nevertheless, the decelerating trend continues to remain in place.


Openings increased 590,000 to 9.610 million, the highest in three months. Actual hires increased 35,000 to 5.857 million, and quits increased 19,000 to 3.638 million. Below I show all three series normed to their average as of the three months before the pandemic hit:


As you can see, openings are still up a very strong 38.0% since then, while quits are up only 3.1%, and hires are actually *down* -2.0%.

In short, for all intents and purposes both hiring and quitting are back to where they were in normal times before the pandemic, while openings - which are always suspect because many companies keep fictitious openings posted as a matter of routine - remain very elevated.

Layoffs and discharges, similarly measured, declined all of -1,000 to 1.680 million, a decline of -11.7% compared with their pre-pandemic average:


Note, however, that all 4 metrics discussed above - openings, hires, layoffs, and quits - are receding from their post pandemic highs (and low in the case of layoffs). In other words, the decelerating trend remains intact.

Finally, last month I premiered a comparison of the quits rate and average hourly earnings. This is because the former has a 20+ year history of leading the latter, which I have in the past described as a “long lagging” indicator that turns well after the turns in most other metrics. Here’s the update of that comparison:


The quits rate was flat compared with the prior month, but as with the other JOLTS series, the decelerating trend remains intact. This means that wages should follow with continued deceleration, on the order of -0.1%-0.2% measured YoY. This suggests that on Friday YoY nonsupervisory wages will likely decelerate to 4.4% or 4.3% YoY. 

Monday, October 2, 2023

Manufacturing and construction have the most positive reports all year


 - by New Deal democrat


As usual, the monthly data starts out with reports on the two most important production sectors of the economy, namely manufacturing (for September) and construction (for August). For a change, the news was mainly positive.


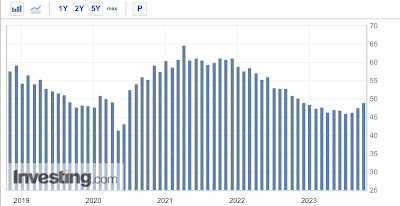
Let’s start with manufacturing. The ISM’s diffusion index, where any value below 50 indicates contraction, came in negative for the 11th month in a row for the total index, and the 13th month in a row for new orders (not shown):


How is that consistent with the news being “mainly positive?” Because both numbers were the highest this year, with the total improving +1.2 to 49.0, and new orders improving +2.4 to 49.2. The ISM itself has indicated that numbers above 48 typically are *not* associated with recessions.

In other words, across all sectors manufacturing may still be contracting, but only slightly. And because this is a diffusion index, and vehicle manufacturing has been improving this year, the news has probably been better on a $ weighted basis than based on this diffusion.

If there is a fly in the ointment here, it is in the aforesaid vehicle manufacturing. Data for sales of passenger vehicles and heavy trucks are both reported with a 4 week delay, meaning we got August’s report last Friday.

And here, we see that both sectors turned down in August. In particular, heavy weight truck sales have been declining since May:


The possible peak in heavy truck sales is most important because historically heavy truck sales turn down first - and decisively - in advance of recessions:


In general, a downturn from peak of more than -10% in heavy truck sales has been signal rather than noise. We’re not quite there, but it’s getting close.

Now let’s look at the other leading sector of construction. Here the news was totally positive, as both total and residential construction improved on both a nominal and real basis. Nominally total construction spending made another all-time high, while residential construction spending was the higher since last October:


Since the cost of construction materials actually declined -0.1% in August, in real terms the results were even slightly better, although total construction spending has not surpassed its post-pandemic peak:


In sum, while there are several soft spots warranting caution, this was the most positive set of manufacturing and construction reports so far this year.