Saturday, June 19, 2021

Weekly Indicators for June 14 - 18 at Seeking Alpha


 - by New Deal democrat

My Weekly Indicators post is up at Seeking Alpha.

There was a little more deterioration in the long leading indicators, but they are still positive.

Meanwhile, the new more infectious “delta” variant of COVID raises the real possibility that the relatively unvaccianated sections of the country could go backward, with increased cases and deaths, and people resuming caution about social activities; which also means lower economic activity.

As usual, clicking over and reading will bring you up to the virtual moment, and bring me a few bucks with which to pay my bar tab.

Friday, June 18, 2021

Coronavirus dashboard for June 17: big progress since 1 year ago; big “Delta” challenge still ahead


 - by New Deal democrat

One year ago today, in my Coronavirus Dashboard for June 17, here was my graph of cases:


Which I described as:

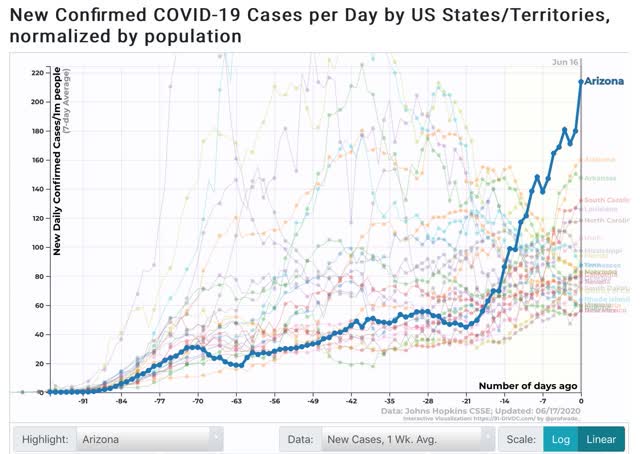
As shown in the graph above, [after Arizona at 214 per million population] the remaining “top 10” are all States in the Confederacy, High Plains, and Mountain West. In order, (showing rates of new infections per million as of June 15 in parentheses) they are: Alabama (156), Arkansas (150), South Carolina (125), Louisiana (127), North Carolina (117), Utah (102), Mississippi (98), Florida (83), and Iowa (83).
One year later, the scale of the current pandemic is an order or more of magnitude lower. But the regions with the worst outbreaks remain the same (sadly, ingrained behavior patterns are incredibly resistant to change).


Let’s begin the current situation with CNN’s graph of vaccination rates in the 50 States plus DC and PR:


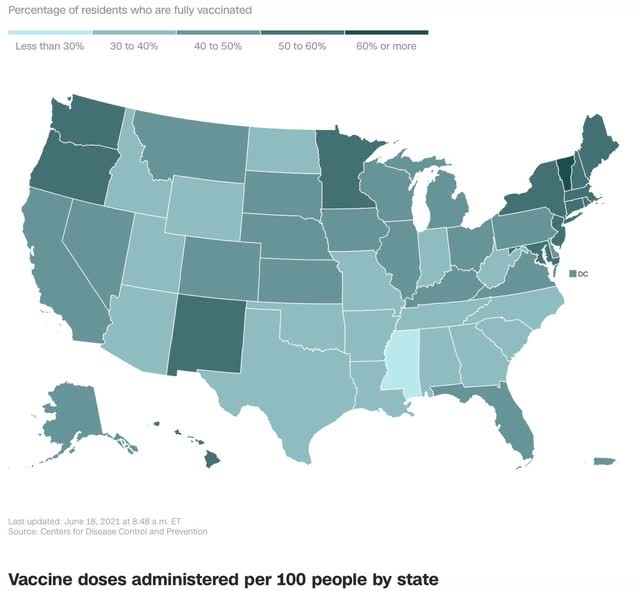
The regional disparities are completely obvious. While in the US as a whole, 96 doses have been administered per 100 population, the range varies from Vermont at close to 140 doses to Mississippi at about 62 doses. Basically in Mississippi plus all of the other States less than 40% fully vaccinated remain at risk for a renewed outbreak of the virus at any time.

Here is the US situation as to the 7 day average of both new cases and deaths:


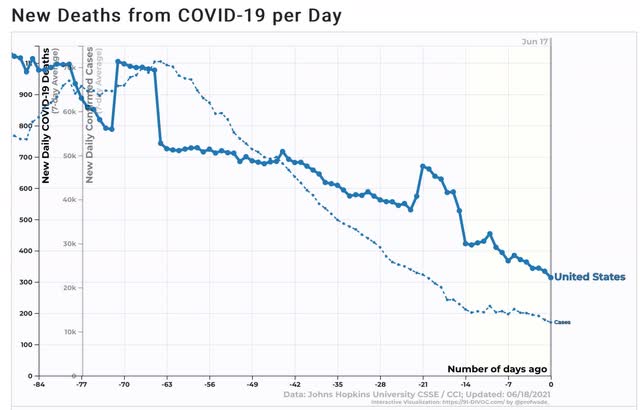
Progress on new cases has slowed considerably, while deaths, which lag by about 4 weeks, are still declining. Deaths will probably follow cases to a near halt in the decline at about 300 deaths per day.

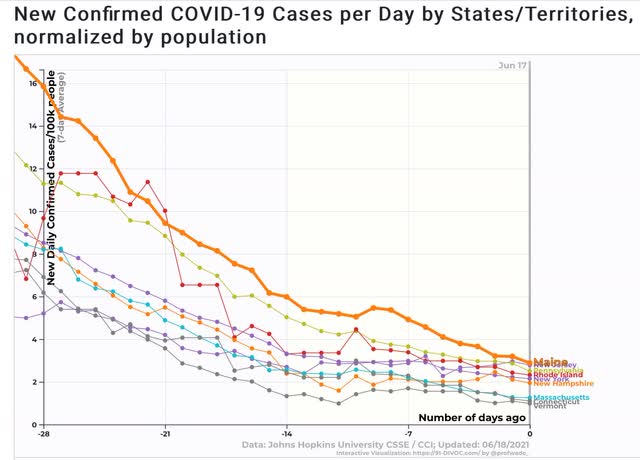
Because of the regional differences, below are new cases for each of the four US regions.

Northeast:


Midwest:


South (including DE, MD, DC, and VA):


And West:


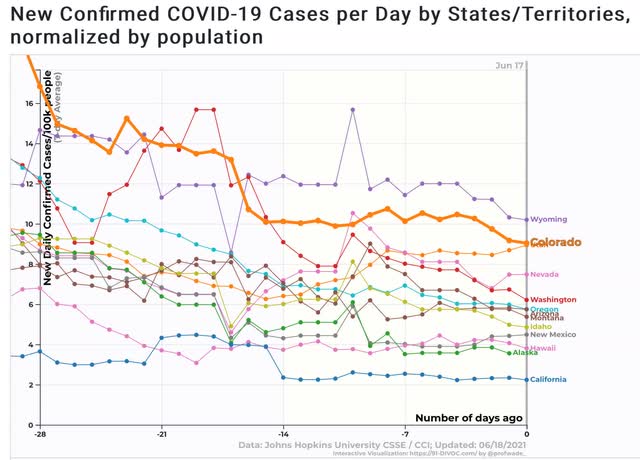
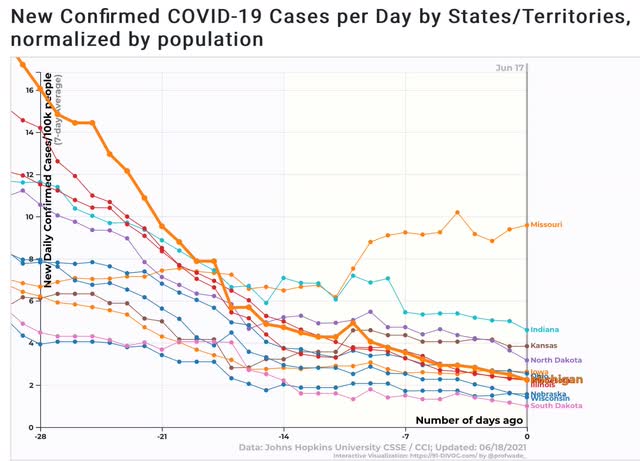
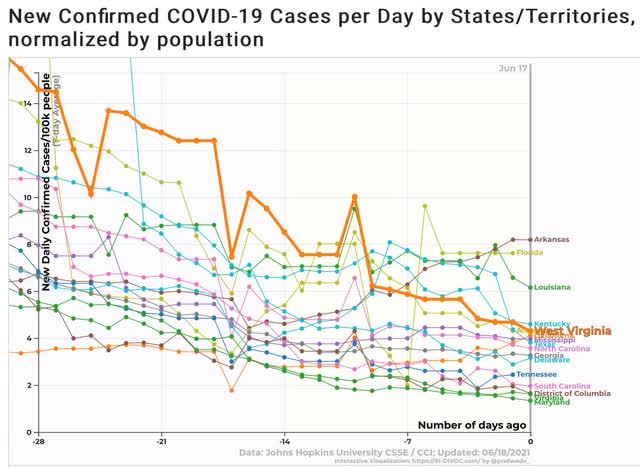
Let’s break the above down by ranges of new cases [NOTE: since 1 year ago 91-DIVOC was measuring per 1 million, and now they measure by 100,000, current rates must be multiplied by 10 to compare with the graph from 1 year ago]:

Under 2 per 100,000: VT, SD, CT, MA, MD, WI, NE, VA, DC, PR, NH, SC

2 to 4 per 100,000: NY, IL, CA, MI, MN, RI, TN, PA, OH, IA, NJ, ME, DE, ND, GA, AK, NC, TX, HI, KS, MS

4 to 6 per 100,000: OK, AL, NM, WV, KY, IN, ID, MT, AZ, OR

6 to 8 per 100,000: LA, WA, NV, FL

8 to 10 per 100,000: AR, UT, CO, MO

Over 10 per 100,000: WY

While new cases do not closely track the vaccination rate, the correlation remains obvious, as the best States are all of the Northeast (under 3 cases per 100,000) plus the Mid-Atlantic (DE, MD, DC, and VA), upper Midwest, and California. The worst States are in the Deep South and West, plus Missouri. But there are surprises, like SD and SC doing very well, while WA and CO are doing relatively poorly.

As the “Delta” variant becomes more widespread in the next 4 to 8 weeks, it will be a real challenge for the relatively unvaccinated States. At the same time, all but 12 of the States are currently below even the lowest level of new infections one year ago, and Wyoming’s now is only about 1/2 of Arizona’s last summer at this time - although it would have been in the top 10. 

Thursday, June 17, 2021

The decline in new jobless claims stalls, as the “delta” variant is ready to strike the unvaccinated States


 - by New Deal democrat

New jobless claims continue to be the most important weekly economic datapoint, as increasing numbers of vaccinated people and outdoor activities have led to an abatement of the pandemic, with both new infections and deaths at their lowest point since the onset of the pandemic in March 2020. I’ll have more to say on the intersection of the pandemic with claims in the conclusion.

My final objective is for claims to average 325,000 or below, which would signify a return to normal expansion levels in the past 30 years.

Turning to this week’s report, new jobless claims rose 37,000 to 412,000, the first increase in weekly claims in nearly 2 months. The 4 week average of claims declined by 8,000 to 395,000, a new pandemic low. (Note that I have discontinued comparisons of non-seasonally adjusted claims, as the period of lockdown distortions YoY has passed.)


At the peak of the pandemic lockdowns, new claims were running 6 million to 7 million per week. Here is the trend since the beginning of last August:


From late February into May, claims had trended down an average of roughly 100,000 per month. In the past few weeks, this has slowed to a rate of decline of roughly 50,000 per month, indicating that the “opening” of the economy is getting nearer to an endpoint. This also implies a slowing down of net job creation from the last 3 months’ levels. At their current level, claims are consistent with early mid-expansion levels in the past:


Continuing claims, which are reported with a one week lag, and lag the trend of initial claims typically by a few weeks to several months, rose 1,000 from last week’s revised pandemic low of 3,517,000. Still, over the past 2 months these have only declined about 7% from roughly 3,750,000:


The long term perspective again shows that these are equivalent to the worst levels of most previous recessions, or early in the expansions, versus at 2,000,000 or below later in strong expansions:


I want to conclude with some remarks on how the new “delta” variant of COVID, together with the premature “victory” declaration in many States with low vaccination rates, who have also terminated enhanced unemployment benefits, may change the picture for the worse from here.

I wrote last week that “I think we are going to see two tracks going forward from here, as near-normalcy does return to the more vaccinated parts of the country, while attempts to return to normalcy fail in the laggard regions.”

Across the Deep South and most of the interior West, plus West Virginia, Indiana, and Missouri, less than 40% of the population is fully vaccinated. Most likely less than 50% of the population has received even one dose. Over the next 6 to 8 weeks, these States are ripe for a serious outbreak of the highly infectious new “delta” variant of the disease. Many people in those States are probably going to retreat to their prior, cautious behaviors to protect themselves - and that means decreased economic activity and increased layoffs in those States. The cutoff in pandemic benefits will further curtail spending in those States, which will also lead to increased layoffs.

In short, I am even more convinced that the US is headed towards 2 separate tracks: one of growing vaccinated regions, and one of stagnating or renewed contraction in the unvaccinated regions.

Wednesday, June 16, 2021

May housing permits and starts continue down from recent peak


 - by New Deal democrat

In May housing permits (blue in the graph below), including the least volatile single family permits (red, right scale), continued to decline from their January peak. Meanwhile the more volatile and slightly lagging housing starts (green) increased, but remained below their March peak:


The level of construction activity as high as or higher than its pre-pandemic peak is continuing. On the other hand, with a 10% decline in permits, and 9% in starts, the minimum decline to be consistent with a possible upcoming recession has nearly been met (while a 20% decline is more typical). For now I interpret this to mean a sign of a slowing down of economic growth next year.

Finally, here is the YoY change in mortgage rates (red), inverted so that up = economic positive, and down = economic negative, compared with total permits (blue)/10 for scale:


As I have said many times before, mortgage rates lead permits and starts. The artifact of comparisons with the pandemic lockdown months will end next month, at which time I expect permits to be much more in line with their historical relationship with interest rates than they have been in the past few months.

Tuesday, June 15, 2021

Industrial production on the verge of exceeding pre-pandemic level


 - by New Deal democrat

Industrial production is the King of Coincident Indicators. It is the single datum that most frequently coincides with the NBER determination of the beginning and end of recessions.


In May, total production increased +0.8%. Manufacturing production increased +0.9%. Both current readings are the highest since the onset of the pandemic:


Total production is only 1.4% below its February 2020 level, and manufacturing production is a mere 0.3% below that level.

If there is another positive report next month, exceeding the February 2020 level, and Q2 GDP is as positive as has been forecast, then the NBER may well decide that the pandemic recession has officially ended (with the most likely trough date being set at April of last year).

May retail sales decline, but 10%+ gain in retail sales since the onset of the pandemic remains intact


 - by New Deal democrat

[Note: I’ll comment on industrial production in a separate post later]

I feel like I could simply repost my retail sales piece from one month ago, because the story is the same: at first glance, May’s retail sales report, like April’s, looks like a big miss, as sales declined -1.3% nominally, and after adjusting for inflation, declined -2.0%.

But the important point is that the big jump in March didn’t get taken back.  As I wrote then: “if the big March gain in sales isn’t taken back in the next month or two, then there’s likely to be a similarly large jump in employment by the end of summer.” Further, I have fully expected the big jump in sales and income fueled by stimulus payments to peter out. In fact, some significant declines for a few months might actually be a *good* thing. Let’s take a look, and I’ll explain why.

Here are nominal retail sales since the modern series started in 1994:


It’s impossible to miss that there is a huge break to the trend - to the upside - due to the stimulus payments last year, and especially, this year. Retail sales are 18% higher than they were in February 2020. That kind of abrupt, huge increase is going to lead to shortages, which in turn are going to lead to rationing by price - i.e., inflation. A decrease to closer to the long term trend is still going to be better than the situation before February 2020, and won’t give rise to so much inflationary pressure.

The big jump still exists even after we figure in consumer inflation, up 12% since February 2020:


Now, let’s turn to employment, because as I have pointed out many times, real retail sales (blue) tend to lead employment (red) and aggregate hours (gold) by about 3-4 months. Here’s the long term YoY look from 1993 through the end of 2019:


The long lags after the 2001 and 2008 recessions reflected the “China shock” as manufacturing jobs in particular were re-sourced to China in large wages after both recessions.

Next, here is the monthly update since the beginning of 2020 (note the huge difference in scale!):


But that there is likely to be a continuing big YoY jump in jobs in the next several months is hardly surprising, given the 22 million loss in jobs in April 2020. So the below graph compares the absolute data, normed to 100 as of February 2020:


The most important takeaways are that, with the stimulus gains “sticking” so far, the large monthly jumps in employment are likely to continue. At the same time, there are legitimate inflationary pressures, as (1) there has been a quick, continuing 10%+ jump in demand; and (2) demand for new employees as indicated by the JOLTS reports of record job openings have remained unfulfilled for a variety of reasons (including lack of child care during in-home schooling) that is requiring big jumps in wages to attract applicants.

Monday, June 14, 2021

Travelin’ man


 - by New Deal democrat

No economic news today, and I’m traveling. 

Regular economic nerdiness will resume tomorrow.