Saturday, November 23, 2019
Weekly Indicators for November 18 - 22 at Seeking Alpha
- by New Deal democrat
My Weekly Indicators post is up at Seeking Alpha.
I got some complaints from readers over there that they wanted to see graphs. So I’ve set up links to graphs that should automatically update each week for most of the data.
So long as the consumer continues to spend, we’re not going to have a recession. And if we don’t have one by the middle of next year, it isn’t going to happen.
As usual, clicking over and reading should bring you right up to date, and it rewards me a little bit for my efforts.
Friday, November 22, 2019
Rebound in existing home sales continues, but beware the housing “choke collar”
- by New Deal democrat
Although they account for about 90% of the entire housing market, existing home sales are the least consequential to the economy. That’s because building new homes entails a bunch of economic activity, from architects, builders, building trades contractors, landscapers in the building process, followed by furniture, appliances, and yard improvements after the owners move in. Existing home sales on average have very little of the former, and much less of the latter.
But because existing homes compete with new homes for living space, it’s worthwhile to note that they confirm what we’ve been seeing in new home sales and construction this year; namely, a recovery brought about by lower interest rates.
The NAR doesn’t permit FRED to post its data. So here is a graph of existing home sales for the past twenty years from Dshort.com:
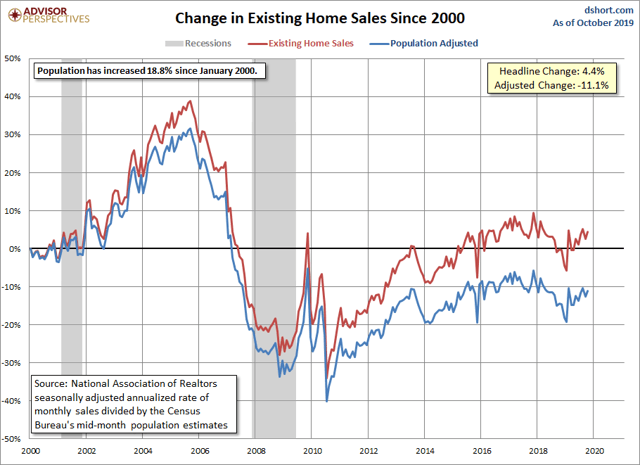
For my purposes, you can ignore the blue, “population-adjusted” line. Note the significant declines in sales following the rise in interest rates in the second half of 2013 and again in 2018. The low point was this past January. There is a well-established uptrend in place since then - which is the same thing we see with new houses, which also bottomed earlier this year.
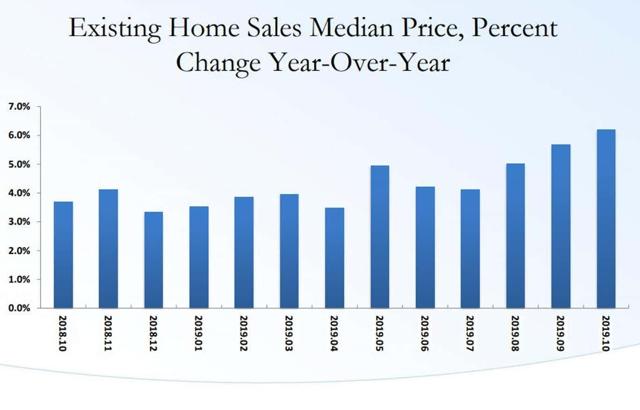
But if the news in sales is good, I am concerned about the renewed push in median prices, which were up 6.2% YoY in October to $270,900. Because prices rise and fall seasonally, we have to look YoY:
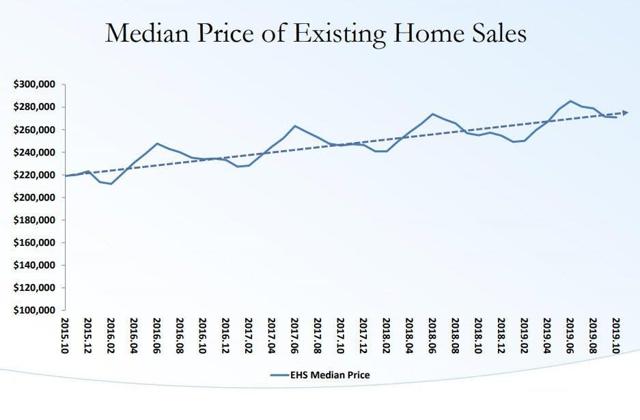
Here is a look at the past four years. In that time, median existing home prices have risen 23.1%:
Meanwhile median household income, measured nominally, increased 5.1% YoY in October, according to Sentier Research (H/t Political Calculations). It is also up 16.2% from four years ago:
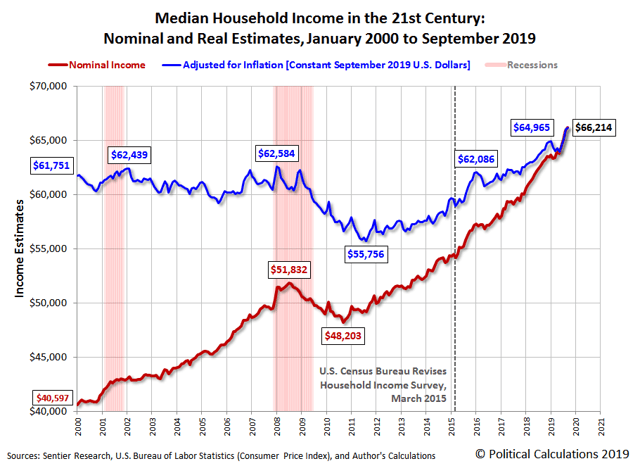
Which means that median house prices are once again outstripping gains in household income.
Recently I’ve applied the idea of a price “choke collar” to the housing market, by which I mean that while any significant decrease in interest rates will provoke a revival in housing construction and sales, the resulting increase in prices beyond the ability of households to compensate will put a ceiling on that rebound.
I don’t think we’ve hit that ceiling yet. But it something to keep an eye on in 2020.
Thursday, November 21, 2019
Initial claims weaker, but still not at cautionary levels
- by New Deal democrat
I’ve been monitoring initial jobless claims closely for the past several months, to see if there are any signs of a slowdown turning into something worse. Simply put, no recession is going to begin unless and until layoffs increase, and the lack of any such increase has been the best argument that no recession is imminent.
My two thresholds for initial claims are:
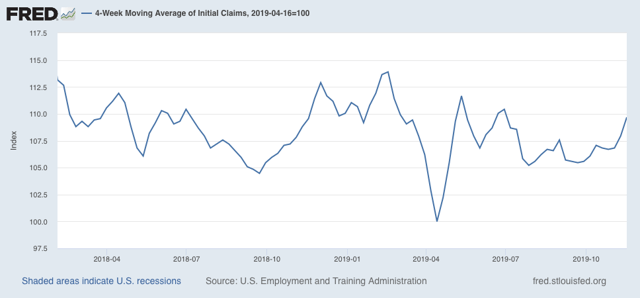
1. If the four week average on claims is more than 10% above its expansion low.
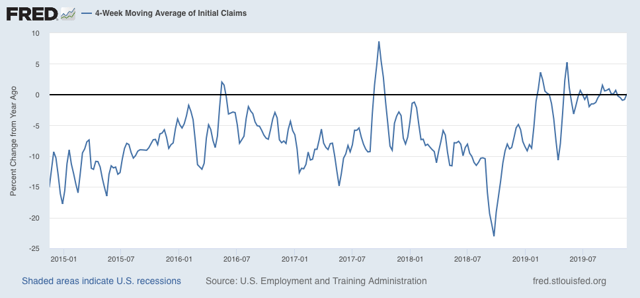
2. If the YoY% change in the monthly average turns higher.
This week’s reading of 227,000, the second such reading in a row, is certainly weak compared with the past 4 months. As a result, the 4 week moving average of claims, at 221,000, is 9.7% above the lowest reading of this expansion:
On a YoY% change basis, the 4 week average is very slightly, as in 0.1%, above its level one year ago:
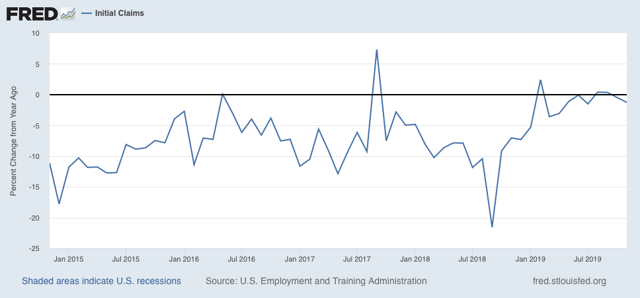
For the first three weeks of November, the average is 221,667 vs. 224,500 for the entire month of November last year, or less by -1.3%:
Although these readings are all weak, they remain positive. Neither threshold for a cautionary recession signal has been met.
Meanwhile, the less volatile 4 week average of continuing claims is 1.8% above where it was a year ago:
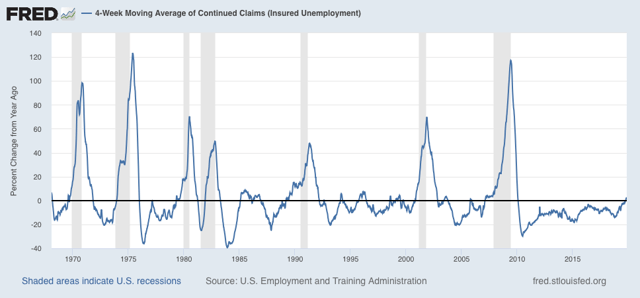
This certainly is cautionary, and is consistent with a significant slowdown. But there have been similar readings in 1967, 1985-6, 3 times in the 1990s, and briefly in 2003 and 2005, all without a recession following. So the threshold for continuing claims being a negative has not been met either.
Barring additional poor government policies - I.e., if the economy is left to its own devices - the long leading indicators strongly suggest that the threat of a recession will end by about mid year next year. Unless initial claims start to be reported in the 230’s, and continuing claims continue to trend higher, into the 1.770 million range (by mid-December, after which the YoY comparisons for continuing claims get much easier), no interim recession will be signaled.
Wednesday, November 20, 2019
Slouching towards a producer-led recession?
- by New Deal democrat
A few months ago I wrote an extended piece at Seeking Alpha about the order of events I would need to see in order to conclude that a producer-led recession, similar to that of 2001, was ready to occur. One of the big components was a change in the Senior Loan Officer Survey.
Well, the Senior Loan Officer Survey for Q3 was reported a couple of weeks ago, and seems to have completely escaped the notice of the economic and financial community.
But it was on my radar. So I have now updated my analysis as to whether we are in for a producer-led recession, over at Seeking Alpha.
As usual, clicking over and reading helps reward me with a penny or two for my efforts.
By the way, SA also finally got around to publishing my housing update from yesterday, and you can read it here.
Tuesday, November 19, 2019
Excellent October housing report is good news for employment
- by New Deal democrat
I’ll have a more comprehensive report up at Seeking Alpha, and I’ll link to it when it goes up, (UPDATE: It’s finally up, here ) but in the meantime let me just share the least volatile most leading component which is single family permits:
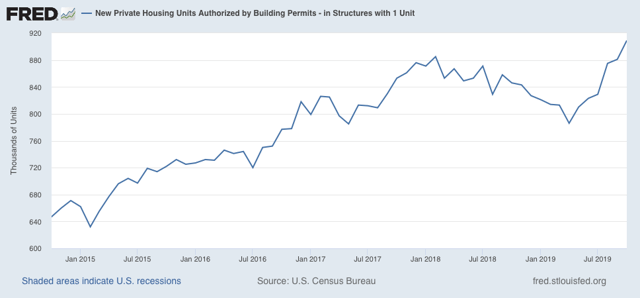
These made a new expansion high. The housing rebound, following lower mortgage rates, is firmly in place.
Additionally, both housing completed and under construction have also increased from recent bottoms. These aren’t as leading as housing permits and starts, but they correlate much more closely with residential building jobs, and they argue strongly that residential construction employment, a leading sector of the jobs market, is likely to continue to increase:
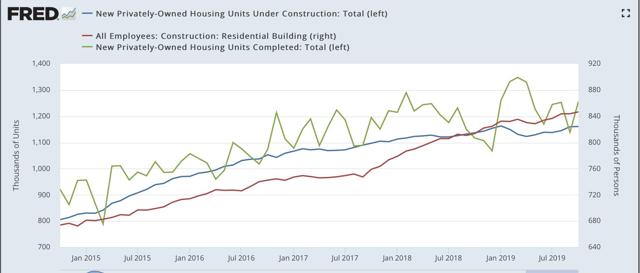
This was a very good report.
Monday, November 18, 2019
A yellow flag from temporary hiring
- by New Deal democrat
In the conclusion of my latest Weekly Indicators post, I wrote that, except for temporary staffing, I didn’t see any signs of weakness spreading out beyond manufacturing and import/export. Manufacturing, as measured by industrial production, has been in a shallow recession all year. By contrast, the consumer - 70% of the economy - continues to do ok, boosted by lower interest rates for mortgages and somnolent gas prices.
Since there isn’t any other economic news today, let’s take a look at that one yellow flag - temporary hiring.
As I’ve pointed out each month for the past few months, each monthly jobs report this year has started out with a nice, positive number for temporary jobs. But then, with one exception, the number gets revised downward, sometimes substantially, and usually into negative territory.
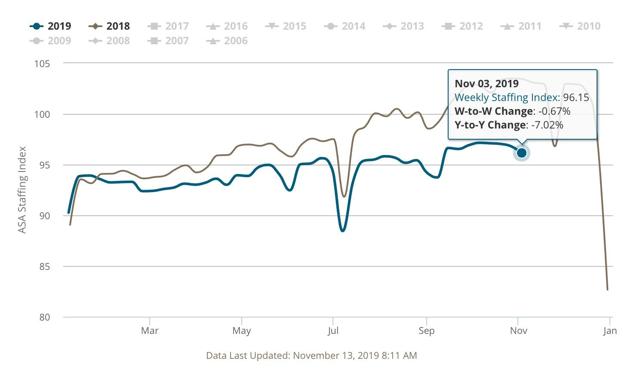
My weekly check on this is the Staffing Index from the American Staffing Association. And that number has been getting progressively worse.
Here is the most recent number, from last week (-7.02% YoY):
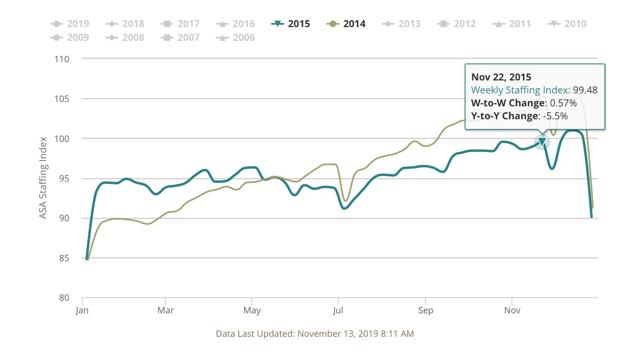
Now let’s compare with the worst number during the 2015-16 slowdown that was centered on the Oil Patch (-5.5% YoY):
Finally, here is the 2007-08 comparison:
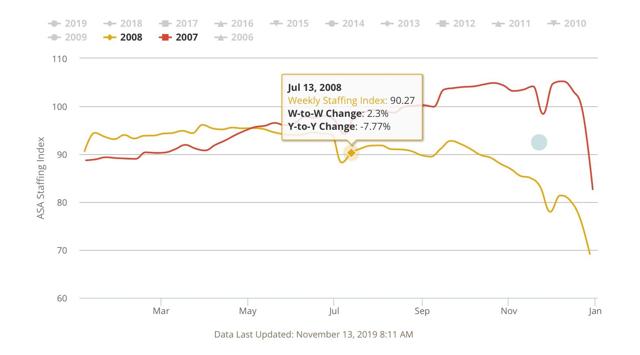
The YoY comparison declined below -7% in July 2008. By that time, the economy as a whole had already been in a recession for over half a year (although Q2 GDP was positive, and was less than -0.1% away from its Q4 2007 peak).
Finally, let’s take a look at hiring (via JOLTS), firing (initial claims, averaged monthly and inverted), and the unemployment rate (also inverted) for the past five years:
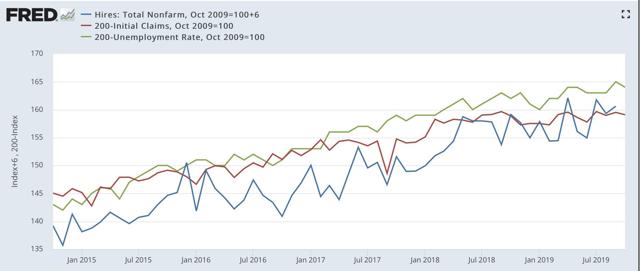
Hiring has slowly trended higher, while new jobless claims are essentially flat. Presumably as a result, the unemployment rate has been ticking slowly lower.
I would expect a decrease in hiring to show up very quickly, and maybe first, in a decline in new temporary hires. But so far the yellow flag in temporary staffing has not shown up in the wider data, and in particular hiring.
Subscribe to:
Posts (Atom)