Saturday, May 10, 2025

Weekly Indicators for May 4 - 8 at Seeking Alpha


 - by New Deal democrat


My “Weekly Indicators” post is up at Seeking Alpha.

Unsurprisingly, the big news this week from the high frequency indicators is what I have been writing about almost all week; namely, that consumers still have money to spend, and they are spending it front-running the impacts from T—-p’s tariffs.

As usual, clicking over and reading will bring you up to the virtual moment as to the state of the economy, and reward me a little bit for organizing and presenting it to you.

Friday, May 9, 2025

More fuel to help consumers deal with tariffs: real aggregate nonsupervisory payrolls likely increased again in April


 - by New Deal democrat


One of my favorite indicators is both a significant update from last week’s jobs report, as well as a good explanation for why therre has been no “instant recession” due to “Liberation Day” Tariff-palooza. Namely, real aggregate nonsupervisory payrolls.


To quickly recap, this tells us in real, inflation-adjusted terms how much money average Americans have to spend in the aggregate. When the total amount of money goes down in real terms, a recession is almost always at hand.

Here is the historical relationship measured as YoY% changes up until the pandemic (side note: I really wish FRED would add on a feature allowing ranges to be capped, so that the pandemic lockdown months don’t make everything else look like squiggles):


The metric is flawless. Every time inflation went up more than aggregate payrolls YoY, it marked the beginning of a recession +/- 2 months. The only qualification is that “jobless recoveries” show up as continued negative comparisons.  But when inflation increases past aggregate compensation, that marks an imminent recession; and when it crosses to the downside, it is always during a period of expansion.

Here is the same relationship post-pandemic:


Aggregate payrolls have consistently increased more YoY than inflation. At the end of 2022 they came close, but no cigar. In fact, since the beginning of 2024 the comparison had become more positive.

Finally, here is the month by month percentage change for the past year:


In last week’s jobs report, aggregate nonsupervisory payrolls increased 0.4%, about average for the past 12 months. Only once in the past twelve months have consumer prices increased more than that. 

Consumer inflation for April will be reported next Tuesday. Unless there is a major surprise, real aggregate nonsuperviosory payrolls will be shown to have increased again. And this in turn gives consumers more ability to deal with tariff-related price increases. Which means the Tariff recession will likely continue to be delayed.

Thursday, May 8, 2025

New jobless claims well-behaved, but continuing claims trend higher


 - by New Deal democrat


Initial jobless claims returned to a well-behaved range this week, down -13,000 to 228,000. The four week moving average was in line, increasing 1,000 to 227,000. Continuing claims, with the typical one week delay, declined -37,000 to 1.879 million, which is still near the top end of their 12 month range:


The one significant item from the above is that continuing claims have definitely been in a slowly increasing trend over the past eight months, indicating a slow weakening of the labor market.

In the more important for forecasting purposes YoY% comparisons, initial claims were actually lower by -0.4% than the same week last year, while the four week average remained higher by 5.8%, and continuing claims higher by 5.3%:


Again, this indicates the labor market was not as strong as last year, but it still denotes expansion.

This is also the indication from the “quick and dirty model” of the S&P 500 YoY compared with the 4 week average of claims (inverted):


It will take a couple more weeks of data before we know if the big jump in claims one week ago was just an outlier, or the beginning of a higher trend.

Wednesday, May 7, 2025

Leading employment sectors from the April jobs report - no definitive signs of peaking


 - by New Deal democrat


Let’s take a belated look at some of the more important datapoints that came out of last Friday’s employment report for April.

To start with, as I’ve mentioned numerous times, frequently service jobs (blue in the graph below) continue increasing all the way through recessions. It is goods producing jobs (red) that turn down in advance. As of now, both are still increasing:


In the fifty years after WW2, manufacturing employment turning down was an excellent indicator of an oncoming recession. But since manufacturing fled first to Mexico and then to China and other points in Asia, it is no longer sufficient; construction employment must also turn down. And while manufacturing jobs did peak in early 2023 (blue) but show signs of stabilizing in the past six months, construction jobs (gold) have continued to increase:


And the most leading sector of construction is residential building. These jobs (red) did decline in April, but it is far too soon to determine if that is just noise or not. The other “last shoe to drop” in the housing sector before a recession starts is new homes for sale (blue). These have shown signs of peaking over the past six months, and may have made their cycle peak in January:


Note that all of the above numbers are “organic,” as they don’t reflect the impact of T—-p’s tariffpalooza. At least, not yet.
 

Tuesday, May 6, 2025

Consumers continue to front-run tariffs, now with an energy tailwind


 - by New Deal democrat


Back in March I took a look at how producers and consumers reacted to periods of high political policy uncertainty, concluding that usually in the past consumers had reacted first, somewhere between almost simultaneously to with a one quarter delay, and producers reacted afterward to the downturn in demand by cutting back on new orders, especially for durable goods.


The interesting twist this time is that consumers are bracing now for an upturn in prices, and even more for some empty store shelves. So this time around, rather than pulling in their horns, consumers are front-running tariffs and shortages by stockpiling supplies.

This has been showing up in the weekly Redbook consumer spending updates, which track retail spending YoY. For the last five weeks, it has had among the highest YoY readings since late 2022:


Some of this in the first several weeks probably had to do with Easter week being three weeks later this year than last year, but the surge in spending has continued for several weeks beyond that period, so clearly more is going on - and it is almost certainly front-running of expected supply disruptions. 

Consumers have also continued to spend on restaurants, typically one of the first places where they cut spending:


Again, there was a big YoY spike in early April due to the YoY change in Easter week, but the pattern of 7%-8% or so increases YoY has continued.

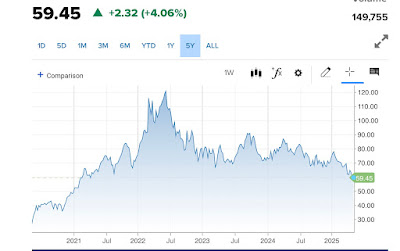
Another tailwind for consumers is that oil prices have fallen below $60/barrel, the lowest price in over four years:


This is likely to result in gas prices back under $3/gallon shortly.

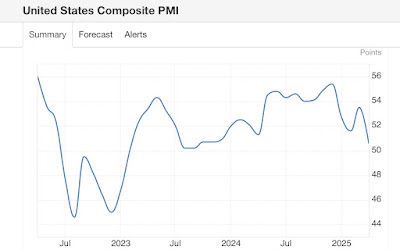
The other reversal from past episodes of uncertainty is that it is importers and producers relying on those importers who have cut back. Yesterday I noted that the ISM services index had rebounded somewhat in April over March. But the S&P has a competing Purchase Managers Index, which only has about a 20 year history; and one difference there is that they do calculate a composite manufacturing + services economically weighted index.

And in April that composite index declined to a two year low:


The index is still slightly above 50, so it indicates a slightly expanding economy, which is the same result I came to using an economically weighted average of the ISM indexes.

In any event, although the economy remains at heightened risk, the “instant recession” some saw in early April has not materialized. 

Monday, May 5, 2025

Eveonomically weighted ISM averages continued slow deceleration in April despite rebound in servies


  - by New Deal democrat


Because manufacturing is much less important to the economy than in the decades before the Millennium, the economically weighted average of the ISM services index (75%) as well as manufacturing (25%), especially over a three month period, has been much more accurate since 2000.


In April the important aspects of the services report reversed higher, as the headline number rose 0.8 to 51.6, and the more leading new orders reading rose 1.9 to 52.3. Recall that in these indexes 50 is the dividing line between expansion and contraction, so these are decent expansionary numbers.

Interestingly, this report is in sharp contrast to the regional Fed nonmanufacturing reports, which on average showed sharp contraction are declines.

Below are comparisons of the headline manufacturing and services indexes:


And for the manufacturing and services new orders indexes:


Here are the three months in the headline numbers (first line) and the three month average for services, plus the same as to the new orders services subindex (second line):
53.5, 50.8, 51.6 —> 52.0
52.2, 50.4, 52.3 —> 51.6 

Since the three month headline and new orders averages, respectively, in the manufacturing index were 49.3 and 47.0, this means the economically weighted average for the total index is 51.3, and for new orders is 50.5. This compares with the three month economically weighted averages of 51.8 and 50.9 for March.

In sum, despite this month’s rebound in services, the economically weighted services averages continue to show deceleration; while the manufacturing averages have resumed steady slight contraction after a spike from front-running tariffs. The headline total measure remains in weak expansion, while new orders for the entire economy are right on the cusp of tipping into contraction.