Saturday, June 3, 2023

Weekly Indicators for May 29 - June 2 at Seeking Alpha


 - by New Deal democrat


My “Weekly Indicators” post is up at Seeking Alpha.

Much like yesterday’s employment report, which showed a deep bifurcation between the Establishment and Household Surveys, the economy as a whole is also showing a deep bifurcation between elements well into recessionary territory, and elements showing strong growth. Together they net out to drifting sideways at a very weak growth level.

As usual, clicking over and reading will bring you up to the virtual moment on the economic data, and bring me a little lunch money.

Friday, June 2, 2023

Dueling May jobs reports: establishment report strong, household report pre-recessionary


 - by New Deal democrat


My focus for this report continued to be whether the leading sectors and other indicators  continued to decline, and whether the pace of growth continued to decelerate.

The establishment side of the report was strong, with most leading indicators improving. But the household side was not just weak, it was negative, with an outright loss of jobs, and a significant increase in the unemployment rate, which turned higher YoY for the first time during this expansion.

Here’s my in depth synopsis.


HEADLINES:
  • 339,000 jobs added. Private sector jobs increased 283,000. Government jobs increased by 56,000. 
  • March was revised higher by 52,000 (still -19,000 below its original number) and April by 41,000, for a total of +93,000. The three month moving average increased to 282,000.
  • As highlighted above, the alternate, and more volatile measure in the household report *declined* by -310,000 jobs. The YoY% gain in this report is only +1.5%.
  • The U3 unemployment rate rose 0.3% to 3.7%. The civilian labor force, the denominator in the figure, rose slightly, while the numerator, the number of unemployed, rose sharply to a 12+ month high.
  • U6 underemployment rate rose 0.1% to 6.7%.

Leading employment indicators of a slowdown or recession

These are leading sectors for the economy overall, and help us gauge how much the post-pandemic employment boom is shading towards a downturn.  These were mixed:
  • the average manufacturing workweek, one of the 10 components of the Index of Leading Indicators, was unchanged at 40.7, down -0.9 hours from February peak last year of 41.6 hours.
  • Manufacturing jobs decreased by -2,000.
  • Construction jobs increased by 25,000.
  • Residential construction jobs, which are even more leading, rose by 2,400. It nevertheless appears likely that January was the peak for this sector.
  • Temporary jobs, which have generally been declining late last year, rose this month by 7,700.
  • the number of people unemployed for 5 weeks or less increased 217,000 to 2,183,000.

Wages of non-managerial workers
  • Average Hourly Earnings for Production and Nonsupervisory Personnel increased $.13, or +0.3%, to $28.75, a YoY gain of 5.0%, tying April for the lowest YoY gain since June of 2021.

Aggregate hours and wages: 
  • the index of aggregate hours worked for non-managerial workers increased 0.2%.
  •  the index of aggregate payrolls for non-managerial workers rose 0.7%, and increased 0.1% YoY to 6.8%, just above last month’s low since March 2021. With inflation decelerating, the working/middle classes almost certainly were able to put more money in their pockets.

Other significant data:
  • Leisure and hospitality jobs, which were the most hard-hit during the pandemic, rose 48,000, -349,000, or -2.1% below their pre-pandemic peak.
  • Within the leisure and hospitality sector, food and drink establishments added 33,100 jobs, and are now only -51,700, or -0.4% below their pre-pandemic peak. 
  • Professional and business employment rose 64,000. This series has also been decelerating, but has stabilized in the past few months, currently up  2.5% YoY.
  • The Labor Force Participation Rate was unchanged at 62.6%, vs. 63.4% in February 2020.
  • The number of job holders who were part time for economic reasons declined -164,000.
  • Those not in the labor force at all, but who want a job now, increased 206,000 to 5.477 million vs. its best level of 4.761 shortly before the pandemic, and vs. its post-pandemic low of 4.925 million two months ago.


SUMMARY

As is so often the case, this was a mixed report. The “employment” part was very good, both in the overall number of jobs gained, but also the increase in most leading sectors. Wages, aggregate hours, and aggregate payrolls also gained, the latter sharply. Restaurant jobs are within a month or two of finally exceeding their pre-pandemic peaks. Revisions were positive as well.

But the “household” part of the report was outright negative. Jobs were actually lost, the number of unemployed increased sharply, and the unemployment rate increased sharply as well, turning higher YoY for the first time during this expansion. The number of those who want a job but aren’t actively looking also may have reversed higher. Since March 2022, the household report has only shown a gain of 1.5%, while the establishment report has shown a job increase of 3.1%.

The establishment report was strong; the household report was pre-recessionary.

Thursday, June 1, 2023

Intensified decline in manufacturing, but another sign of a bottom in residential construction


 - by New Deal democrat


As usual, we start the month with reports on last month’s manufacturing, and construction from two months ago.


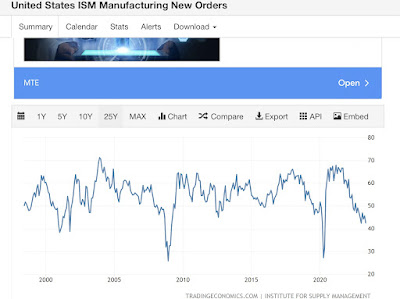
The ISM manufacturing index has a 75 year record of being a very reliable leading indicator. According to the ISM, readings below 48 are consistent with an oncoming recession. And there, the news is not good. Not only has the index been below 50 for the past 7 months, it has been below 48 for the past 6.

This month, the total index declined to 45.7, a new post-pandemic low. Perhaps even worse, the new orders subindex, which is the most accurately leading component, and which has been in contraction since last summer, declined to 42.6, just 0.1 above its post-pandemic low:


This is recessionary, plain and simple. The one caveat in this case is that the narrow but very important sector of manufacturing which is not partipating in this downturn is motor vehicle manufacturing, where supply shortages are still being resolved.

Now let’s turn to construction spending, which told a completely opposite story. Total construction spending rose 1.2% in April, and the leading component of residential construction spending rose 1.3%:


For the past several years, I have been adjusting the nominal numbers by the PPI for construction materials. This had been declining, but have been rising all this year, and rose another 0.5% in April. So adjusted, total real construction spending did increase, but residential construction spending declined slightly:


This was a very mixed start to the month, with an intensified decline in manufacturing, but yet another sign of a bottom in residential construction.

New and improved initial claims! Now including comparison to Sahm Rule


 - by New Deal democrat


I’m making an important addition to my weekly blurb on jobless claims this week: I’m showing how it compares with and leads the Sahm Rule.


Just in case you’re not familiar with the Sahm Rule, it is a rule of thumb started by economist Claudia Sahm, stating that the economy is in a recession when the 3 month average of the unemployment rate rises 0.5% from its low of the previous 12 months. Note that this is a statement of sufficiency, not necessity, as recessions have *started* with even a 0.1% change in the unemployment rate. But the Sahm Rule has always been triggered within a few months thereafter. It is a “nowcast” tool designed to tell the reader that the NBER will declare the economy is in recession well before the NBER itself does so.

So let’s see how initial jobless claims relate to the Sahm Rule.

First, to this week’s data: initial claims rose 2,000 to 232,000, while the 4 week moving average declined -2,500 to 229,500. With a one week delay, continuing claims rose 6,000 to 1.795 million. Here’s what that looks like compared with the last 18 months:


More importantly for economic forecasting, YoY initial claims are up 14.9%. The more important 4 week average is up 8.1%, and continuing claims are up a very big 28.3%


The 4 week average remained below my 10% threshold for a recession watch yellow flag once again. On the other hand, continuing claims on a weekly basis are up 28.3% YoY. For the month of May so far, they are up on average 27.1%. As shown in the below graph, which subtracts 27.1% (gold) from all pre-pandemic readings,this is much more ominous:


The gray line above tracks the same data, subtracting 10% instead of 27.1%, to show that a YoY% increase in continuing claims has *always* been consistent with the onset of a recession.  Continuing claims crossed that threshold in March.

Now, premiering my new and improved forecasting, comparing initial and continuing claims with the Sahm Rule.

Most importantly, as I’ve said many times for about 15 years, initial claims leads the unemployment rate. Here’s the long term history up until the pandemic:


Initial claims both increase and decrease several months before the unemployment rate does.

Here’s the post-pandemic relationship:


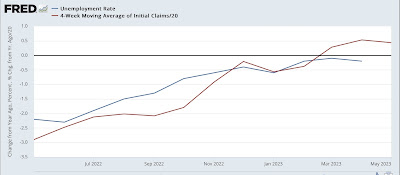
The 4 week average of initial claims has been significantly higher YoY ever since March. This strongly suggests that the unemployment rate, currently unchanged YoY, will head higher shortly as well, perhaps as early as in tomorrow’s report.

FRED helpfully specifically tracks the Sahm Rule, which appears in black in the graphs below. 

Here are the first 50 years leading up to the pandemic. In the below graphs, I subtract 0.5% from the Sahm Rule line, so that it shows as zero. I’ve similarly subtracted 12.5% and 10% from initial and continuing claims so that level shows as zero as well. Note I’ve also divided both measures of claims by 20 for scale purposes only:


Although there are some squiggles, you can see that both the 4 week average of initial claims and continuing claims, averaged monthly, have led the Sahm Rule in every single case, just as we would expect, based on the above discussion.

Now here is the post-pandemic relationship of the same graph:


As above, we should expect the Sahm Rule indicator to increase shortly. We should also expect the 4 week average of initial claims to increase over 12.5% before or at the onset of a recession. We’re not quite there yet.

I will continue to track this relationship in future updates as well.
Wednesday, May 31, 2023

April JOLTS report noisily shows continued deceleration


 - by New Deal democrat


It is always a bad idea simply to project a current trend forward, especially with data series that are noisy and heavily revised. That was certainly on display with the April JOLTS report.


For the last several years, the jobs market has been a game of “reverse musical chairs,” where there are always more chairs than participants. Those employers whose chairs weren’t filled had to increase their wage and/or benefits offerings, or go without. This was good for labor, but certainly put pressure on prices as well. 

Because the jobs market has remained so strong, it has been unlikely that a recession would start unless the situation with job openings returned to at least close to its pre-pandemic levels. Only then could there be enough layoffs to actually be consistent with a negative monthly jobs number.

Last month, there were steep declines in job openings and hires also declined significantly. This morning’s report reversed some of those dynamics, while the overall trend of deceleration remained intact. 

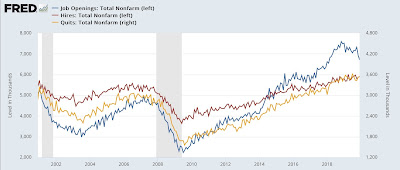
Job openings (blue in the graphs below) rose 353,000 (from a March number revised higher) to 10.013 million annualized (from a peak of 12.027 million in March 2022, vs. 7 million just before the pandemic), and actual hires (red) rose 47,000 from a downwardly revised March to 6.115 million (vs. a peak of 6.843 million in November 2021 and 6 million just before the pandemic).  Voluntary quits (gold) declined -49,000 to 3.793 million (vs. a peak of 4.501 million in November 2021 and 3.5 million just before the pandemic:


All of the above remained close to 2 year lows. 

Here is the longer term view of all 3 metrics from the series inception, better to show the current situation with the historical one before the pandemic hit:


All three remain at levels higher than at any time before the pandemic hit.

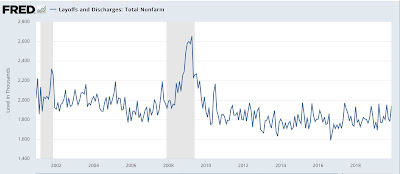
Contrarily, layoffs and discharges decreased -264,000 to 1.581 million annualized, reversing last month’s big increase:


But even so, April’s number remains well above the average for the past 2 years.

Here is the longer term historical record for layoffs showing how, before the pandemic, the current level would be extremely low:


There are two overarching trends in this data:

(1) the absolute fundamentals for labor remain quite positive,
(2) but they continue to decelerate.

All of the above remains consistent with a very positive jobs report this coming Friday, but continuing to show deceleration compared with the last 12 months.

Tuesday, May 30, 2023

House prices may have bottomed, while YoY price increases (leading inflation) have declined to lower than their 25 year average


 - by New Deal democrat


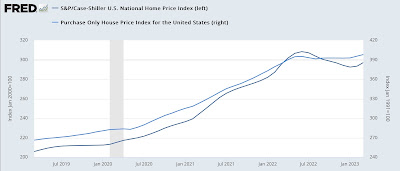
Seasonally adjusted house prices through March as measured by both the FHFA (light blue in the graphs below) and Case Shiller (dark blue) Indexes rose, the former by 0.7% and the latter by 0.2%. This is the second straight increase in a row, and suggests that house prices may have bottomed:


As I usually say, prices follow sales, and it is likely that as sales (single family permits, red below) bottomed during the winter, prices are following suit:


But because house prices were increasing at about 2%/month one year ago, the YoY% changes have continued to decelerate sharply, with the FHFA index up 3.6%, and the Case Shiller index up only 0.7%. The below graph subtracts the current reading to norm at 0 for comparison with past performance:


YoY house prices are increasing more slowly than at any time except during and right after the 2001 and Great Recessions, while the FHFA index is also increasing slightly faster than the first half of the 1990s as well. But the fact remains that YoY house price inflation is now less than what it has been for most of the past 25 years.

This continues to imply a coming decrease in shelter inflation in the CPI. The below graph again shows the YoY% changes in the FHFA and Case Shiller Indexes ( /2.5 for scale), and compares them with YoY Owners’ Equivalent Rent (red), which makes up 25% of the entire CPI:


The implication is that the shelter component of CPI is going to be down to a YoY increase of only about 2% by roughly the end of next winter.

Finally, the last part of my housing mantra is that inventory follows prices. As prices decline, fewer people want to put their houses on the market, especially with the huge increase in mortgage rates. And this is what has happened:


I wrote at the end of last month’s article that the Fed was in a conundrum. That’s because, by raising interest rates, the Fed is effectively constricting housing supply - where there was already a shortage in historical terms. So, paradoxically, raising rates acts to put a floor under future shelter inflation. But of course lowering rates, by making houses more affordable, would act to drive up prices, at least until such time as the shortage is relieved.

Monday, May 29, 2023

Memorial Day 2023


 - by New Deal democrat


Memorial Day is that most somber of national observances, in which we remember all of those who gave their lives so that the government of the People, by the People, and for the People; where aspirationally the People, even those holding the highest offices, have agreed to live under the Rule of Law; shall not perish from the earth.


As the world witnesses revanchist authoritarian States prepare for or even undertake invasions of their neighbors, a revival of the old Great Power politics, this year let me highlight several resting places of those who gave their lives against such authoritarian militarism.

The World War I Meuse-Argonne American Cemetery and Memorial:


The National Memorial Cemetery of the Pacific, Punchbowl, Hawaii:


5th Marine Division Cemetery, Iwo Jima:


May they rest in peace, and may the living generation uphold the values for which they made the ultimate sacrifice.