Saturday, August 13, 2016
Weekly Indicators for August 8 - 12 at XE.com
- by New Deal democrat
My Weekly Indicator post is up at XE.com.
Not much change except negatively to rail and LIBOR.
Friday, August 12, 2016
Indian Summer for the economic expansion
- by New Deal democrat
This morning's July retail sales and June total business sales and inventories continue the string of generally stronger data over the last few months. I finally have a good way to describe this waxing of the economy, even though the expansion is past mid-cycle: Indian Summer.
This post is up at XE.com.
Thursday, August 11, 2016
Bonddad's Thursday Linkfest
Productivity growth was negative for the third consecutive quarter, defying economists' expectations for a pick-up of 0.5 percent.
Meanwhile, the National Federation of Independent Business reported that the share of employers who say they're having trouble filling job openings remains relatively high.
Like anything else, the cost of labor gets higher as it gets more scarce. This dynamic should incent businesses to start spending more on capital, rather than continuing to bid up wages, in order to boost production. Capital deepening, in turn, is a key driver of productivity: when workers have more/better/newer equipment, they're generally able to produce more output per hour.

The amount of new money raised by exchange traded funds exposed to global stock markets has dropped 85 per cent in the first half of 2016, in a rare sign of pressure on the passive investment industry.
Equity ETFs that track an index attracted a net $15bn from investors in the first half of this year, a significant decline on the $102bn invested over the same period in 2015, according to ETFGI, the data provider.
Investors turned their backs on equity ETFs because of volatile trading conditions in January and February, followed by concerns about the impact of the UK’s vote on EU membership, according to Ben Seager-Scott, director of investment strategy at Tilney Bestinvest, the wealth manager.
Oil is At Several Key Fibonacci Levels

Wednesday, August 10, 2016
LMCI, JOLTS reports continue to suggest late cycle deceleration
- by New Deal demorat
I have been generally unimpressed with the Job Openings and Labor Turnover Survey (JOLTS) for over a year, and like many others I have found the Labor Market Conditions Index a source of concern. Since both were updated ths week, let's take an updated look.
First of all, for the first time this year the LMCI rebounded into positivity (blue in the graph below)

This is a pretty good indication that a recession is some ways off. But before you cheer too much, note that the LMCI does a pretty good job forecasting the direction of the YoY change in employment (red). So even with this month's good LMCI reading, the overall direction is still towards the negative.
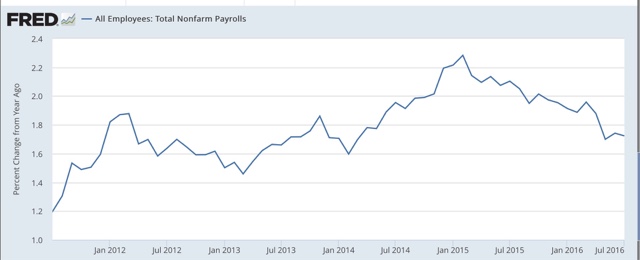
While I'm not forecasting any actual negative monthly job reports in the near future, even with the last two months' great numbers, the YoY payrolls graph still shows continued deceleration:
Today's JOLTs report, which covers June, also shows continued deceleration. For over a year I have noted that the pattern was similar to that in late in the last expansion, and the June report was more of the same.
First, here is a comparison of job openings (blue) and hires (red). Because there is only one compete past business cycle for comparison, lots of caution is required. But in that cycle, hires peaked first and then openings continued to rise before turning down in the months just prior to the onset of the Great Recession:

Through June, 2016 looks very much like 2006, or even early 2007.
After making a new post-reession record five months ago, quits have since fallen back at their late 2015 level. There had been a welcome positive increasing trend in quits earlier this year, but the pullback of the last few months calls that into question, and is consistent with the 2006 or early 2007 flatness in the last cycle. In the graph below, quits are inverted, and since they also appear very consistent with, and to slightly lead, the unemployment rate (red), that is also shown:

If the recent pullback is establishing a new flat (or worse!) trend, then the unemployment rate probably made its cycle low a few months ago.
In summary, both the LMCI and the JOLTS reports have been adding to the accumulating evidence that we are getting late in the expansion, but on the positive side, if we follow the 2001-07 template, and taking into account the recent improvement in the long leading indicators, there are stll another 12 - 24 months to go of jobs growth.
Tuesday, August 9, 2016
Wholesale sales and inventories point to renewed growth
- by New Deal democrat
While we'll get a more complete picture on Friday, this morning's release of wholesale sales and inventories supplies yet more evidence that the shallow industrial recession bottomed in March.
Without doubt, the inventory to sales ratio has been the most Doomish statistic of this past year. All of the usual suspects pointed to this as surefire proof that the economy was falling into a full-fledged recession. But as I've pointed out for months, the inventory to sales ratio tends to make a peak in about mid-slowdown or recession, and declines as the economy is exiting the downturn. So here is what the wholesale inventory to sales ratio looks like through June:

It has failed to make a new high in months, and today's data showed an unambiguous decline.
Of import, note that this ratio also increased going into slowdowns such as the 1998 Asian currency crisis, not just during full-fledged recessions.
As I have also continually pointed out, the sequence is that sales turn up before inventories do. That's what is shown by decomposing the ratio into sales (red, left scale) and inventories (blue, right scale):

In a recession, the ratio primarily decreases via a sharp decline in inventories, whereas in slowdowns like 1998 the ratio primarily decreases via a renewed increase in sales -- which is what we have seen this year.
I'll have more to say Friday when we get retail and whole business sales and inventories.
Bonddad's Tuesday Linkfest

Emerging Market Relative Rotation Graph


Weekly Chart of the UK ETF

5-Year Chart of the Pound/Dollar

5-Year Chart of the Pound/Euro

Labor Market Conditions Index Improves

This is the time it's been positive in 6 months
Subscribe to:
Posts (Atom)