Saturday, February 18, 2023

Weekly Indicators for February 13 - 17 at Seeking Al;pha


 - by New Deal democrat


My Weekly Indicators post is up at Seeking Alpha.

There are two trends percolating under the surface. One trend is the continued slow decaying of growth in the coincident indicators. The other is the slow move towards turning neutral or positive among some of the long and even short leading indicators.

No forecast at this point, but I am beginning to suspect that, while there will be a recession, it will be relatively short and relatively mild.

As usual, clicking over and reading will bring you up to the virtual economic moment, and reward me a little bit for my efforts.

Friday, February 17, 2023

Real average wages and real aggregate payrolls for nonsupervisory workers through January


 - by New Deal democrat


With no new data today, to close out the week let’s update real average wages and aggregate payrolls for nonsupervisory workers. This is the best way, based on monthly data, to see how average Americans are doing financially.


While average nonsupervisory wages increased 0.2% in January, consumer inflation increased more, at 0.5%, meaning that real average hourly wages decreased -0.3%. They are down -2.1% since December 2020:


Much of the decline in real wages has had to do with the big increase in gas prices during the first half of 2022.

If real hourly wages have declined, that has been made up by the powerful increase in the number of jobs worked. As a result, nominal aggregate payrolls are up 22.8% since December 2020:


Adjusting for inflation, aggregate payrolls for nonsupervisory workers are still up 7.1%:


In the past, when real aggregate nonsupervisory wages have not risen for a year, that has been a reliable recession signal - which makes perfect sense, since if most working Americans’ financial situations have stalled out, they are likely to rein in spending, if not actually cut back. With the substantial upward revisions to nonfarm payrolls for 2022, as can be seen above that situation has improved, and real aggregate payrolls have rebounded to being up almost 3% YoY as of January:


Thursday, February 16, 2023

Slight decline in housing construction: the negative actual economic impact has not yet begun


 - by New Deal democrat


Housing permits (gold) increased slightly in January from their December lows, while the more volatile housing starts (blue) declined again. The much less volatile single family permits (red, right scale) also declined again to a new post-pandemic low:


This is a very important long leading indicator, and shows that coming misery in the economy due to housing sector is nowhere near bottoming out.

But, as I wrote on Monday, the most important metric in the entire economy right now is probably housing units under construction, which is the “real” economic impact of the industry. Here there was a very slight (less than 1%) decline from a revised peak in October:


The bottom line is that the actual *economic* downturn in housing has not begun yet.

Initial claims: nobody is getting laid off, but slight weakness in continuing claims compared with 2022


 - by New Deal democrat

Initial claims remained below 200,000 at 195,000, while the 4 week average increased very slightly to 189,500. Continuing claims increased to 1,696,000, the third highest number in over a year:


Holiday seasonality has ended. It continues to be the case that almost nobody is getting laid off. Very slightly on the other hand, the relatively elevated number of continuing claims suggests a little weakness compared with 2022.

Wednesday, February 15, 2023

Despite sharp rebounds in retail sales and manufacturing production, both metrics are on the cusp of being recessionary


 - by New Deal democrat


Retail sales for January rose strongly in January,up 30% in nominal terms and up 2.4% after accounting for inflation. While that looks great, it only reverses the two downward readings of November and December, and is similar to the reversal last January. This makes me think that there is unresolved Holiday seasonality at work. In any event, real retail sales remain -0.8% below their April 2022 peak:


Further, as I’ve noted many times, real retail sales going negative YoY, at least for more than one or two months, has been an excellent harbinger of incoming recession. In fact, the relationship goes back about 75 years. Here is the period from 1993 through 2019::


While I’ve discounted the negative numbers from spring 2021 because of distortions due to comparisons with the spring 2021 stimulus months, there is no distortion in those of the last few months since September. Here’s the last 18 months:


For January, YoY retail sales were up less than 0.1%, rounding to unchanged. The last 5 months have been on the cusp of recessionary readings. Further, as the red line implies, nonfarm payrolls should continue to decelerate, despite January’s strong jobs number.

The report on industrial production, the King of Coincident Indicators, was not very different. Total production was unchanged, and is -1.6% below its October peak. Manufacturing production rose a strong 1.0%, but nevertheless is -2.0% below its April peak:


Industrial production, if it were taken by itself, would suggest that we are already in a shallow recession.


Tuesday, February 14, 2023

Measured by actual rather than fictitious prices, inflation is decelerating substantially towards the Fed target ADDENDUM: the huge impact of shelter


 - by New Deal democrat


For the last year, consumer prices have mainly been about two things: (1) the huge rise, and then fall, in gas prices; and (2) the phantom menace of owner’s equivalent rent dragging shelter prices higher, even as actual house prices peaked, and new rental prices declined as well. That remained the case this month.

Last month I wrote that “I suspect that oil prices have bottomed for the while, and so the virtuous decline in gas prices that has followed is at an end . . . In short, I do not expect the string of excellent CPI reports to continue.“


That was certainly true in this morning’s report for January. Energy prices increased 2.0% for the month, the highest since June. Overall prices rose 0.5% for the month, also the highest since June. But core inflation came in at +0.4%, still elevated but about average for the past year.

Still because the price increases in January were less than one year ago, YoY price increases continued to decelerate. At 6.3%, total inflation (blue below) was the lowest YoY since October of 2021. At 5.5% and 6.2%, core inflation (red) and prices ex-energy (gold) had the lowest YoY increase since December 2021. And energy YoY (gray, right scale) at 8.2% YoY was far below its 42% peak of last June:


At +0.5% for the month and 10.1% YoY, food inflation remains a problem, but even that metric has decelerated from peak:


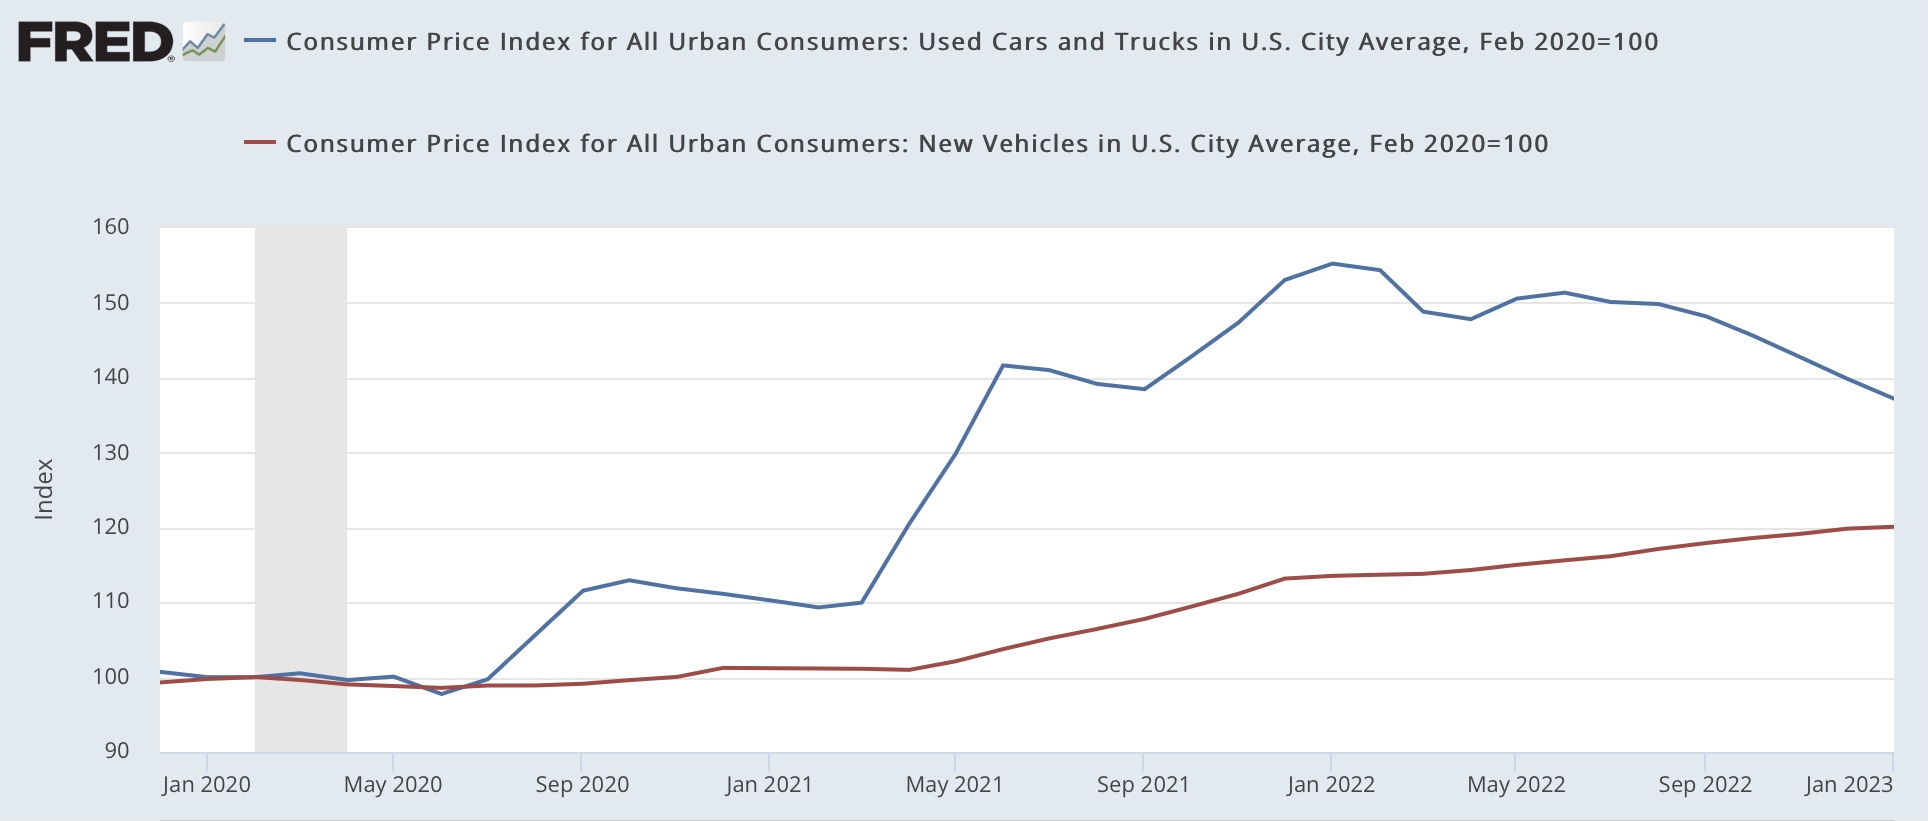
New car prices were only up 0.2% for the month and 5.8% YoY, while used vehicle prices declined -1.9% for the month and -11.6% YoY. Nevertheless they are up 20.1% and 37.2% respectively since the onset of the pandemic:


Finally, as I noted at the outset, the phantom menace of owners’ equivalent rent continues to drag both total and core inflation higher. OER increased 0.7% for the month (slightly below its 0.8% monthly peaks, but YoY OER is up by yet another new record of 7.8% (blue in the graph below). This contrasts with actual house prices YoY as measured by the FHFA, which have declined sharply since last summer’s peak of 20%, and as of October were up 11% (red):


If the FHFA index continues to decline in its next several reports at its latest trend, then for January its actual reading will be only about +5.3% YoY - as OER will probably continue to rise at least slightly.

Replace the phantom menace of OER with actual house prices, and total inflation would probably be about 0.8% less, or about 5.5% YoY, and core inflation would be about 1.0% less, or 4.5%.

The bottom line is that the virtuous input of lower gas prices is probably over, but inflation - at least if we were to measure it by actual rather than fictitious prices - is decelerating substantially (with the exception of food, which remains problematic), and could approach the Fed’s target by spring sometime.

ADDENDUM: I wanted to emphasize further the impact of shelter on recent, and especially this morning’s, CPI.

First of all, CPI ex-shelter has actually *declined* -0.8% since last June:


This isn’t exactly unprecedented, but as the graph below that shows the q/q% change in CPI ex-shelter shows, it didn’t happen at all between the 1960s and the turn of the MIllenium, and it has happened a number of times since the housing bust of 2006 on:


To really show you the impact of OER vs. actual house prices on shelter, the below graph shows the YoY% change in CPI ex-shelter(blue), currently at 5.7%, CPI for shelter (which uses OER, red), and the FHFA monthly house price index through its most recent reading (gold):


Again, if house prices were used in CPI instead of OER, and continue to decline as per their recent trend, then inflation would be on track to be close to the Fed’s target by spring sometime.

And even if there is a justification for using OER for inflation, given its 1 year+ lag of house prices, there is no reason for the Fed not to use a house price-adjusted CPI measure for setting interest rates.


Monday, February 13, 2023

The #1 likely reason I suspect the economy has not gone into recession yet


 - by New Deal democrat

I’ve been reading increasing talk about the fabled “soft landing,” or alternatively, “rolling recession.”  For example, over the weekend Liz Ann Sonders of Schwab told “Wall Street Week” that housing is already in a recession, but the larger services side of the economy was still in good shape.


Let me start out by noting that the goods side of the economy has almost always rolled over first, as shown in the graph below: 


That’s why things like the manufacturing workweek and the ISM manufacturing index are leading indicators, while consumer spending on services is not.

But here’s a bigger issue: despite the huge downturn in housing permits and starts, that important sector isn’t really in recession yet at all! That’s because, due to the supply chain issues in building materials that plagued the industry last year, the number of houses under actual construction hasn’t turned down at all. In fact, last month it was at a new record high:


And why do I think that is the #1 reason the economy hasn’t gone into recession yet? Below is a graph of the YoY% change in housing units under construction (blue) vs. the YoY% change (*4 for scale) in real GDP (red):


There has *never* been a time when real GDP turned negative YoY without housing construction having turned negative YoY first. Never.

And as the graph shows, as of December YoY housing units under construction were up 12%.

I fully expect this to turn down sharply, and soon. Of course, it has been something I have expected for a few months already. We’ll find out what happened in January when housing permits, starts, and construction for January are reported on Thursday.

Sunday, February 12, 2023

Weekly Indicators for February 6 - 10 at Seeking Alpha


 - by New Deal democrat


I neglected to post the link to this yesterday, so let me do it today.

My Weekly Indicators post is up at Seeking Alpha.

We continue to see a slow drip, drip, drip of ever so slightly more negative coincident data, without it crossing over into firm recessionary territory.

I have a feeling I know what the crucial reason why is, and that metric will be updated this coming week (that’s a teaser, folks).

Anyway, as usual clicking over and reading will bring you up to the virtual moment as to the state of the economy, and reward me a little bit for my efforts.