Saturday, August 24, 2019
Weekly Indicators for August 19 - 23 at Seeking Alpha
- by New Deal democrat
My Weekly Indicators post is up at Seeking Alpha.
There was marginal deterioration in a number of short leading and coincident indicators this week.
As always, clicking over and reading should bring you up to date on the economy as well as rewarding me a little bit for the effort I put in.
Friday, August 23, 2019
July new home sales disappoint, but improving trend intact
- by New Deal democrat
New home sales came in this morning at a light 655,000 annualized for July, the second lowest monthly amount this year. But at the same time, sales remain clearly higher than their bottom at the end of last year. This metric is very volatile and heavily revised, so I pay less attention to it than permits and starts. In the two graphs below, it is shown in blue, and compared with inventory of new homes for sale (red, right scale):
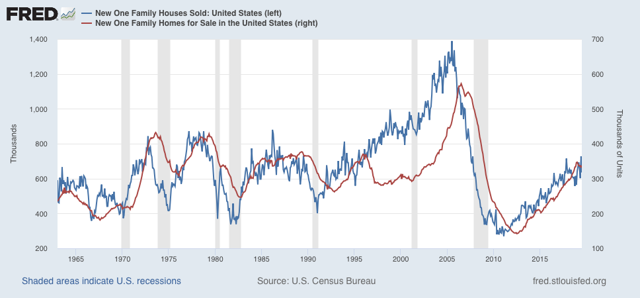
Note that sales clearly lead inventory. The below close-up of the past 5 years bears this out:
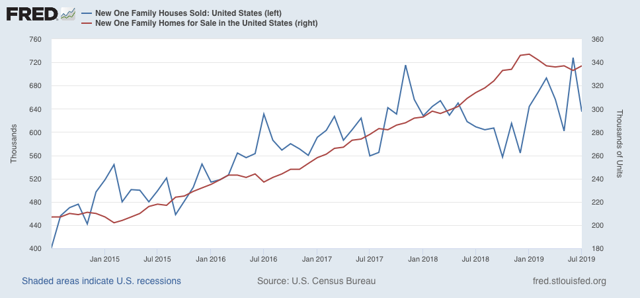
Sales are already recovering, while inventory remains slightly off its peak.
Prices (gold in the graph below, measured as YoY% change) usually lag sales (blue), but last year they followed sales down almost immediately, and remain negative YoY:
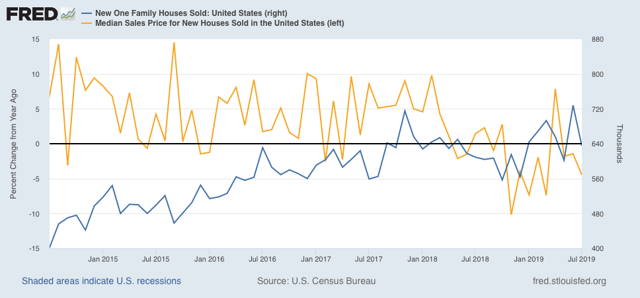
The combination of lower prices and lower mortgage rates should help out the rebound in sales from the end of last year.
Meanwhile, the economically less important existing home sales, reported earlier this week, continued to rebound:
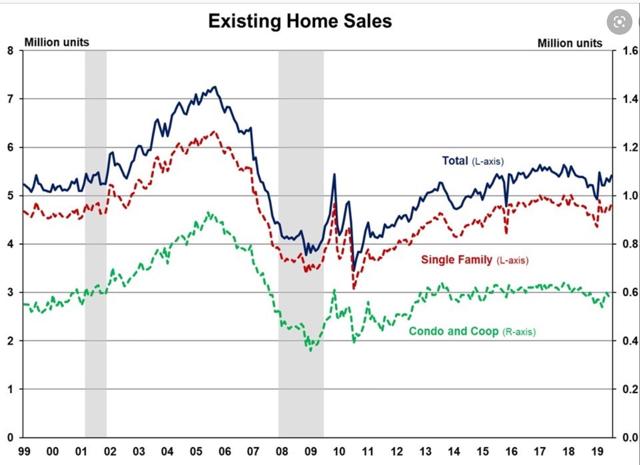
Housing is flashing weak positive signs for economic growth next year. The question remains whether it will be enough to overcome other headwinds, like a decline in corporate profits and a stall in capital expenditures.
Thursday, August 22, 2019
An extended look at jobless claims, and a note about payrolls
- by New Deal democrat
Let’s take an extended look at jobless claims, with a side note about payrolls.
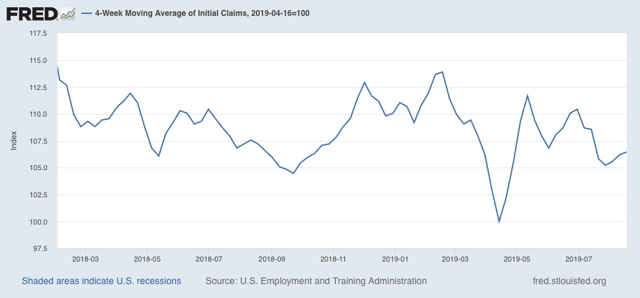
First, I have started to monitor initial jobless claims to see if there are any signs of stress.
My two thresholds are:
1. If the four week average on claims is more than 10% above its expansion low.
2. If the YoY% change in the monthly average turns higher.
Here’s this week’s update.
Initial jobless claims last week were 215,000. This is in the lower part of its range for the past 18 months. As of this week, the four week average is 6.5% above its recent low:
Additionally, the YoY change remains -1,500 below where it was last year:
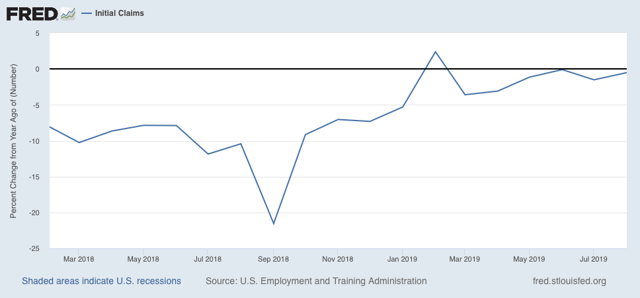
With one week to go, so far this month is averaging about -1,000 less than August of last year.
The less leading but also less volatile 4 week average of continuing claims was essentially unchanged, and remains slightly (-2.2%) below its level of one year ago:
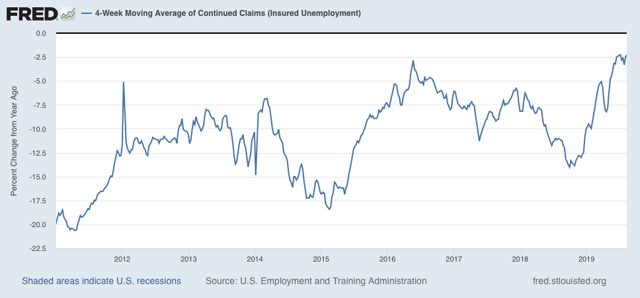
Bottom line: jobless claims are still positive, if weakly.
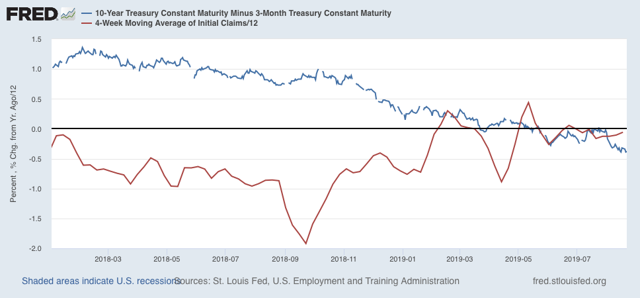
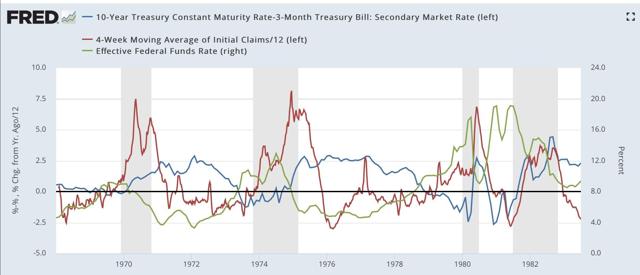
Second, with all the brouhaha about the yield curve inversion, I thought I’d take a look at the history of jobless claims (red in the graphs below) vs. the 10 year vs. 3 month yield curve (blue):
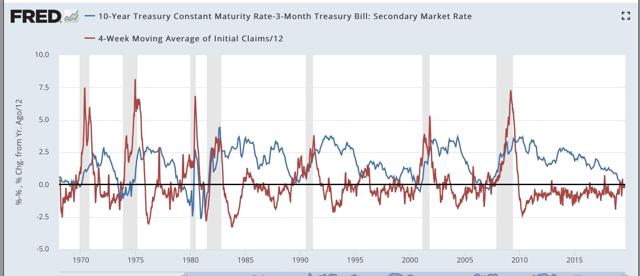
This is a 50+ year history, and every single time the yield curve inverted, during the period of that inversion initial claims turned higher YoY.
Here is a close-up on the past several years:
In this next graph, I also added the Fed funds rate (green, right scale). All we care about here is when it declines in comparison with the other two data series:
The inflationary era:
The more recent disinflationary era:
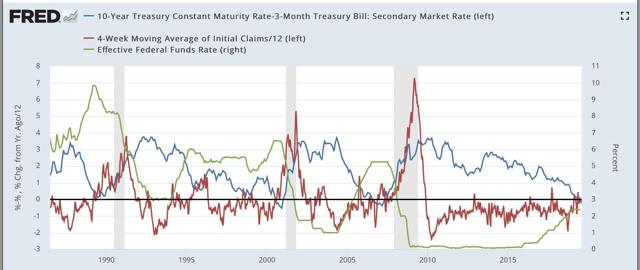
The more recent disinflationary era:
When the Fed has waited beyond the point where initial claims have turned meaningfully higher YoY to start to lower rates, that has meant a recession is on the way.
Third, and finally, yesterday the BLS indicated that the comprehensive measure of employment records from the states revealed that about -500,000 fewer jobs were added to the economy between March 2018 and March 2019. That’s a major downward revision.
While we won’t have precise monthly revisions for another 6 months, here is the best graphic estimate I found yesterday of what that will look like:
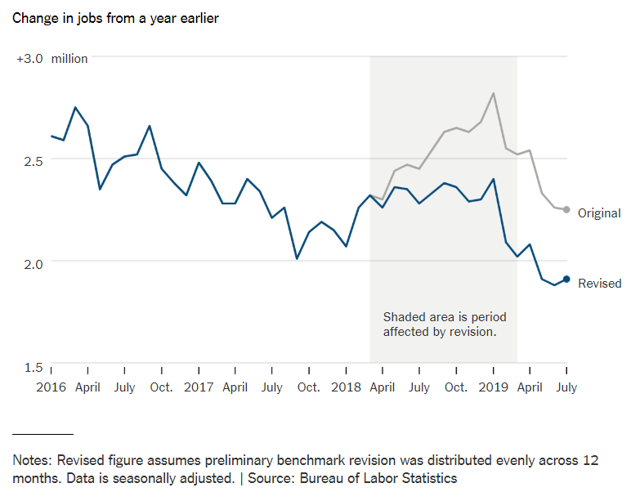
Since the average revision was about -40,000 jobs per month, if it were to have persisted through July, here is what that would look like (blue) compared with the existing alternative jobs number from the household survey (red):
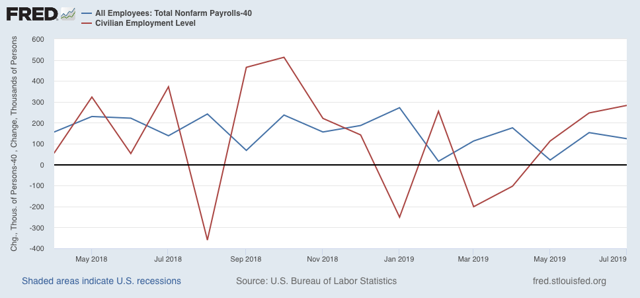
This strongly suggests that the weak household employment numbers we’ve been seeing this year have been signal, not noise. According to that survey, only about 350,000 jobs have been added this entire year so far.
Beyond that, we’ve been seeing a series of important downward revisions to a variety of data recently, including in monthly payrolls reports and unit labor costs. This is the kind of thing that happens at negative turning points. Which means it is especially important to keep an eye on data, like jobless claims (after one week) and the ISM manufacturing index, that don’t get revised.
Wednesday, August 21, 2019
Not doomed yet v.2.0: beware recession porn
- by New Deal democrat
Way back when I first started writing online almost 15 years ago, my very first post on Daily Kos was a little note called “Not Doomed Yet.” It was pretty pathetic compared with the standards of my writing since the Great Recession, but the point of it was, back in 2005, that the conditions necessary for an economic downturn hadn’t quite happened yet.
Needless to say, it went nowhere. To the contrary, my big recollection is that my posts that got the most attention by far were the ones I wrote once I did see that a recession looked baked in the cake. The simple fact is, when it comes to online clicks and reads, DOOOM sells.
This is a timely reminder, because I have noticed across a variety of platforms in which the economy is discussed, including back at Daily Kos, but also including financial sites and Twitter feeds, a surge in recession porn, I.e., why we are DOOOMED. Usually although not always this is because people have suddenly discovered that whatever portion of the Treasury yield curve they have focused upon has an infallible record of predicting the end of the world.
Now, over a year ago I forecast a sharp slowdown during this year. Over six months ago I went on “recession watch” with a starting date of Q4. So I’ve seen this coming for a long time. But I am disappointed to remind you, once again, that we are Not Doomed Yet.
There are at least three reasons for that.
First, while the “infallible” yield curve (except for the 1950s, 1966, and 1998) is forecasting recession, the *equally* “infallible” housing market (except for 2001) says no.
Additionally, long term interest rates have to fallen to, or at least near, expansion lows. Real money supply has been accelerating since the beginning of this year. Here’s what these long leading indicators look like together for the past 3 years:
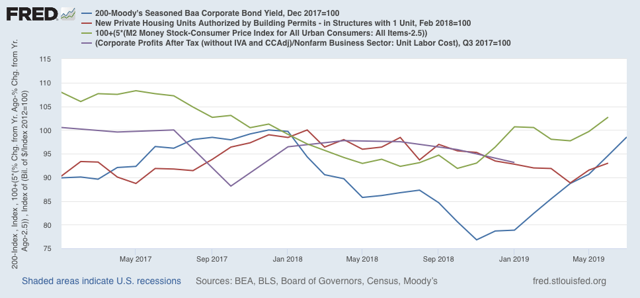
This is at very least as consistent with a near-miss as it is with an actual downturn.
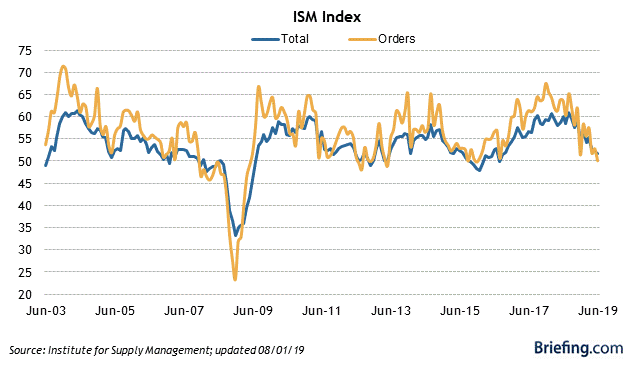
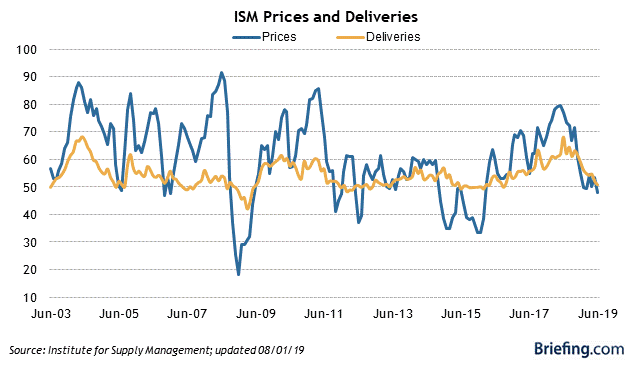
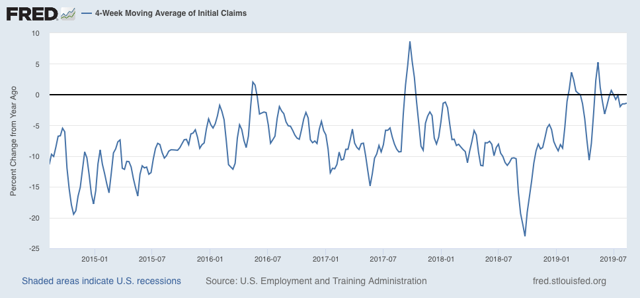
Second, the short leading indicators really haven’t confirmed the long leading indicators (of which the yield curve and housing are two) yet. In particular, neither the ISM manufacturing indexes (first two graphs below) nor initial jobless claims (third) have turned negative yet:
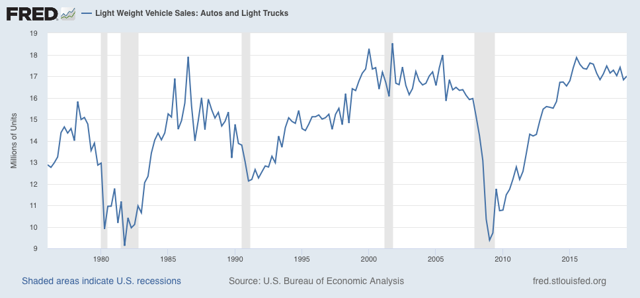
Additionally, durable goods orders and sales, most notably motor vehicles, (as highlighted by the model of Prof. Edward Leamer of UCLA, haven’t declined the 10% or so that they typically have before the onset of recessions:
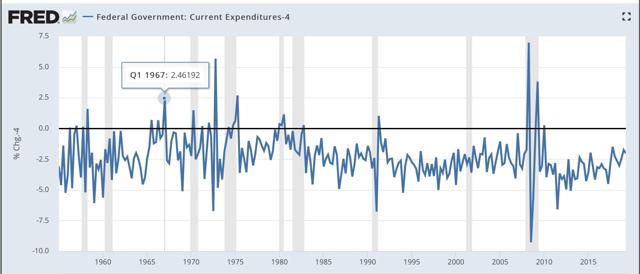
Third, as I pointed out when I went on “recession watch,” the economy is a “second order chaotic system.” That occurs when the thing being observed has the ability to observe right back, and react to your “infallible” forecast. In the case of the economy, that means either fiscal stimulus (LBJ’s 1966 “guns and butter” budget - note that in the graph below I have subtracted 4% so that the actual q/q increases in expenditures during 1966-67 are as much as 6.5% ):
and/or monetary (the 0.75% easing by the Fed at the end of 1966 into early 1967):
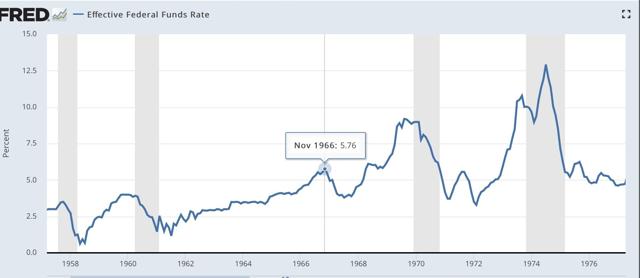
(or the 1% easing in the three months immediately after the implosion of Long Term Capital Management in 1998):
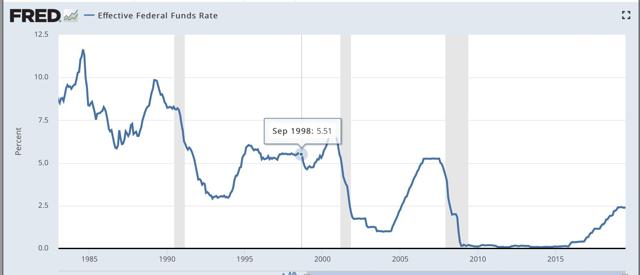
So far, there has been neither (the recent 0.25% drop in the Fed funds rate merely took back the 0.25% *increase* the Fed implemented *after* the mid-portion of the yield curve started to invert last December). But that could still change.
Finally, there are some people already trumpeting the “Trump recession” with not-so-hidden glee. Let me point out that if a recession happens several million of their family, friends, neighbors, and countrymen will be thrown out of work, and in general there will be a lot of suffering. Also, there is a substantial chance no recession happens — in which case Trump can crow about his “economic stewardship” and besting his critics. Is that something his critics really want to chance? If people want to make political hay about a poor economy, personally I would suggest waiting until there is an actual decline in monthly payrolls before declaring it so.
In the meantime, I suggest lots of caution in your reading of recession porn.
Second, the short leading indicators really haven’t confirmed the long leading indicators (of which the yield curve and housing are two) yet. In particular, neither the ISM manufacturing indexes (first two graphs below) nor initial jobless claims (third) have turned negative yet:
Additionally, durable goods orders and sales, most notably motor vehicles, (as highlighted by the model of Prof. Edward Leamer of UCLA, haven’t declined the 10% or so that they typically have before the onset of recessions:
Third, as I pointed out when I went on “recession watch,” the economy is a “second order chaotic system.” That occurs when the thing being observed has the ability to observe right back, and react to your “infallible” forecast. In the case of the economy, that means either fiscal stimulus (LBJ’s 1966 “guns and butter” budget - note that in the graph below I have subtracted 4% so that the actual q/q increases in expenditures during 1966-67 are as much as 6.5% ):
and/or monetary (the 0.75% easing by the Fed at the end of 1966 into early 1967):
(or the 1% easing in the three months immediately after the implosion of Long Term Capital Management in 1998):
So far, there has been neither (the recent 0.25% drop in the Fed funds rate merely took back the 0.25% *increase* the Fed implemented *after* the mid-portion of the yield curve started to invert last December). But that could still change.
Finally, there are some people already trumpeting the “Trump recession” with not-so-hidden glee. Let me point out that if a recession happens several million of their family, friends, neighbors, and countrymen will be thrown out of work, and in general there will be a lot of suffering. Also, there is a substantial chance no recession happens — in which case Trump can crow about his “economic stewardship” and besting his critics. Is that something his critics really want to chance? If people want to make political hay about a poor economy, personally I would suggest waiting until there is an actual decline in monthly payrolls before declaring it so.
In the meantime, I suggest lots of caution in your reading of recession porn.
Tuesday, August 20, 2019
What would need to happen next for a producer-led recession
-by New Deal democrat
If you clicked over and read my last post at Seeking Alpha, I mentioned that I wanted to follow up with examinations of the state of the producer side of the economy, as well as the short leading indicators.
The first half of that is done, and is up at Seeking Alpha. I don’t think all the shoes have dropped, that need to drop if the producer side is going to turn into contraction.
As usual, clicking over and reading drops a coin or two into the till for me.
Monday, August 19, 2019
Why the revised Q2 GDP report next week may be the most important release in 10 years
- by New Deal democrat
Last Thursday there were major backward revisions to unit labor costs. Since corporate profits deflated by unit labor costs are a long leading indicator, this had a big negative effect on the forecast for the next six months or so. Corporate profits for Q2 of this year will be released next week as part of the first revision of the GDP report, and because of the effect on the forecast, might be the most portentous report in 10 years.
This post is up at Seeking Alpha.
As usual, clicking over and reading helps reward me a little bit for my work.
Subscribe to:
Posts (Atom)