Saturday, October 29, 2022

Weekly Indicators for October 24 - 28 at Seeking Alpha


 - by New Deal democrat


My Weekly Indicators Post is up at Seeking Alpha.


Slowly even more indicators are deteriorating in several timeframes.

As usual, clicking over and reading will bring you up to date on the economy, and bring me a little reward for my efforts.

Thursday, October 27, 2022

Q3 GDP: good news for now, bad news for the future


 - by New Deal democrat

I have to keep this note brief, since I am on the road.


As you presumably already know, real GDP was positive for the Third Quarter, up 2.6% at an annual rate:


Subject to revisions in the next several months of course, but for the moment, this puts to rest ideas that the US economy was in a recession earlier this year, since the decline was very shallow and not across all important indicators.

The news on the leading components of GDP was mixed. 

Proprietors’ income, a proxy for corporate profits, which won’t be reported for another month, were up 1.5% (blue in the graph below). The “official” leading metric uses unit labor costs as a deflator, which we also don’t know yet. But if ULC are in line with the past several quarters (red), real proprietors’ income was probably flat:


Finally, real private residential investment, the was housing is included in GDP, took a bad hit:


Housing is just about screaming “incoming recession!” at this point. 

So: good news for the present, bad news for the near future.

While I’m at it, here’s this week’s update on jobless claims:


No big move here. No real deterioration, but no improvement either.

Wednesday, October 26, 2022

The Treasury yield curve has now almost totally inverted


 - by New Deal democrat

One of the few leading indicators not flashing red for recession has been the short end of the Treasury yield curve, which has been relentlessly positive - until now.


While the 10 year minus 2 year Treasury spread has been negative for months, the 10 year minus 3 month had remained positive. But twice in the last two weeks the 3 month Treasury has yielded more than the 10 year Treasury:


The highest yielding Treasury is the 1 year maturity. Further, the 6 month Treasury is now yielding more than the 2 year. In other words, almost the entire Treasury yield curve is now inverted:


The curve remains positive from the Fed funds rate out till 1 year. That’s the only part of the curve that hasn’t inverted yet.

That leaves about the only major indicator that hasn’t rolled over yet is corporate profits, which have been more or less flat, but haven’t really turned down.


Tuesday, October 25, 2022

The tide has now turned as to house prices


 - by New Deal democrat

Last month I wrote that the FHFA showed evidence that house prices had peaked, and that “since the FHFA has a tendency to turn slightly ahead of the Case Shiller index, this strongly suggests that a sharp deceleration in the Case Shiller index YoY will start within a month or two.” 


That was borne out in this morning’s reports for August house prices.

The FHFA purchase only index, which is seasonally adjusted, indicated that house prices declined -0.7% in August, after a -0.6% decline in July, which is a total -1.3% decline from its peak two months ago in June. The index remains higher by 11.9% YoY.

Meanwhile the Case Shiller national index declined -1.1% in August - but is not seasonally adjusted, so the YoY% change is the only good comparison. This was up 13.0%. My rule of thumb for non-seasonally adjusted data is that it has peaked when the YoY% change is less than 1/2 of its maximum. In the case of the Case Shiller index, which peaked at 20.8% YoY in March, this suggests that the index is perhaps one month from peaking. But since we know that the seasonally adjusted FHFA index has peaked, most likely my rule of thumb is off by a couple of months, and the Case Shiller index has peaked as well.

Here is the graph of the YoY trends:


As I have written many times in the past decade, first sales peak, then prices peak with a lag. That is what has happened this year.

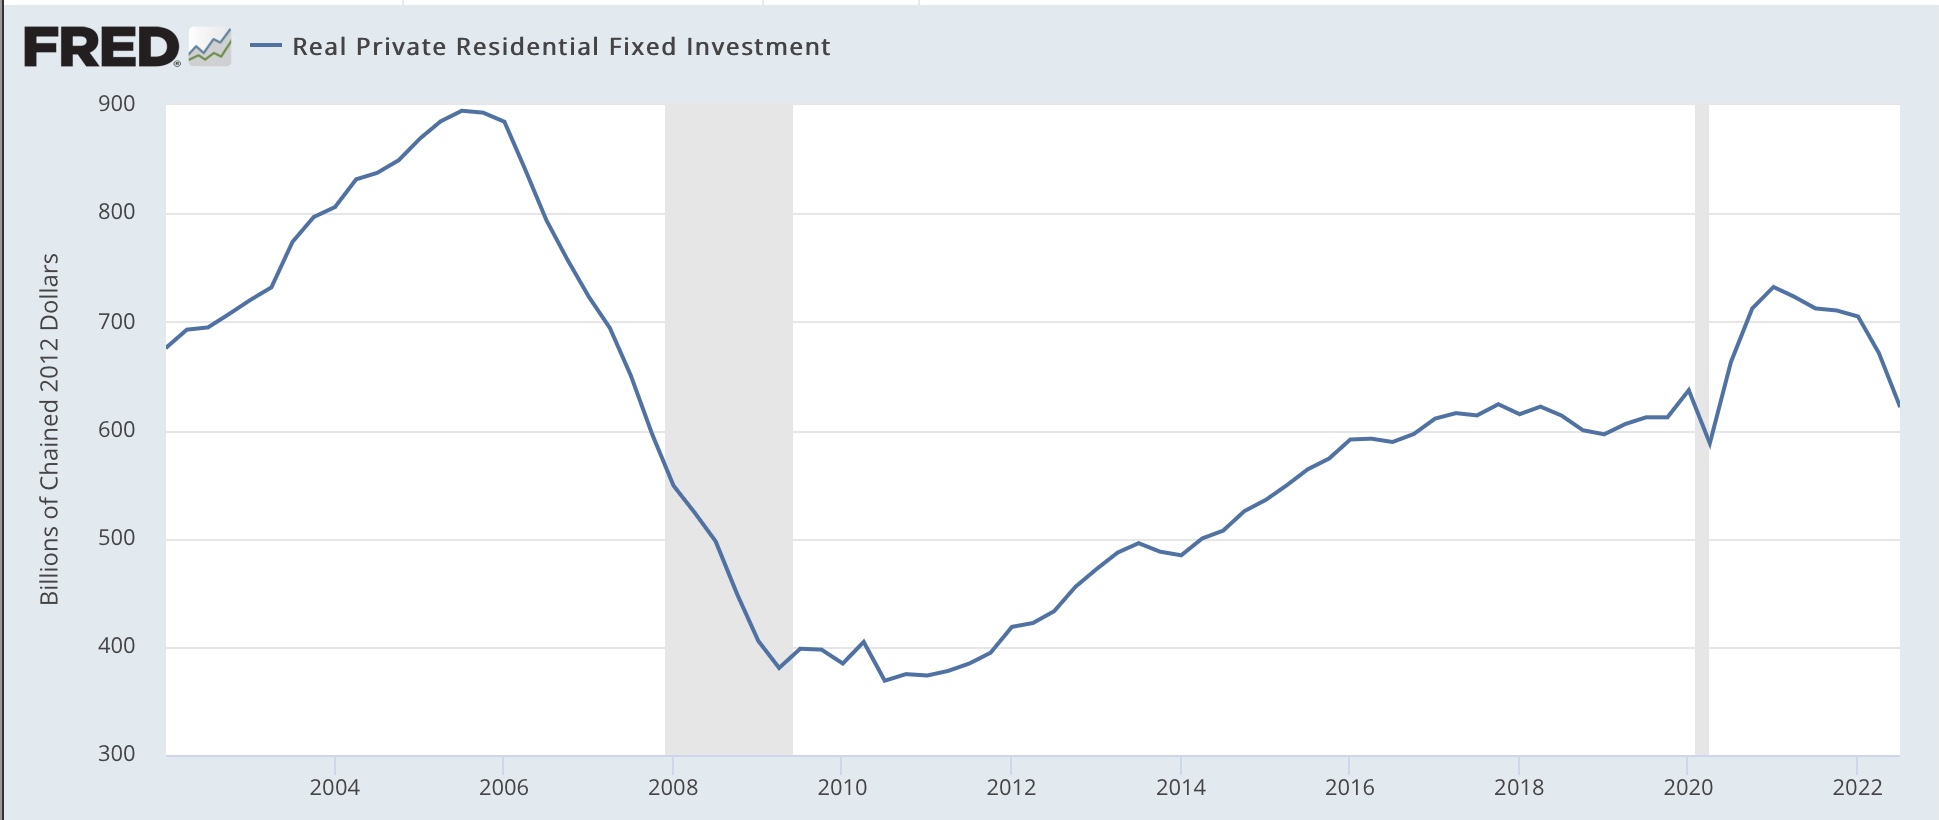
The question now is, how far down do house prices go? In the 2007-11 bust, house prices fell a little over -20%. But in the smaller 1990-91 downturn, prices only declined about -3%. 

The run-up in prices this time has been very similar to that during the 2000’s housing bubble, but lending practices were much less lax - meaning there should be far fewer foreclosures than during the housing bust. Those foreclosures - forced sales - helped drive prices lower, as the markets were flooded involuntarily with houses for sale. This time around, it is more likely that “underwater” homeowners, whose houses are no longer worth what they paid for them, will not suffer foreclosure, but rather will be frozen in place, unable to sell.

I have seen guesstimates of a -5% to -10% decline in house prices in this downturn, and that is a reasonable first dart-throw, although my guesstimate would be at the -10% end of that range. That’s because the Fed seems hell-bent on causing a sharp recession, and that recession will bring lots of joblessness, which in turn will mean more people unable to make mortgage payments, and so suffering foreclosure.

Anyway, the bottom line is that as to house prices, the tide has now turned.

Monday, October 24, 2022

When will housing construction turn down? A fuller consideration


 - by New Deal democrat

No important economic news today. Also I am traveling this week, so there might be some light posting, as in, I might skip a day or two. But I very much want to see what is happening with house prices, which will be updated tomorrow in the FHFA and Case Shiller indexes, and Wednesday as part of the new home sales release.

In the meantime, after I posted about housing permits, starts, and construction last week, I decided to take a closer look at that issue, because I was troubled by the “permitted but not started” statistic, which has continued at near record levels. Housing starts are down just as much as permits. If units not yet started were a supply chain issue, starts should have continued near peak until it was cleared. Obviously they haven’t which suggests there is some other explanation.

Units under construction follow starts almost like clockwork:


In the past, within about 6 months after starts peak, units under construction do as well. We’re now 6 months out past the 3 month average peak (Feb-Apr), and construction has continued to rise. There probably is some supply chain tightness left, because as you can see above, this is the biggest disconnect ever.

But “units permitted but not started” has not historically followed a reliable pattern. Sometimes it peaks simultaneously with starts, sometimes with a considerable delay:


So that suggests something else is going on, and the most likely candidate is cancellations after the permit is issued but before construction begins.

And, helpfully, in small print at the very bottom of the Permits and Starts release there is the following note:

“These data represent the number of housing units authorized in all months up to and including the last day of the reporting period and not started as of that date without regard to the months of original permit issuance. Cancelled, abandoned, expired, and revoked permits are excluded”

And relatedly there’s a similar note in the New Home Sales release:

“If the respondent reports that the unit has been sold, the survey does not follow up in subsequent months to find out if it is still sold or if the sale was cancelled. The house is removed from the "for sale" inventory and counted as sold for that month. If the house it is not yet started or under construction, it will be followed up until completion and then it will be dropped from the survey.

“Since we discontinue asking about the sale of the house after we collect a sale date, we never know if the sales contract is cancelled or if the house is ever resold….

“As a result of our methodology, if conditions are worsening in the marketplace and cancellations are high, sales would be temporarily overestimated.” 


A couple of months ago there were several articles about increasing cancellations; for example, here and here.

And last week, via Rick Palacios Jr., Director of Research at John Burns research consulting, nationwide, the cancellation rate in August jumped to 19%, the highest in years, up from 17.6% in July:


And for September, according to Redfin, they really soared:


So I think we have our answer as to why “units permitted but not started” remains so high. A very high number of people are backing out of deals before construction is started.

But that doesn’t resolve the issue of the delay in the peak in construction, and how quickly - or not - a recession happens afterward. I suspect whether a recession happens sooner vs. later depends upon how much mortgage rates have risen, and how much they continue to rise after the peak in construction. There’s no good way to show this, but here’s the graph anyway:


My suspicion is that units under construction will fall off relatively quickly, because the Fed rate hikes this year have been so abrupt (I won’t show the graph, but in the past week, mortgage rates have risen *even further, to 7.38%! - this is going to absolutely kill housing), and the more they hike from here on in, the quicker the recession will hit.

At this point there are only two classic long leading indicators of recession that haven’t rolled over: the short end of the yield curve between 3 months and 2 years; and corporate profits, which are flat but not declining significantly yet. Everything else in that time frame has been negative for half a year or more already.