Saturday, July 13, 2019
Weekly Indicators for July 8 - 12 at Seeking Alpha
- by New Deal democrat
My Weekly Indicators post is up at Seeking Alpha.
Now that the Fed has all but assured a dovish stance going forward, the longer term forecast has become even more positive.
Friday, July 12, 2019
Real average and aggregate wages improved in June
- by New Deal democrat
Now that we have the June inflation reading, let’s finish out our week focusing on the labor market.
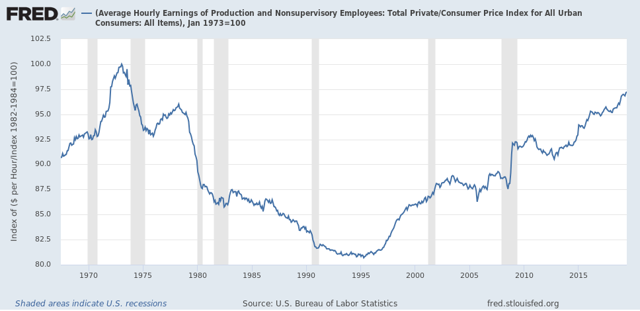
First of all, nominal average hourly wages in June increased +0.2%, while consumer prices increased +0.1%, meaning real average hourly wages for non-managerial personnel increased +0.1%. Together with upward revisions to prior months, this brings real wages up to 97.2% of their all time high in January 1973:
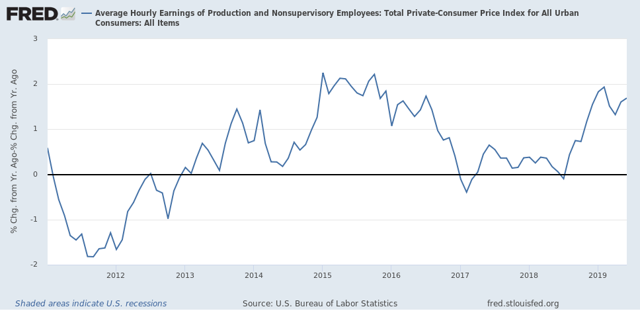
On a YoY basis, real average wages were up +1.6%:
On that score, this morning’s readings include this take by Prof. James Hamilton at Econbrowser indicating that the Phillips curve (the trade-off between inflation and employment) is still alive, together with this guest post by David Branchflower at Talking Points Memo on Jerome Powell’s acknowledgement that the Fed (and many others) failed to appreciate that we were not at full employment in 2016 as they began to raise rates, and stating that the evidence
shows that, now, wage growth is driven not by unemployment but by underemployment, which has still not returned to pre-recession levels. That explains the weak wage growth we see today, and why the U.S. is not yet at full employment.
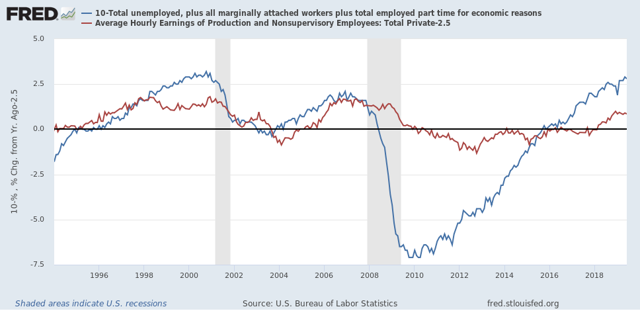
This has been my point of view as well, and it gives me the opportunity to run a graph I haven’t updated in quite awhile - average hourly wages of non-managerial workers (minus 2.5% for easier observation] vs. the U6 underemployment rate [subtracted from 10% so that lower rates show as positives]. This shows that, following recent recessions, underemployment has had to fall below 10% before wage growth stops decelerating:
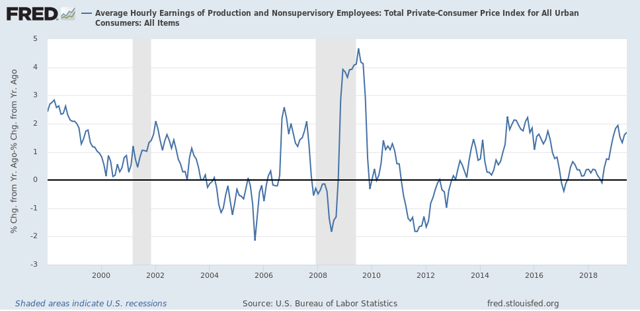
Finally, with the improvement in June, real aggregate wages - the total amount of real pay taken home by the middle and working classes - are up 29.2% from their October 2009 low:
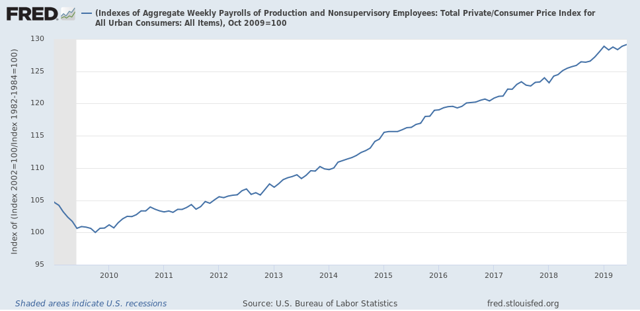
For total wage growth, this expansion is solidly in third place, but behind the 1960s and 1990s, among all post-World War 2 expansions; while the *pace* of wage growth has been the slowest except for the 2000s expansion.
Thursday, July 11, 2019
Initial claims positive to start July, but trend in continuing claims the weakest in 9 years
- by New Deal democrat
I have started to monitor initial jobless claims to see if there are any signs of stress.
My two thresholds are:
1. If the four week average on claims is more than 10% above its expansion low.
2. If the YoY% change in the monthly average turns higher.
Here’s this week’s update.
My two thresholds are:
1. If the four week average on claims is more than 10% above its expansion low.
2. If the YoY% change in the monthly average turns higher.
Here’s this week’s update.
Initial jobless claims last week were 209,000. This is in the lower part of its range for the past 18 months. As of this week, the four week average is 9.2% above its recent low, and at 219,250, is 1,500 lower than this week last year:
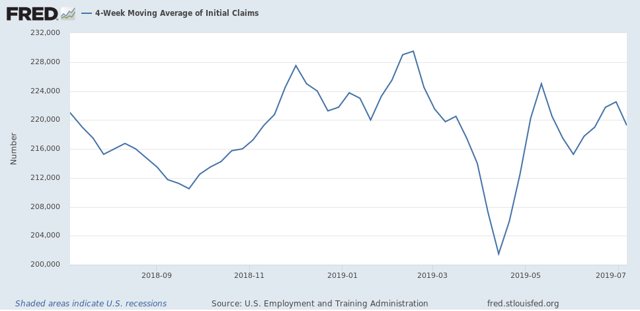
This remains positive.
Last July, initial claims averaged 215,250. Obviously, 209.000 (blue in the graph below) is below that average, which is also positive - but is only the first of the four weeks that will go into that average (red):
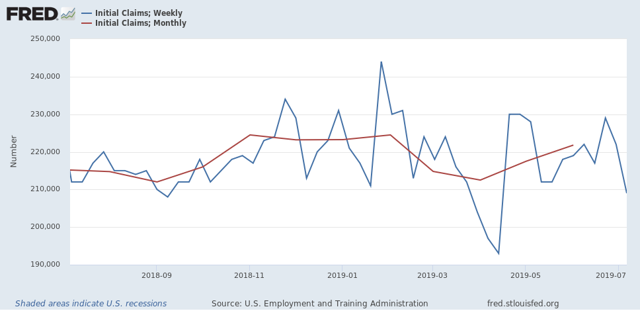
So this too remains positive.
Finally, let’s compare the YoY% change in initial claims (blue) with continuing claims (red):
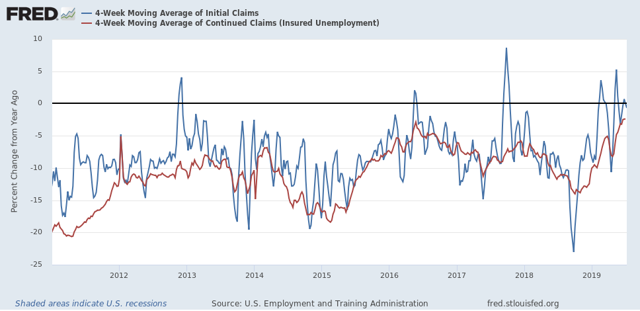
We see that the comparisons are getting closer to crossing the threshold from lower to higher, and that the YoY change in continuing claims in particular is the weakest it has been during this entire expansion - but they haven’t crossed the threshold yet.
Wednesday, July 10, 2019
Using long term unemployment claims as confirmation for initial claims
- by New Deal democrat
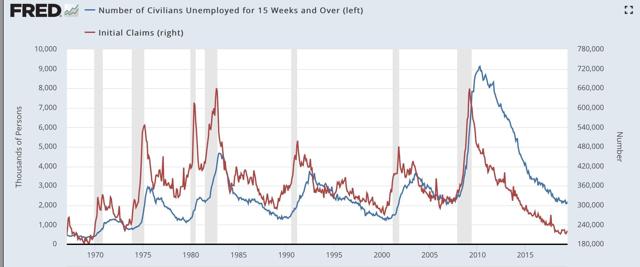
In the last few months, I’ve been paying extra attention to the weekly reports of initial jobless claims. Today I want to compare them to long-term claims (15 weeks or over) for unemployment benefits.
Way back about a decade ago, one of the occasional co-bloggers here was Invictus, who personally knew and subsequently was scooped up by Barry Ritholtz. Well, he still writes, and his Twitter feed is worth checking out.
So anyway, last week he tweeted this:
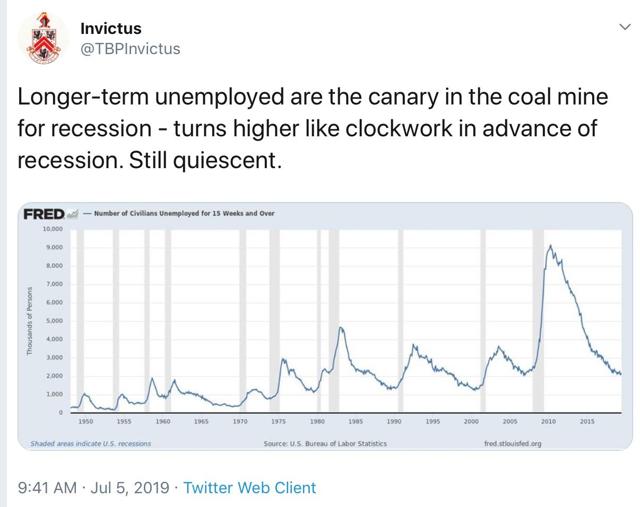
It had been a long time since I checked this series, so I wanted to double-check the claim that it always turned up before a recession. The answer is, usually that has been true, but it made its expansion low in the exact month that a recession started three times (1948, 1953, and 1981), and made its low one month after a recession had already started once (1960).
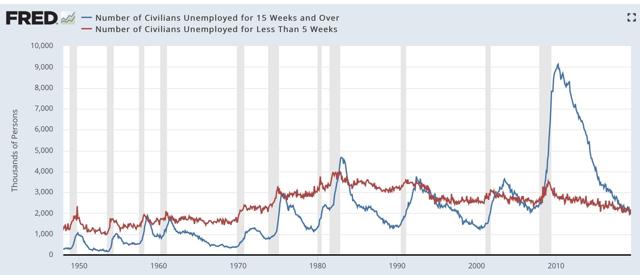
Also, my recollection was that short term unemployment turned up first (0 to 5 weeks), then intermediate term (5 to 14 weeks), before longer term 15+ weeks turned up. That is still correct, but the drawback is that short term claims are much noisier and unreliable compared with long term claims:
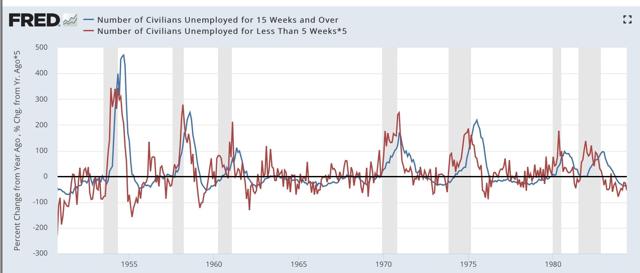
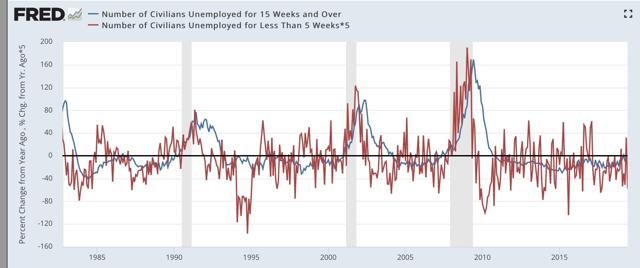
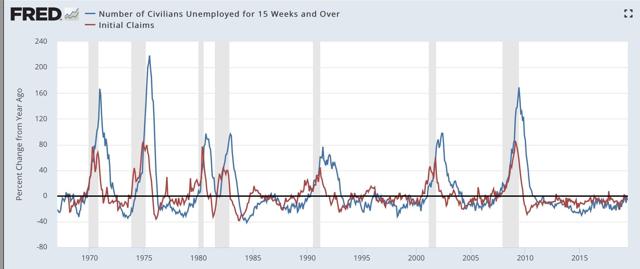
Here is the YoY% change perspective (divided into two time periods), which better shows that short term unemployment leads long term unemployment — but is too noisy to be of much use:
But of course, we don’t have to rely on the monthly unemployment numbers when we have weekly initial claims. As the graph below shows, these *also* lead long term claims, but are much less noisy than the monthly short term unemployment number (note I have averaged initial claims monthly to cut down further on noise in the below two graphs):
The leading/lagging relationship is easy to see when we graph the YoY% change in the two series:
One of the two ways I measure signal in initial claims is if they turn higher YoY on a monthly basis, but there are some false positives. It turns out, when we add long term claims as a confirmatory signal, we only get two false positives, in 1985 and 1996, for only one month each. That’s five accurate signals to two false ones. If we insist on two months in a row, there are no false positives — although as set forth above, there are two false negatives since 1960 in the sense that you don’t get the signal until the month the recession starts or one month later.
Still, using long term unemployment claims as a confirmatory signal looks very useful in terms of adding to the reliability of the forecast. And speaking of initial claims, their monthly average between July and September was between 212,000 and 215,250 - so the likelihood that they will send a negative signal in the next several months looks high.
Tuesday, July 9, 2019
May JOLTS report is weak, consistent with last month’s weak jobs report
- by New Deal democrat
The jobs report one month ago was poor, so as expected the JOLTS report for May, released this morning, followed suit.
To review, because this series is only 20 years old, we only have one full business cycle to compare. During the 2000s expansion:
- Hires peaked first, from December 2004 through September 2005
- Quits peaked next, in September 2005
- Layoffs and Discharges peaked next, from October 2005 through September 2006
- Openings peaked last, in April 2007
as shown in the below graph (normed to 100 as of May 2018):
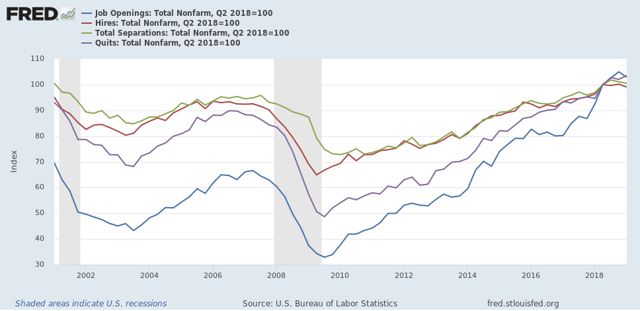
As shown above, in today’s report, all of the above series, as well as job openings, declined month over month. Additionally, the only series that were higher compared with one year ago were job openings (+2.8% but significantly off its November 2018 high) and quits (+2.5%)
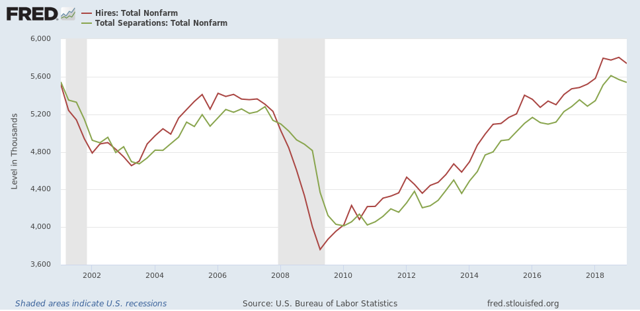
Next, here is the history of the “hiring leads firing” (actually, total separations) metric, measured quarterly to cut down on noise):
And here is the monthly measure for the last five years (plus job openings in blue):
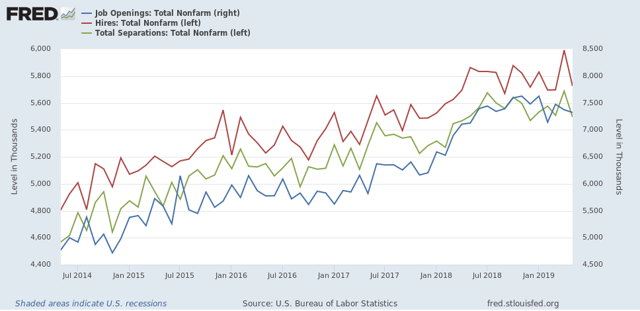
As you can see, both hires and fires have essentially gone sideways for the last twelve months. It is possible both are at a turning point, but it is impossible to know.
Only layoffs and discharges have shown an improving trend over the last year, and ticked lower in May, although they are off their best readings:
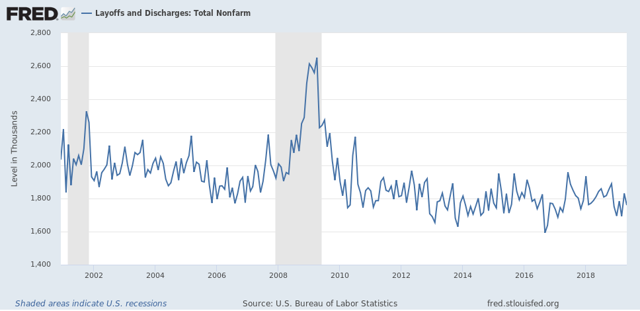
To sum up, job openings have declined about -4% from their peak six months ago. Hires, quits, and total separations have been rangebound, with the only improvement in layoffs and discharges.
While the absolute levels are solid, this month’s report, just like last month’s jobs report, does not show an improving jobs market. But since the June jobs report was strong, we can expect the JOLTS report next month to be stronger as well.
Monday, July 8, 2019
Scenes from the June employment report
- by New Deal democrat
As I (and everyone else) wrote on Friday, the establishment portion of the June jobs report was very good.
On closer examination, though, the leading components of the report continued to show some weakness.
To begin with, for months I’ve been following manufacturing, residential construction, and temporary employment as the leading sectors. As the below graph of the past 18 months shows, all were positive in June:
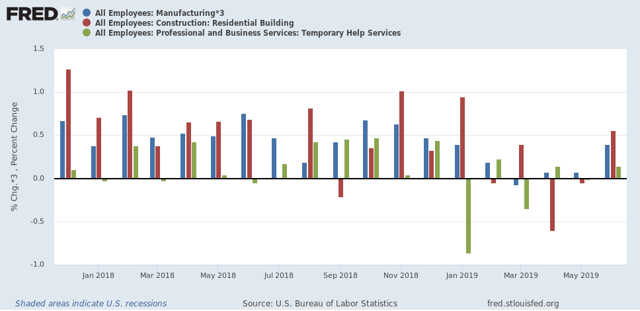
But if you compare each bar (blue, red, green), you see that two of the three sectors nevertheless came in considerably lower for June with the average in that sector from 2018 (17k vs. 21K, 4.6k vs. 4.3k, 4.3k vs. 6k, respectively).
More broadly, jobs in goods producting industries turn down in advance of recessions much more sharply than those in service producing sectors:
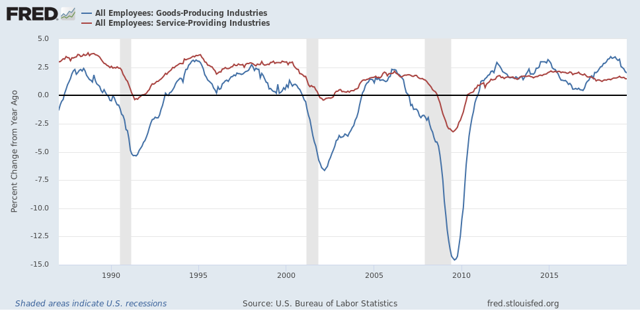
There has been a significant turn-down in goods producing jobs in the past six months, although it is consistent with a slowdown only at this point.
Finally, I’ve been watching initial jobless claims as a leader for the unemployment rate. Here’s what that update looks like through June (note jobless claims are averaged monthly):
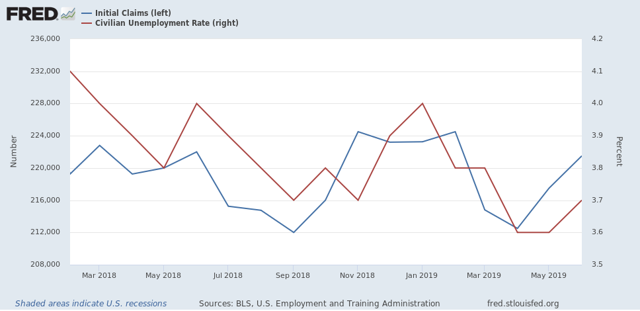
Initial jobless claims have trended essentially sideways, averaging between 212,000 and 225,000 over the past 17 months. Meanwhile the unemployment rate has trended slightly downward. If initial claims continue to trend sideways, I expect the unemployment rate to stagnate as well. Note also that initial claims will have very difficult YoY comparisons for the next four months. If they trend higher YoY, that is a cautionary signal consistent with a possible recession shortly thereafter.
Subscribe to:
Posts (Atom)