Friday, August 18, 2023

The importance of 10 (and 20) year new highs in interest rates


 - by New Deal democrat

As you may have already read elsewhere, interest rates on the 10 year US Treasury just made a new 10+ year high. Perhaps more importantly, 30 year mortgage rates made a new 20+ year high:


Both rates are slightly above their previous highs from last October:


Almost always in the past, interest rates peaked *before* the Fed finished hiking interest rates. Which suggests that the Fed is likely to make at least one more rate hike. Typically, these rates have also peaked *before* a recession ever hit. In fact, their failure to make new highs for 4 months has typically been the first long-term event enabling a recovery after that recession. So the new highs in interest rates “re-set the clock” in terms of how far off in the distance a post-recession recovery might take place.

Secondly, as I wrote Monday, the “Big Story” of why it actually *is* different this time is the 10% decline in commodity prices occurring while the economy is still expanding. This has enabled, for example, home builders to lower the price of their new homes to offset the effects of Fed rate hikes.

So far this decline in commodity prices has been more important than interest rate increases. But once these declines are done, they’re done. In contrast, Fed rate hikes will affect future activity 1 and 2 years later. A contract for a new house that isn’t signed today will affect housing under construction a year from now, and the purchase of furnishings and landscaping items 2 years from now.

I expect housing’s recent recovery to reverse, probably to a level roughly equivalent to its lows 6 and 9 months ago. Will producers of consumer goods be able to lower their prices (even further in the case of home builders) to compensate for the increase in interest rates? We’ll soon see.

Thursday, August 17, 2023

Initial claims travelin’ man edition: still below cautionary levels


 - by New Deal democrat

Initial claims were 250,000 last week. The 4 week average increased to 234,250. Continuing claims with a one week delay were 1.716 million.


Most importantly, YoY the4 week moving average is up 9.5%:


This is well below the 12.5% YoY increase necessary to trigger a new caution.

Industrial production improves, with help from vehicle production: travelin’ man edition


 - by New Deal democrat

Industrial production increased 1.0% in July. Its manufacturing component increased 0.5%. Total production is still down -0.6% from its peak last autumn, while manufacturing is down -01.%:


These are not recessionary numbers. 

It’s worth emphasizing that the unspooling of pandemic related bottlenecks is significantly affecting these numbers. Below I show total manufacturing (black), manufacturing except for motor vehicles (blue), and vehicle manufacturing (red), all normed to 100 as of just before the pandemic:


Production of motor vehicles and parts is up about 10% this year. Were it not for that, manufacturing production would be down further.

Also, here is production of wood products, which has been tracking housing construction, and like construction has also had a little bit of a rebound this year:


This by the way shows an important difference between this metric and the ISM manufacturing index and Fed new orders indexes. The former is weighted by contribution, whereas the latter are diffusion indexes. The two types of indexes are telling us that while the bulk of manufacturing is down significantly, the ramping up of vehicle production is counterbalancing that.

Wednesday, August 16, 2023

In housing construction, the last domino still refuses to fall: Travelin’ Man edition


 - by New Deal democrat

[First, a blogging note: I will be traveling for the next week and a half. I’ll keep posting the data, but the posts are likely to be brief, and may be a day late. On days when there is no data, I will probably not post at all.]


When it comes to housing construction, I’ve been waiting for the last domino to fall. Once again in July, it didn’t.

Total housing starts rose 3.9%, but are -19% below their peak. Permits rose 0.1%, but are 22% below their peak. Units under construction, which is the “real” economic activity, rose 0.4% and is slightly, as in -2.7%, off its peak:


Single family permits are the most leading and least noisy data point. They were essentially flat, and both starts and permits are off about -25% from their respective peaks. Single family units under construction declined all of 5,000, and are -18.4% below their peak:


With the huge increase in the prices of houses after the pandemic, action shifted to multi-family units. Permits and starts for these were virtually unchanged last month. While permits are down -33% and starts are down -25% from their respective peaks, multi-family units under construction made yet another new all-time high:


The pace of construction for these multi-family units has barely slowed down at all:


Historically you have needed about a -10% decline in housing under construction before a recession actually began. Once again in July, the final domino - multi-family units under construction - did not fall. I suspect no recession will begun until it does.


Tuesday, August 15, 2023

July retail sales: gas and vehicle sales continue to dominate the trend


 - by New Deal democrat

As always, real retail sales tell us a great deal about what is happening in the consumer economy. July continued the recent trend since gas prices started declining over a year ago.


Nominally retail sales increased 0.7%. Since consumer prices increased 0.2%, real retail sales increased 0.5%. Here they are compared with real personal expenditures on goods since just before the pandemic:


Unsurprisingly, in the past year real retail sales have followed the trajectory of gas prices, declining in the second half of 2022 before increasing again in 2023.

Excluding gas sales, real retail sales have been almost relentlessly flat for the past 2 years:


Also, because there is potent evidence that motor vehicle sales have improved sharply since supply chain bottlenecks started to unspool last year, below I show total retail sales (blue) compared with retail sales for motor vehicles and parts (red), and retail sales excluding motor vehicles (black). Also shown are the number of cars and light truck sold (gold):


Clearly the improved sales of cars and light trucks are helping buoy retail sales.

To put it simply: the improvement in retail sales this year is coming from vehicle and gas sales, while consumers appear to be cutting back slightly on other purchases of goods.

Finally, because real retail sales /2 (blue below) are a short leading indicator for employment, here is the updated YoY graph comparing them as well as YoY real personal consumption of goods /2 (red) and YoY payrolls (black):


This relationship continues to forecast continued deceleration in jobs numbers in the months ahead, although not an outright decline at this point. In other words, basically more of the same.

Monday, August 14, 2023

This is the Big Story: a 100+ year near-record decline in commodity prices is enabling continued record wage growth and employment


 - by New Deal democrat

No important economic data today, so let me elaborate on the matter of “immaculate disinflation,” i.e., the decline in inflation without a decline in growth. I’m going to argue that, to the extent there is causation, it is the reverse of what is generally assumed, to wit: that there is decent growth without any meaningful hit to employment, which somehow is occurring while inflation is declining.


To the contrary, it is precisely *because* inflation is declining under the present set of circumstances that we are continuing to get good growth in employment and overall consumption.

Let me start by running a long term version of a graph I have highlighted many times over the years, average hourly wages YoY (red) vs. CPI (blue) and also CPI ex-fictitious shelter (blue green):


Going back 60 years, whenever wage growth exceeds inflation (the red line is higher than the blue or blue green lines), you are either in an economic expansion, or the end stages of a recession setting the stage for the next expansion. Consumers have an increasing amount of money to spend, and they are spending it.

Note the converse isn’t always true. Particularly from about 1970 to 1995, there were times when average wages weren’t keeping up with inflation but we were nevertheless in expansion. This is because that was the era of women entering the workforce by the millions. This operated to tamp down average wages. BUT, median household income grew. If that statistic were updated monthly or even quarterly, that’s what we would want to use. Unfortunately, it is only updated annually, so it’s realistically not available.

But do note that approaching recessions (with the exception of the pandemic), average wages either dip below inflation, or at least the gap is almost entirely closed. 

Currently average hourly wages are growing at a rate of 4.8% YoY, while headline inflation is up 3.2% and CPI ex-fictitious shelter is up only 1.0%. Consumers have more money to spend, and they are spending it.

But to look for why consumer inflation has become so tame, let’s look at commodity prices for producers.

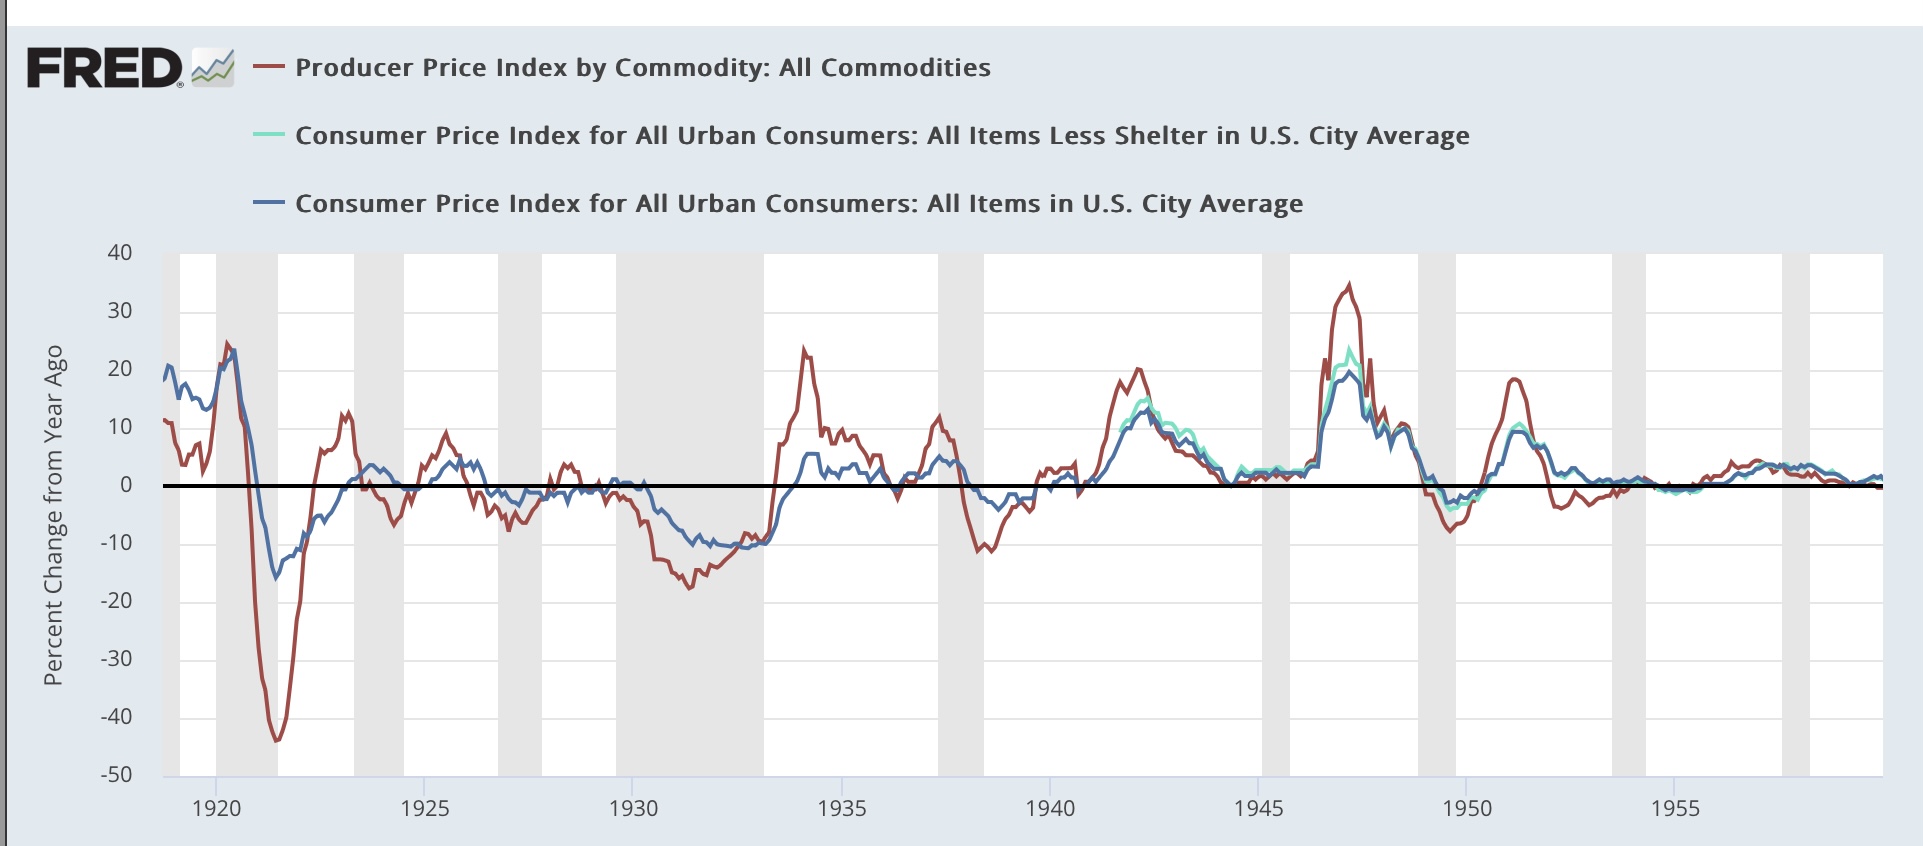
Here are two graphs of commodity prices (red) vs. headline consumer inflation and inflation ex-shelter going back 110 years:


At the far right of the second graph, you can see that producer prices were down close to -10% YoY one month ago. If you go back over the entire 110 year period, declines that steep only happened once in the past 70 years (at the end of the Great Recession). Before that, declines of -10% or more only happened late in or at the end of the recessions of 1920, 1938, and over -5% near or at the end of two recessions in the 1920s, and the 1950 recession. Recently declines nearly that steep happened at the end of the 2001 recession, during the 2015 “shallow industrial recession,” and the pandemic lockdowns.

It’s no coincidence that those steep declines are at or near the end of those recessions. Those big declines in costs to producers enabled them to cut sales prices to consumers (note that consumer inflation is also declining at those times), which made it earlier for consumers to buy those goods. And a new expansion began!

In fact, the disparity between producer commodity costs now and consumer inflation (shown in the graph below) is close to its most extreme in that entire 110 year period, as consumer prices YoY are running more than 10% above producer commodity prices). Only at the end of the Great Recession and the end of WW1 was the disparity so huge):


This huge decline in producer prices in the past year has enabled them to hire more workers at substantially higher wages and yet still pocket increased $$$, especially if they have market power and are able to maintain their recent price hikes.

As shown in the graphs above, typically sharp declines in producer prices occur because of demand destruction during recessions. But this time around, prices have declined because of the unspooling of pandemic-caused restrictions and bottlenecks. Because commodity prices are set globally, there may also be an element of a slowdown in Chinese manufacturing to the story as well, but for purposes of any impact on the domestic US economy, this is irrelevant.

This is the Big Story. This is why there hasn’t been any recession - at least not yet -despite huge Fed rate hikes. This is why I am temporarily paying much more attention to producer prices than I normally do. It’s also why I am looking for signs of that downdraft (hello, $3.80 gas prices again) ending.