Saturday, October 8, 2022

Weekly Indicators for October 3 - 7 at Seeking Alpha


 - by New Deal democrat

My Weekly Indicators post is up at Seeking Alpha.

This week’s headline was easy, because OPEC’s (and in particular Russia and Saudi Arabia’s) geopolitical decision - aimed directly at the November elections in the US as well as Western support for Ukraine -  to cut back production has already caused gas and oil prices to increase sharply.

As usual, clicking over and reading will bring you up to the virtual moment on the economy, and bring me  a little pocket change to reward me for my efforts.

Friday, October 7, 2022

September jobs report: a very positive report within a framework of continued deceleration


 - by New Deal democrat

As I have written many, many times, consumption leads employment; and the near stagnation in real sales and spending signaled that we should expect weaker monthly employment reports, with both fewer new jobs and a higher unemployment rate. In September, the former happened; the latter did not.

The three month average in employment gains since February has continued to decelerate from over 500,000 to 372,000. But this month the unemployment rate declined back to its post-pandemic low.

Here’s my in depth synopsis.

HEADLINES:
  • 263,000 jobs added. Private sector jobs increased 288,000. Government jobs decreased by -25,000. 
  • The alternate, and more volatile measure in the household report indicated a  gain of 204,000 jobs. The above household number factors into the unemployment and underemployment rates below.
  • U3 unemployment rate declined 0.2% to 3.5%.
  • U6 underemployment rate declined 0.3% to 6.7%.
  • Those not in the labor force at all, but who want a job now, increased 285,000 to 5.834 million, compared with 4.996 million in February 2020.
  • Those on temporary layoff declined -24,000 to 758,000.
  • Permanent job losers declined -173,000 to 1,181,000.
  • July was revised upward by -105,000, and July was unchanged, for a net increase of 11,000 jobs compared with previous reports.
Leading employment indicators of a slowdown or recession

These are leading sectors for the economy overall, and will help us gauge whether the strong rebound from the pandemic will continue.  These were all positive:
  • the average manufacturing workweek, one of the 10 components of the Index of Leading Indicators, increased +0.1 hour to 41.1 hours.
  • Manufacturing jobs increased 22,000, and are at a level higher than before the pandemic.
  • Construction jobs increased 19,000, also at a level higher than before the pandemic. 
  • Residential construction jobs, which are even more leading, rose by 2,300.
  • Temporary jobs rose by 27,200. Since the beginning of the pandemic, roughly 300,000 such jobs have been gained.
  • the number of people unemployed for 5 weeks or less declined by -69,000 to 2,154,000, about equal to its pre-pandemic level.

Wages of non-managerial workers
  • Average Hourly Earnings for Production and Nonsupervisory Personnel rose $0.10 to $27.77, which is a 5.8% YoY gain, a further decline of -0.3% from last month and its 6.7% peak at the beginning of this year.

Aggregate hours and wages:
  • the index of aggregate hours worked for non-managerial workers increased 0.5% which is above its level just before the pandemic.
  •  the index of aggregate payrolls for non-managerial workers rose by 0.9%, a very strong increase compared with the last several months’ outright declines in prices.

Other significant data:
  • Leisure and hospitality jobs, which were the most hard-hit during the pandemic, rose 83,000, but are still about -6.7% below their pre-pandemic peak.
  • Within the leisure and hospitality sector, food and drink establishments added 60,700 jobs, but are still about 560,000, or -4.5% below their pre-pandemic peak. 
  • Professional and business employment increased by 46,000, over 1,000,000 above its pre-pandemic peak.
  • Full time jobs increased 326,000 in the household report.
  • Part time jobs declined -7,000 in the household report.
  • The number of job holders who were part time for economic reasons declined -312,000 to 3,763,000.
  • The Labor Force Participation Rate declined -0.1% to 62.3%, vs. 63.4% in February 2020.

SUMMARY

This was a very good report with just a few blemishes. On the plus side, the entire slew of leading indicators in the report advanced. Total payroll gains were very strong. The unemployment and underemployment rates both declined. Part time employment was more than replaced by strong full time employment. The rebound in leisure and hospitality employment continued. Wage increases moderated YoY, but on a monthly basis advanced well.

The few weak points included the decline in the labor force participation rate, which is why the unemployment and underemployment rates declined as they did. The gains in professional and business employment were weak.

In summary, we have a very positive report, completely inconsistent with any idea that we are currently already in a recession, but within the larger framework of an economy which is decelerating.

Thursday, October 6, 2022

Signs and portents of an employment slowdown and a near-term recession


 - by New Deal democrat

I continue to believe that a recession - possibly a deep if relatively brief one - is likely to start early next year. As I’ve mentioned before, this isn’t just an academic exercise; recessions by definition feature jobs and income losses, which is my primary interest.


With that introduction, let’s look at one overall metric, and several which will be updated tomorrow as part of the September jobs report.

First of all, if there were such a thing (ex- pandemic lockdowns) as a one quarter recession, courtesy of last week’s income revisions we almost certainly had one during Q2. Here’s a graph of most of the metrics relied upon by the NBER in dating recessions, plus several variations. Note that almost all of them went down during the April-June period - and I haven’t even included GDP:


The only recession-related metrics that improved during Q2 were nonfarm payrolls and the mining and utilities portions of industrial production. Manufacturing production, income ex-government transfers, real retail sales, real manufacturing and trade sales, as well as real GDP, all declined during the second quarter. In the first two months of Q3, all of them improved from their June levels, and I expect that to continue in September.

Next, as I have said many times, consumption leads employment. Here’s the YoY% look at real retail sales (blue), real personal spending (black), vs. nonfarm payrolls (red). Because spending is more variable than jobs, note that both sales and spending metrics are reduced for scale:


As I wrote the other day, real sales are flat YoY. Real spending is up less than 1% YoY. As a result, we should expect gains in nonfarm payrolls to decelerate to virtually nothing in the coming months.

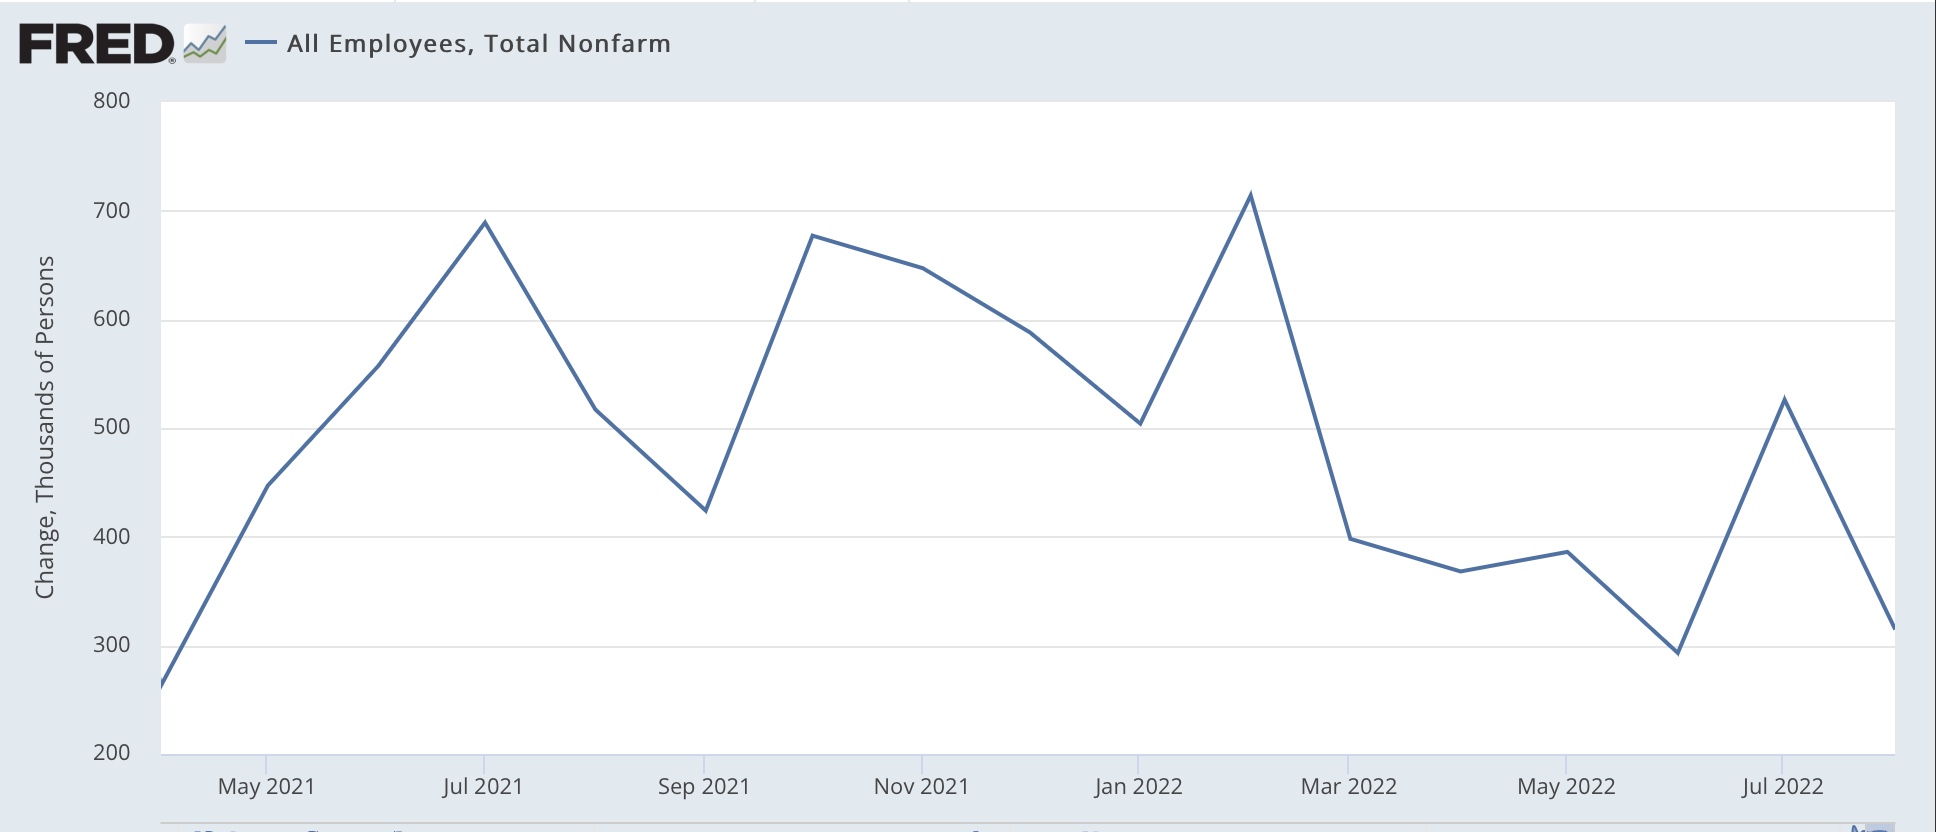
Here’s a more granular look a the month over month change in each for the past 15 months:


Note the outright slight decline in sales since February, and the sharp deceleration in spending. Job gains have been slowly decelerating since, and because consumption leads employment, we should expect that to continue. While any month can be an outlier, the likelihood is that tomorrow’s report will show gains of less than 300,000 jobs for the month of September.

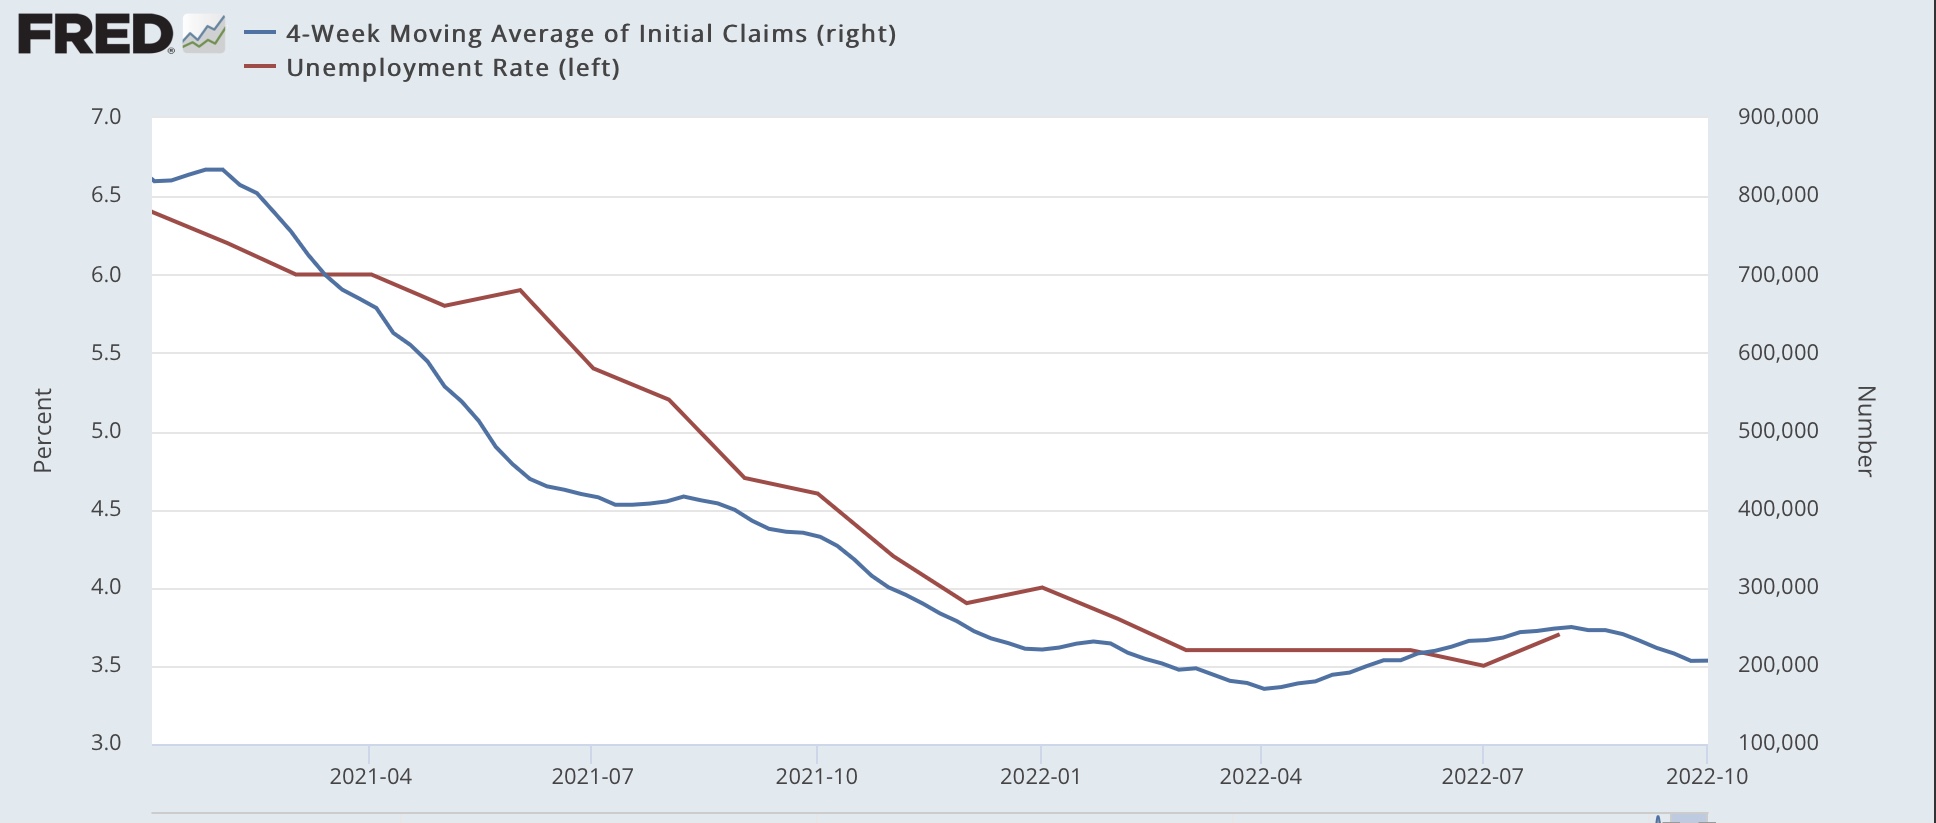
Next, initial jobless claims lead the unemployment rate. Here’s a graph of the 4 week average of new jobless claims through this morning’s report (right scale), compared with the unemployment rate (left):


Last month the unemployment rate rose from its expansion low of 3.5% to 3.7%. While again any given month might be an outlier, I expect the unemployment rate to remain above 3.6% going forward in the next few months.

Finally, as I wrote last month, real aggregate payrolls of non-supervisory workers have an excellent record as a coincident to shortly leading indicator of recessions. Previously I showed YoY changes. Here are the quarter/quarter % changes for the past 60 years:


Occasionally there will be a single negative q/q change during slowdowns. The first negative q/q change has tended to happen 0-2 quarters before the onset of recessions during that period.

Now here is the close-up since the beginning of 2021, shown both quarterly through Q2 (blue) and monthly through August (red):


We’ve had two positive months so far in Q3. Tomorrow’s report, once adjusted for inflation, will complete the picture. Needless to say, a positive number will be good and a negative one bad.

Watching for a continued slowdown in jobs created, a continued slight elevation in unemployment over the bottom, the change in aggregate payrolls, plus whether wage gains for non-supervisory workers moderate, is my primary focus in tomorrow’s jobs report. Especially with OPEC having now joined the Fed in apparently trying to deliberately cause a recession.
 

Jobless claims rise; the gas price low is probably in


 - by New Deal democrat

Initial jobless claims may have ended their recent downtrend.

Initial claims rose 19,000 to 219,000 from last week’s 5 month low. The 4 week average rose 250 from its 4 month low to 206,500. Continuing claims, which lag somewhat, increased 15,000 to 1,361,000:


The downtrend of the past 2 months was almost certainly a positive side-effect of lower gas prices. But in the past 2.5 weeks, according to GasBuddy, gas prices have risen over $.20/gallon. With OPEC deliberately cutting back production in order to cause a shortage in Europe and the US this winter (to aid Russia), it is very likely that gas prices will continue to rise again. If so, I expect jobless claims to rise again as well.

In the meantime, I have more I want to say about the economy in advance of tomorrow’s job report, which I’ll post later this morning.


Wednesday, October 5, 2022

Coronavirus dashboard for October 5: an autumn lull as COVID-19 evolves towards seasonal endemicity


 - by New Deal democrat

Back in August I highlighted some epidemiological work by Trevor Bedford about what endemic COVID is likely to look like, based on the rate of mutations and the period of time that previous infection makes a recovered person resistant to re-infection. Here’s his graph:


He indicated that it “illustrate[s] a scenario where we end up in a regime of year-round variant-driven circulation with more circulation in the winter than summer, but not flu-like winter seasons and summer troughs.”

In other words, we could expect higher caseloads during regular seasonal waves, but unlike influenza, the virus would never entirely recede into the background during the “off” seasons.

That is what we are seeing so far this autumn.

Confirmed cases have continued to decline, presently just under 45,000/day, a little under 1/3rd of their recent summer peak in mid-June. Deaths have been hovering between 400 and 450/day, about in the middle of their 350-550 range since the beginning of this past spring:


The longer-term graph of each since the beginning of the pandemic shows that, at their present level cases are at their lowest point since summer 2020, with the exception of a brief period during September 2020, the May-July lull in 2021, and the springtime lull this year. Deaths since spring remain lower than at any point except the May-July lull of 2021:


Because so many cases are asymptomatic, or people confirm their cases via home testing but do not get confirmation by “official” tests, we know that the confirmed cases indicated above are lower than the “real” number. For that, here is the long-term look from Biobot, which measures COVID concentrations in wastewater:


The likelihood is that there are about 200,000 “actual” new cases each day at present. But even so, this level is below any time since Delta first hit in summer 2021, with the exception of last autumn and this spring’s lulls.

Hospitalizations show a similar pattern. They are currently down 50% since their summer peak, at about 25,000/day:


This is also below any point in the pandemic except for briefly during September 2020, the May-July 2021 low, and this past spring’s lull.

The CDC’s most recent update of variants shows that BA.5 is still dominant, causing about 81% of cases, while more recent offshoots of BA.2, BA.4, and BA.5 are causing the rest. BA’s share is down from 89% in late August:


But this does not mean that the other variants are surging, because cases have declined from roughly 90,000 to 45,000 during that time. Here’s how the math works out:

89% of 90k=80k (remaining variants cause 10k cases)
81% of 45k=36k (remaining variants cause 9k cases)

The batch of new variants have been dubbed the “Pentagon” by epidmiologist JP Weiland, and have caused a sharp increase in cases in several countries in Europe and elsewhere. Here’s what she thinks that means for the US:


But even she is not sure that any wave generated by the new variants will exceed summer’s BA.5 peak, let alone approach last winter’s horrible wave:


In summary, we have having an autumn lull as predicted by the seasonal model. There will probably be a winter wave, but the size of that wave is completely unknown, primarily due to the fact that probably 90%+ of the population has been vaccinated and/or previously infected, giving rise to at least some level of resistance - a disease on its way to seasonal endemicity.

Tuesday, October 4, 2022

August JOLTS report: the game of reverse musical chairs in the jobs market is ending


 - by New Deal democrat

Since early this year I’ve been making the point that, because of the pandemic, there have been several million fewer persons looking for work, leaving a huge number of unfilled job vacancies, particularly in the face of a roughly 10% higher jump in demand. This has given employees the upper hand, as there are almost always higher paying jobs on offer for which they can apply. I‘ve also posited that the dynamic would only slow down once some employers throw in the towel, and the number of job openings signficantly declines. I’ve called this “reverse musical chairs.”

This morning we got some very potent news that the game is entering its closing phases, at least for this cycle. 

Almost certainly openings peaked in March. In August alone, openings declined -10% to 10.053 million, for a total - and accelerating - decline of 1.8 million, or over -15% since the peak:


At their average rate since March, openings will return to their pre-pandemic level by next April. At the rate they’ve declined in August, they’ll be at that level by November.

Meanwhile actual hires, as shown in the above graph, increased slightly m/m, but the decelerating trend since the beginning of this year is clear. This is simply more confirmation that consumption leads employment, and we should expect monthly jobs numbers to decelerate further, and go to virtually zero m/m by early next year.

Voluntary quits, which are an important measure of employee confidence in finding another job, increased 2.5% for the month, but again the overall declining trend since last autumn is clear:


The story is the same for total separations. There was a 3.1% increase for the month, but a clear decelerating trend since the end of last year.


Finally, layoffs and discharges increased 5.0% for the month, to their highest level since March 2021:


The game of reverse musical chairs is slowing down. It is most likely within months of ending. 

Because consumer spending as measured by real retail sales has been flat for over a year, and real personal consumption expenditures are up only 0.7% in the past 10 months, monthly jobs gains in the coming months are going to slow down or even stop. Here’s the graph of monthly jobs gains for the past 2+ years:


While any month’s number will be variable, in general this Friday I would expect a gain of less than 400,000 for September, and most likely below 300,000 - possibly below 200,000. We’ll see then.


Monday, October 3, 2022

September manufacturing new orders and August construction spending both turn down


 - by New Deal democrat

As usual, we begin another month and another quarter with important manufacturing and construction data.


The ISM manufacturing index has a very long and reliable history. Going back almost 75 years, the new orders index has always fallen below 50 within 6 months before a recession, and in three cases did not actually cross the line until the first month of the recession itself - although the recession did not begin until after the total index fell below 50, and in fact usually below 48.

In September the overall index declined to 50.9 - just slightly expansionary - and new orders declined to a new post-pandemic lockdown low of 47.1:


This is consistent with readings right before the onset of the Great Recession, but also with several slowdowns that did not quite turn into recessions.

Construction spending, both in total and residential, declined nominally for the seond and third month in a row, respectively:


Again, this is consistent with a recession, but also a slowdown as in 2018.

Adjusting for inflation using the construction materials special index, total construction spending is down about -17%, and residential construction spending down -8% from their respective peaks at the end of 2020:


Note the more leading residential measure has been flat for nearly a year. 

Because construction spending is the “real” economic activity, as is the metric of “housing units under construction” from last week’s permits and starts release, below is a comparison of the two measures measured YoY:


I mentioned last week that housing units under construction looked like it was peaking right now. Since construction spending seems to be coincident with or slightly leading units under construction, this is more evidence that the real economic activity in the leading housing market is at or just past peak. In other words, maybe not in Q3, but from here on in we should expect housing to subtract from real GDP.