Saturday, December 11, 2021

Weekly Indicators for December 6 - 10 at Seeking Alpha


 - by New Deal democrat

My Weekly Indicators post is up at Seeking Alpha.

While stock prices made a new record yesterday, the more significant change this week was that Omicron most likely has already put a dent in peoples’ dining plans, as restaurant reservations declined significantly.

Also, the weekly measure of consumer spending continues to be strong, even though real wages have declined in recent months.

As usual, clicking over and reading will bring you up to the virtual moment as to the state of the economy, and will bring me my lunch money for the coming week.

Friday, December 10, 2021

Real average and aggregate wages continue decline in November; a sharp deceleration in the consumer sector now appears likely


 - by New Deal democrat

As you may already know, consumer prices increased 0.8% in November. In the past two months, there has been a re-acceleration in CPI, with the monthly numbers equal to earlier this year and the worst since the Great Recession: 


On a YoY basis, consumer inflation is now the highest since the big Reagan recession of 1981-82. My favorite measure, CPI ex energy, is also up 5.1% YoY, the worst in 30 years:


Inflation has shown up in all the wrong places: houses, cars, and gasoline. And remember that house prices are only indirectly reflected via owners’ equivalent rent, which has also started to increase:


Aside from the fact that “real” wage income has indeed actually declined this year (as I’ll discuss immediately below), the impact of house prices on consumers’ inflation concerns is an important factor that among others even Paul Krugman is missing (because he’s looking at only the “official” CPI stats, which do not include house prices).

Average real hourly wages also declined again, down another -0.3% at -1.6% below their recent peak last December and about 3% below their peak in spring 2020:


Further, real aggregate payrolls, an overall measure of consumer health, also declined -0.1%, and are -0.2% below their peak in September:


This is significant, because for the past 50+ years, when aggregate real wages have retreated from peak for 3 to 9 months, a recession has typically followed:


Measured quarterly, a -0.3% decline in real aggregate wages from the previous quarter has more often than not signaled a recession, and even when a recession has been avoided (e.g., 1967 and 1995) GDP growth has typically slowed dramatically (note: graph ends with September data):


Last month I wrote that inflation was “a Big Deal,” because it showed that consumers were already under pressure, and because, via owners’ equivalent rent, we could expect higher inflation to continue next year. Today’s report only reinforced that concern. While we haven’t crossed a threshold at this point into a downturn consistent with a recession, we certainly are at a point where a sharp deceleration beginning with the consumer sector of the economy is more likely than not.

Thursday, December 9, 2021

The Great Resignation and jobless claims


 - by New Deal democrat

Initial and continuing jobless claims continue at or near their best levels in the past half-century.

Initial claims declined 43,000 to 184,000, a new 50 year low, while the 4 week average declined 21,250 to 218,750, also a new pandemic low, and in the past 50 years only bettered by the period from late 2018 until February 2020:


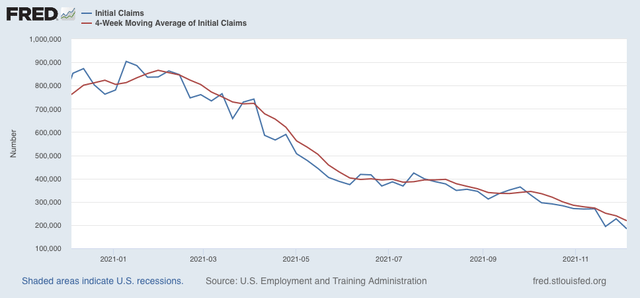
For all intents and purposes, nobody is getting laid off.

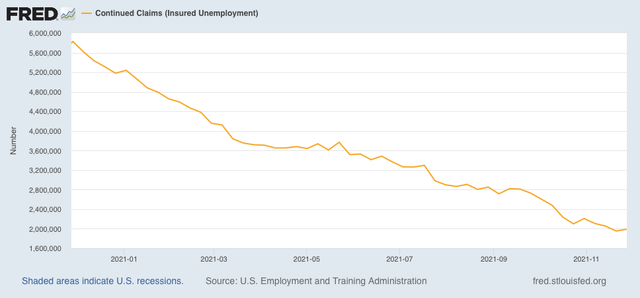
Continuing claims rose 38,000 to 1,992,000 from last week’s pandemic low:


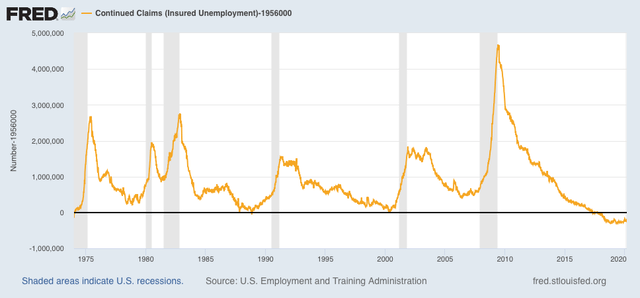
Still, since 1974, aside from last week, only two weeks in the late 1980s, and the last 3 years of the last expansion were below this number:


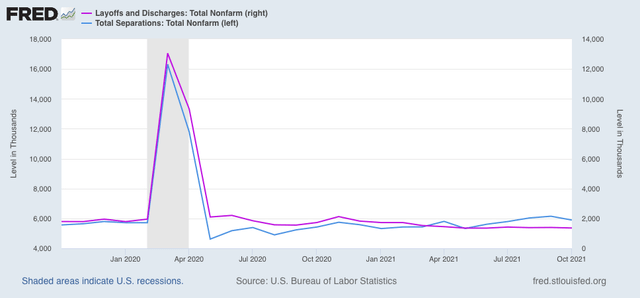
This is further confirmation of what was reported yesterday in the JOLTS report for October, where layoffs and discharges were a hair above their all time low set in May.

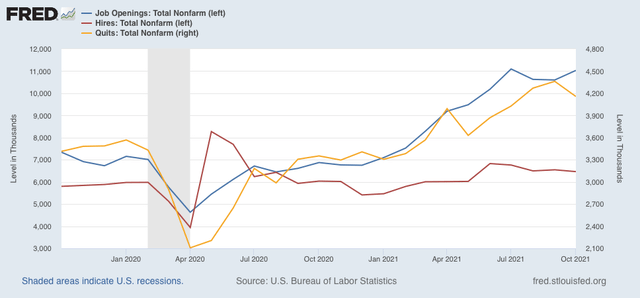
Below is a comparison of total jobs from the monthly jobs report, vs. job openings from the JOLTS report, both set to 0 as of February 2020 just before the pandemic:


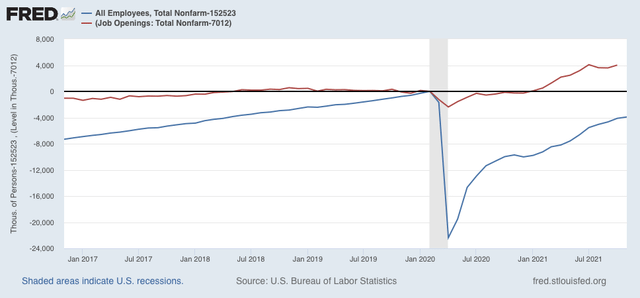
Note that since autumn one year ago, the two have been running in parallel, with job openings roughly 8,000 to 10,000 above the level of workers compared with just before the pandemic.

Adding in real retail sales (black in the graph below) helps put the two series in perspective:


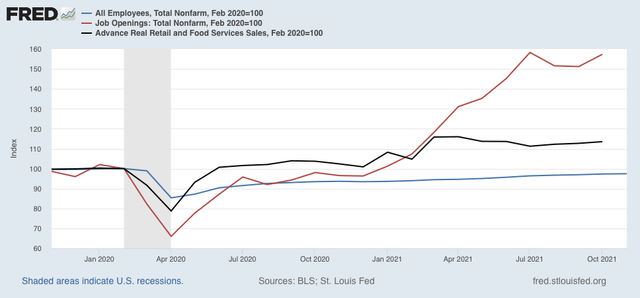
Before the pandemic hit, job openings were running at approximately 7 million a month. They returned to that level by January of this year, and have since increased to about 11 million per month.

Similarly, real retail sales returned to their pre-pandemic level in June of 2020, and began taking off from that level in January of this year.

In other words, we have had a persistent situation going back at least 12 months where the level of sales in the economy justified a level of employment in the aggregate equal to that just before the pandemic hit, but there was a huge shortfall in the number of employees actually hired to perform that work.

The imbalance really took off with the arrival of vaccines at the beginning of this year, together with further Congressional stimulus.

Right now we still have roughly a 4 million shortfall in employees compared with just before the pandemic, and about 4 million new job openings over and above that which existed just before the pandemic. Over and above that, sales are running over 10% higher than they were just before the pandemic.

Most importantly, it is the pandemic dangers themselves, and their secondary effects, which are responsible for this shortfall. Jobs which require face to face interactions with unvaccinated Covidiots are going to go unfilled unless there is a very big $$$ premium to undertake that risk. The shortage or unavailability of child care for other potential workers is keeping them from the workplace. 

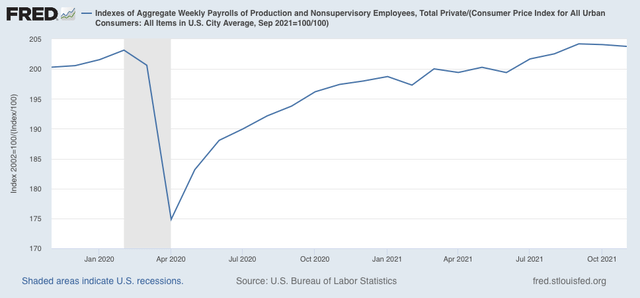
The shortfall in available workers has, unsurprisingly, led to a competition for workers, which means wages are going up sharply, as the employer paying the least is having their jobs unfilled.

Take care of the pandemic, and the shortfall in jobs, both in payrolls and in openings, will be resolved. Until then, it will persist.

Wednesday, December 8, 2021

October JOLTS report: at least the jobs market isn’t getting any worse in disequilibrium


 - by New Deal democrat

The JOLTS report for October was released this morning. While it did not indicate any significant progress towards a new labor equilibrium, at least the trends did not get any more destabilized.


Job openings (blue in the graph below) increased to 11.033 million, which remains below the July peak of 11.098 million. Voluntary quits (the “great resignation,” gold, right scale) decreased to 4.157 million, a decline of over 200,000 from last month’s peak. Actual hires (red) decreased slightly to 6.464 million, in line with the past few months, and better than the early part of this year:


Layoffs and discharges (violet, right scale in the graph below) decreased to 1.361 million, slightly above the May all-time low of 1.353 million. Total separations (blue) decreased to 5.892 million, a three-month low:


So, we have near-record (but not record) job openings, layoffs, and quits, with still-strong hiring and a normal level of total separations.

The situation is not getting any more out of sync, but on the other hand progress towards a new equilibrium has been very limited, to say the least.

So, what am I looking for going forward? The JOLTS data has only been around for 20 years, and neither jobs recovery after the two last recessions were very strong. In other words, we are in terra incognito for this series.

In order for the situation to resolve, the first thing I want or expect to see is a further increase in monthly hiring. At the same time, or shortly thereafter, I would expect to see a significant decline in voluntary quits. Only after these two things have occurred would I expect to see a substantial downturn in job openings, and I would not expect to see any significant increase in layoffs until all of those other trends are in place.

Tuesday, December 7, 2021

Coronavirus dashboard for December 7: since further mass vaccination could only happen at gunpoint, the Biden Administration had better come up with a ‘Plan B’


 - by New Deal democrat

No significant economic news today, so let’s catch up a little bit with Covid.


There are still distortions in the 7 day average data, as States did data dumps of deaths and new cases throughout last week, after not reporting over the long Thanksgiving holiday. That should finally disappear over the next few days.

But since the same sort of Thanksgiving distortions occurred one year ago, it’s useful to take a YoY look at the data, which the below graph shows by US Census Region plus nationwide:


The South and West regions have less than half as many cases as they did one year ago right after the Thanksgiving weekend, while the Northeast and Midwest have between 80% to 90% of the case they did one year ago.  This is particularly interesting since the South, of all the regions, has the lowest vaccination rate. It partially suggests the importance of weather, and partially recent outbreaks rushing through the susceptible part of the population.

A close-up of the last 8 weeks shows that the waves in the Northeast and Midwest started building near the end of October. Since the Delta wave from trough to peak in the South and West took about 2 months (similar to what happened in India, the UK, and now in the EU), this may mean that, except for the effect of Christmas gatherings, the peak in the colder regions is only a few weeks away:


Additionally, if we average the most recent 7 day average, with the 7 day average one week ago, and compare that with the 7 day average 14 days ago, we probably get closer to a true picture of the pandemic. And there, the news is better. In the South, West, and even the Midwest, the average of the past 2 weeks is about the same as the 7 day average 2 weeks ago. Only in the Northeast has there been an unambiguous increase.

But now, some pessimistic news.

Vaccinations among adults have slowed to a crawl.

Here is the graph of full vaccinations per capita for the entire US population:


40% of the entire US population was fully vaccinated on May 16.
50% was fully vaccinated on July 22.
60% was fully vaccinated on December 4.

It took 67 days to go from 40% to 50%.
It took another 135 days to go from 50% to 60%.

Even worse, some of those new vaccinations were for teens and a few for children under age 12.

When we confine the data to only US adults, here’s what we get (note: no graph; data is from my “Weekly Indicators” compilations from the last 6 months):

50% of all US adults were fully vaccinated by May 30.
60% were fully vaccinated by July 30.
Two more months later, by October 1, only 66.6% were fully vaccinated.
70% of all US adults were finally fully vaccinated by December 3.

In other words, the pace of vaccinations fell by 50% between late spring and the onset of winter - despite the Delta wave occurring in late summer.

At the current pace of the slowdown, it would take another 8 months to go from 70% to 80% of all adults, and to go from 60% to 70% of the entire US population. And because we are running up against the hard core refusers, we may *never* get there.

Needless to say, this takes the prospect of beating Covid via vaccination alone in the US completely off the table.

And, as far as I can tell, the Biden Administration has no other plan. It has refused to enact mandatory vaccination requirements for air and train travel. Yesterday Jen Psaki actually sneered at the idea of mailing test kits to everybody (which has in fact been done both in the UK and Singapore). Rapid testing at pharmacies for free - available in many other Western countries - is a figment of the imagination here. Seroprevalence studies appear to have been largely suspended. Even the publication of infection statistics by vaccination vs. non-vaccination status by the CDC has never been implemented.

Since mass vaccination of the remaining US population could only happen essentially at gunpoint, the Biden Administration had better come up with a decent “Plan B” and fast.