Saturday, December 7, 2019

Live-blogging the Fifteenth Amendment: December 7, 1868


 - by New Deal democrat

In the Senate: 

“Mr. Craving asked, and by unanimous consent obtained, leave to introduce a joint resolution proposing an amendment to the Constitution of the United States: . . .

“No State shall deny the right of suffrage or abridge the same to any male citizens of the United States twenty-one years of age or upwards except for participation in rebellion or other crime and also excepting Indians not taxed; but any State may exact of such citizen a specific term of residence as a condition of voting therein, the condition being the same for all classes.”
. . . .   

“Mr. Pomeroy asked and by unanimous consent obtained, leave to introduce a joint resolution proposing an amendment to the Constitution of the United States: . . . 

“The basis of suffrage in the United States shall be that of citizenship, and all native or naturalized citizens shall enjoy the same rights and privileges of the elective franchise; but each State shall determine by law the age of the citizen and the time of residence required for the exercise of the right of suffrage, which shall apply equally to all citizens, and also shall make all laws concerning the time, places, and manner of holding elections.”
——

In the House of Representatives:

“Mr. Kelley introduced a joint resolution proposing an amendment to the Constitution of the United States . . .

“No State shall deny to or exclude from the exercise of any of the rights or privileges of an elector any citizen of the United States by reason of race or color.”
. . . . 

“Mr. Broomall introduced a joint resolution proposing an amendment to the Constitution of the United States . . .

“Neither Congress nor any State by its constitution or laws shall deny or restrict the right of suffrage to citizens of the United States on account of race or parentage of such citizens; and all qualifications or limitations of the right of suffrage in the constitution or laws of any State based upon race or parentage, are, and are hereby, declared to be, void.”
. . . . 

“Mr. Stokes introduced a joint resolution proposing an amendment to the Constitution of the United States . . .
 
“No State shall make or enforce any law which shall deprive any citizen of the right of the elective franchise on account of race or color.”

[Source: Congressional Globe, 40th Congress, 3rd Session, pp. 6, 9, 11.] 
  
In view of the gutting of portions of the Voting Rights Act in the Shelby County case, and the subsequent passage of numerous voter suppression laws, and also the ongoing crisis of extreme gerrymandering, for several years I have wanted to write a series examining those issues from the viewpoint of the Congress that passed the Fifteenth Amendment 150+1 years ago. Finding the debates in the record of Congress proved diabolically hard, which is why I didn’t undertake this task one year ago. Recently the index in Prof. Eric Foner’s book “The Second Founding,” which discussed the post-Civil War Amendments in great detail, proved very helpful in locating many (although not all!) of those debates in the record.

So - no promises, because this involves reading about 1000 pages of tiny script in the Congressional Globe (the forerunner to the Congressional Record)! - I hope to follow this post up with day-by-day highlights of that debate, on the dates the statements were made, many of which clearly set forth the Congressional intent, and anticipated many of the issues we face now, 150 years later.

Notice the difference between the two Senate proposals and the three House proposals. The Senate proposals would codify a broad right to vote, and allow certain exceptions or qualifications to that right. The House proposals, on the other hand, narrowly prohibit racial discrimination in the right to vote, while being silent on other qualifications and notably not conferring a Constitutional “right to vote.” 

Of course, we know which version ultimately was enacted. The reasons why will become apparent as we watch the debates progress.
Weekly Indicators for December 2 - 6 at Seeking Alpha


 - by New Deal democrat

My Weekly Indicators post is up at Seeking Alpha.

After a spell where all of the time frames were positive, there is a little darkening in the long and short term forecasts.

As usual, clicking over and reading helps reward me with a penny or two for my efforts it bringing you up to the moment information.

Friday, December 6, 2019

November jobs report: an excellent report for ordinary working households that takes recession off the table for now


 - by New Deal democrat

HEADLINES
  • +266,000 jobs added
  • U3 unemployment rate down -0.1% from 3.6% to 3.5%
  • U6 underemployment rate down -0.1% from 7.0% to 6.9%
Leading employment indicators of a slowdown or recession

I am highlighting these because many leading indicators overall have strongly suggested that an employment slowdown is here. The following more leading numbers in the report tell us about where the economy is likely to be a few months from now. These were positive:
  • the average manufacturing workweek rose 0.1 hour  from 40.4 hours to 40.5 hours. This is one of the 10 components of the LEI and is positive.
  • Manufacturing jobs rose by 54,000 (but would have risen by 13,000 were it not for workers returning from the GM strike). YoY manufacturing is up 76,000, a sharp deceleration from 2018’s pace.
  • construction jobs rose by 1,000. YoY construction jobs are up 146,000, also a deceleration from summer 2018. Residential construction jobs, which are even more leading, rose by 1800.
  • temporary jobs rose by 4800. 
  • the number of people unemployed for 5 weeks or less increased by 52,000 from 1,968,000 to 2,020,000.

Wages and participation rates

Here are the headlines on wages and the broader measures of underemployment:
  • Not in Labor Force, but Want a Job Now: increased by 78,000 from 4.753 million to 4.831 million 
  • Part time for economic reasons: decreased by -16,000 from 4.438 million to 4.322 million 
  • Employment/population ratio ages 25-54: unchanged at 80.3%
  • Average Hourly Earnings for Production and Nonsupervisory Personnel: rose $.07 to $23.84, up +3.7% YoY. Last month was revised higher with a YoY rate of +3.8% a new expansion high. (Note: you may be reading different information about wages elsewhere. They are citing average wages for all private workers. I use wages for nonsupervisory personnel, to come closer to the situation for ordinary workers.)  

Holding Trump accountable on manufacturing and mining jobs

 Trump specifically campaigned on bringing back manufacturing and mining jobs.  Is he keeping this promise?  
  • Manufacturing jobs rose an average of +6,300/month in the past year vs. the last seven years of Obama's presidency in which an average of +10,300 manufacturing jobs were added each month.   
  • Coal mining jobs increased by 300, an average of 100 jobs/month in the past year vs. the last seven years of Obama's presidency in which an average of -300 jobs were lost each month
September was revised upward by 13,000. October was also revised upward by 28,000, for a net change of 41,000.

Other important coincident indicators help  us paint a more complete picture of the present:
  • Overtime declined -0.1 hour from 3.2  hours to 3.1 hours
  • Professional and business employment (generally higher-paying jobs) rose by 38,000 and  is up +417,000 YoY. 
  • the index of aggregate hours worked for non-managerial workers rose by 0.2%
  •  the index of aggregate payrolls for non-managerial workers rose by 0.5%  
Other news included:            
  • the alternate jobs number contained  in the more volatile household survey rose by 83,000  jobs.  This represents an increase of 1,790 000 jobs YoY vs. 2,204,000 in the establishment survey. 
  • Government jobs rose by 12,000.
  • the overall employment to population ratio for all ages 16 and up was unchanged at 61.0% and is up 0.4% YoY.    
  • The labor force participation rate declined -0.1% from 63.3% to 63.2% and is up 0.3% YoY.

SUMMARY

Obviously this was an excellent report, which it has to be said was completely at odds with the manufacturing and consumption data that has been reported in the past month.

There were very few weak spots: short term unemployment rose slightly, as did those not even in the labor force who nonetheless want a job, and overtime.

Everything else was positive to strongly positive. Aside from the headline employment number, the standout was non-supervisory wages, which rose 3.7% in November after a revised 3.8% YoY rate in October, a new expansion high. Almost all of the leading indicators in employment were also positive. In particular temporary jobs, completely contradicting private data, have risen strongly in 3 of the past 4 months. Involuntary part time employment also fell to a new expansion low. Aggregate hours and payrolls also rose strongly. Revisions were positive.

Bottom line: this report completely takes recession out of the picture for the next several months, and was good news for ordinary working households.

Thursday, December 5, 2019

Initial jobless claims still a positive; what I’ll be watching for tomorrow


 - by New Deal democrat

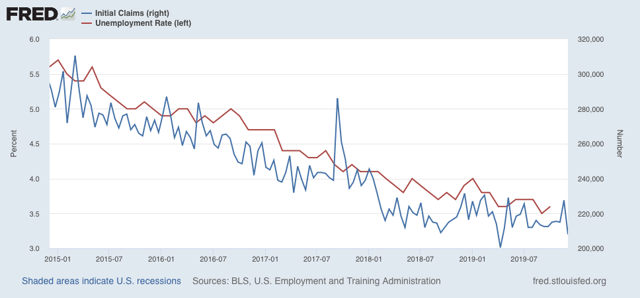
As I’ve said a number of times over the past few months, the lack of an increase in initial jobless claims is the best argument against any oncoming recession. If businesses aren’t laying employees off, those same people are consumers who are going to continue to spend, which is 70% of the total economy.

This morning’s initial jobless claims report continues the streak. At 203,000, it is the lowest since April. Averaging it with last week, due to the change in Thanksgiving this year gives us 215,000 for the two weeks - right in line with the average for over the past year.

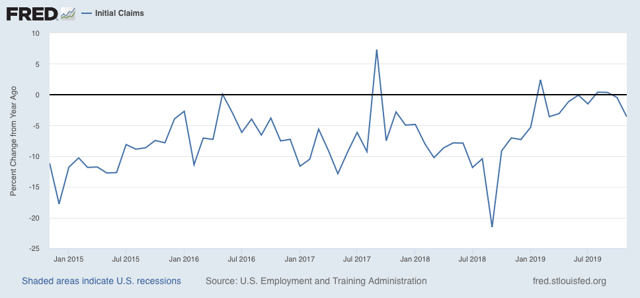
The four week moving average is 217,750, only 7.9% higher than April’s low of 201,500 - and below my 10% threshold for concern. The monthly average for November was 216,400, which is -3.7% below last November’s, also a positive:


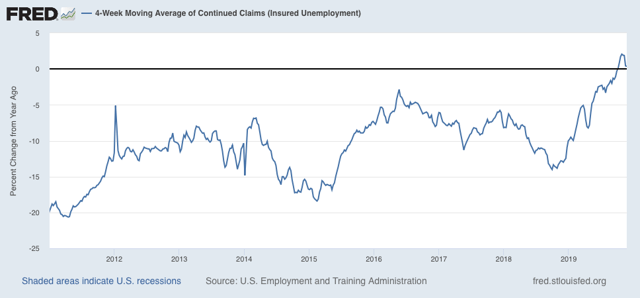
Even the less leading but less volatile 4 week average of continuing claims is only +0.4% higher than one year ago, well below my +5% YoY threshold for concern:

Since initial claims leads the unemployment rate, my anticipation is that tomorrow’s jobs report will see unemployment remain at 3.6% +/-0.1%:


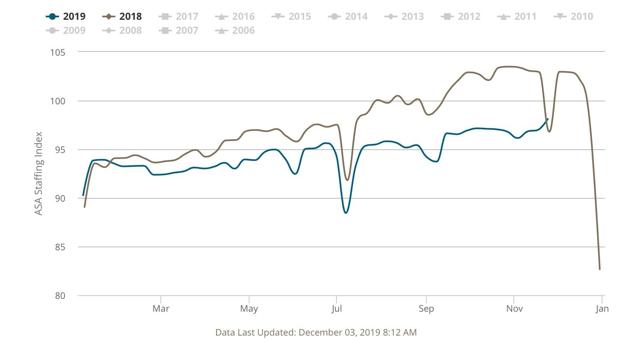
Tomorrow I will also again be particularly interested in manufacturing, residential construction, and temporary employment, the markers for all of which indicated contraction in the past month. Here is the update on temporary jobs from the American Staffing Association:


The pattern has been that the initial estimate for all has been positive, with substantial downward revisions in both temporary jobs and manufacturing. So I will be paying extra attention to the revisions in these, and to the goods producing sector in general, tomorrow.

Wednesday, December 4, 2019

November vehicle sales: the consumer is alright, producers not contracting


 - by New Deal democrat

Vehicle sales are a significant short leading indicator. They tend to react after housing, but before broader consumer sales. Although domestic vehicle manufacturers are now reporting only quarterly rather than monthly, this metric is still an important one to watch.

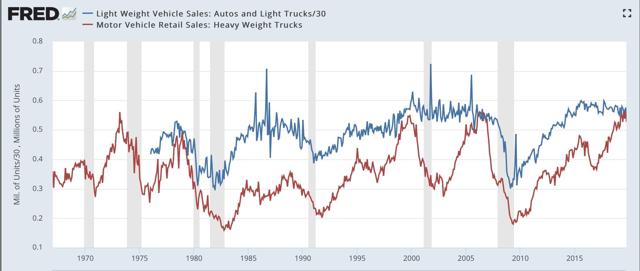
Yesterday car and light truck sales were reported at 17.09 million units annualized for November (blue in the graphs below). Heavy trucks were reported at .561 million annualized (red):


Note that heavy truck sales are a much clearer indicator, declining typically by about -20% a number of months before the onset of a recession (with 1969 being the exception). Car sales typically have declined by more than -10% on a three month rolling average, and it is much more difficult to distill signal from noise.

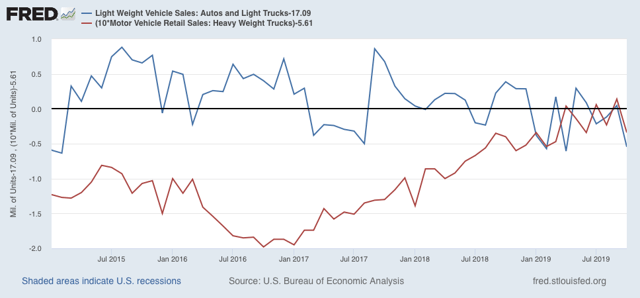
With that in mind, here is the last five years, including the 2015 peak for car sales. Since FRED carries the data with a one month delay, I have subtracted the November reading from each, so that the respective November numbers if shown would be zero:


While heavy truck sales have turned flattish this year, November is still extremely close to the peak readings. Car sales averaged for the past three months are only a little more than -5% off peak.

As I’ve been saying a lot recently, the consumer is still alright. Meanwhile businesses may not be expanding, but they’re not meaningfully contracting either.

Tuesday, December 3, 2019

Forecasting the 2020 election: the economic baseline (or, don’t count on a recession)


 - by New Deal democrat

Four years ago, I decided to use my set of “long leading indicators” to forecast the 2016 election. The indicators were very weakly positive, and pointed to a narrow popular vote win for the incumbent party one year out. This prompted Nate Silver to huff and puff that nobody knew anything about what the economy would look like so far off. One year later, the economy was very weak, the downward move in the unemployment rate had stalled, and the incumbent won the popular vote narrowly (but obviously not the Electoral College vote).  

Well, the 2020 election is 11 months away. So it’s time to do the impossible again.

As I wrote four years ago, going back 160 years, roughly 3/4 of all US Presidential election results have correlated positively with whether or not at the time of the election campaign, the US was in a recession or not. More than 2/3 of the time, it accurately predicted the Electoral College winner, and 80% of the time, it accurately showed the winner of the populat vote.  In fact, if we simply go by the metric of whether or not the US was in recession during the 3rd Quarter of the election year, then 84% of the time the winner of the popular vote was from the incumbent party if the economy was expanding, and from the opposition party if the economy was in recession. (The list of all of the elections, the economic status, and the victor in each election, is available at the link above).

In only 3 of the 11 cases where there has been a recession in the 3rd or 4th Quarter of the election year has the incumbent party been successful maintaining control of the White House. Contrarily, of the 29 times the economy has been expanding during the 3rd and 4th Quarter of an election year, the incumbent party has retained control of the White House nearly 3/4 of the time. If we go by popular vote rather than electoral college result, that average increases to over 80% (Both the 2000 and 2016 elections fall into this category, where there was no recession, the incumbent party won the popular vote, but the electoral college resulted in the opposition candidate being declared the winner). 

So, with the election one year off, let’s take a look at “Will there be a recession on  Election Day? The simple answer is, left to its own devices, almost certainly not.

Several months ago, analyzing the long leading indicators, I wrote that economic conditions would start to improve by about midyear 2020. Although there has been some deterioration in several long leading metrics since then, that result has remained the same. Below I go through all of the same indicators (7 in all) and their status now. Remember that they suggest how the economy will be 12+ months out.

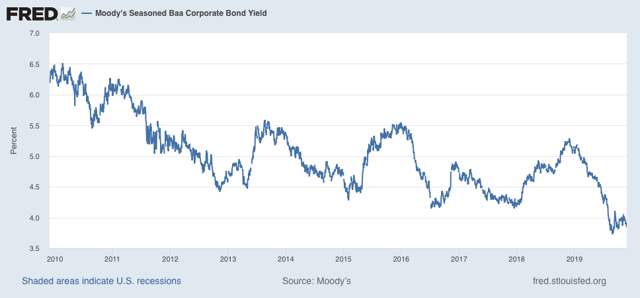
1. Corporate bond yields fell to new expansion lows a few months ago:


This is a positive.

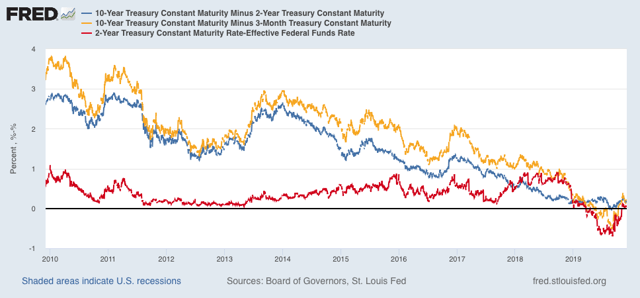
2. The yield curve has in-inverted. When  a recession has begun after an un-inversion, it has been within the next eight months (for our purposes, by the end of Q2 next year). Further, the Two year minus Fed funds metric never inverted enough to be consistent with a recession: 


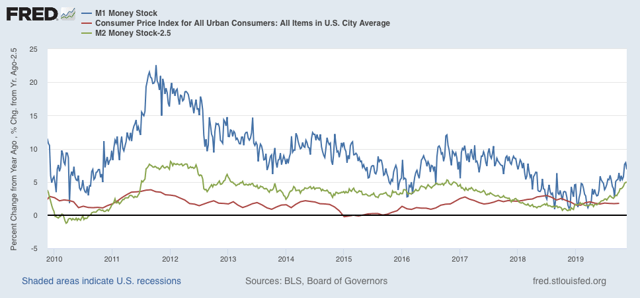
3.  Real money supply has turned back to very positive:


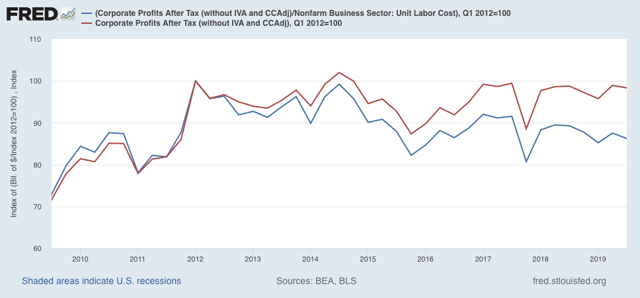
4.  Corporate profits adjusted by unit labor costs give a mixed result. Both are lower then their peak, from way back in 2012. But only one version has declined enough to be consistent with an oncoming recession:


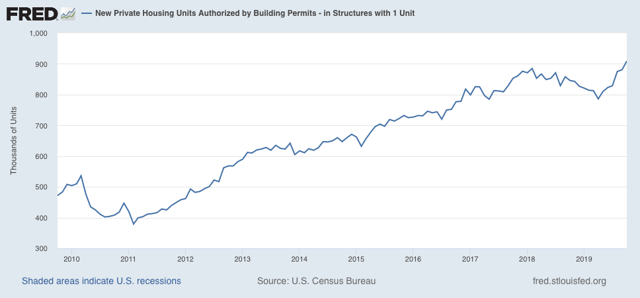
5.  Housing permits have rebounded sharply in recent months:


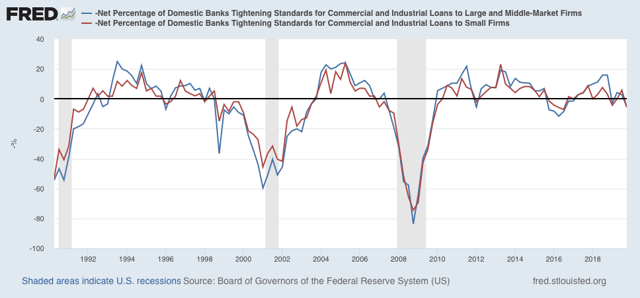
6.  Credit conditions are mixed. The Senior Loan Officer Survey has turned negative, although not by much:


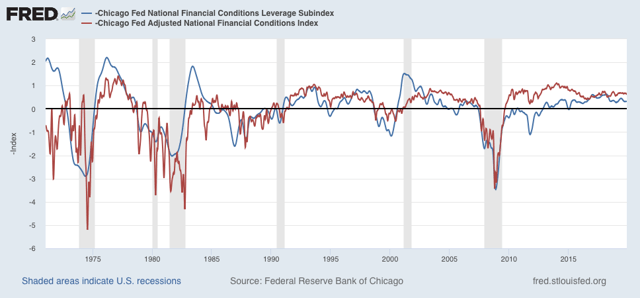
While the Chicago Adjusted National Financial Conditions Index remains positive:


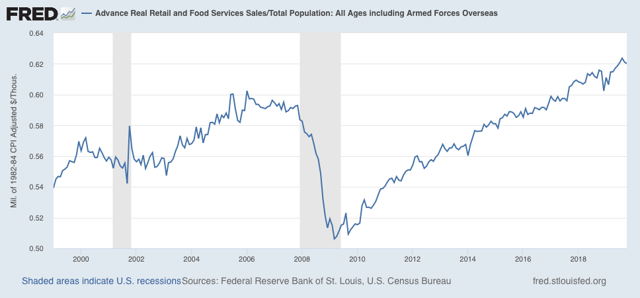
7.  Real retail sales per capita have been flat for a couple of months, but recently increased sharply and peaked in August:


To  summarize, three of the seven indicators are unequivocally positive: corporate bond yields, housing permits, and real money supply; three are mixed: the yield curve, credit conditions, and corporate profits (with the period of overlap among the negative iterations being limited to the 3rd Quarter); and one is negative, but only slightly compared with its recent 3rd Quarter peak: real retail sales per capita. 

So, while it is possible that a recession could be upon us in the 3rd or 4th Quarter of next year, if the economy is left to its own devices it is unlikely. (although Tarriff Man will do his best to undermine this). 

Obviously, this is an argument for an incumbent party popular vote victory. But there have been 10 cases where the economy has been in expansion and the incumbent party’s nominee still lost. One was the “jobless recovery” of 1992. Almost all the others have involved war (1952, 1968), civil discord or scandal (1968 again, 1976, 2000), or a disliked incumbent party candidate and/or a party split (1912, 1992, 2016).  

In short, the overall economic picture is a baseline. Non-economic factors having to do with the President’s personality or record do come into play as well (as will be explored by several other models). And it’s already quite clear that 2020 is going to include both civil discord and scandal.

Monday, December 2, 2019

December starts out with a thud


 - by New Deal democrat

The first reports in December are in, and both were negative.

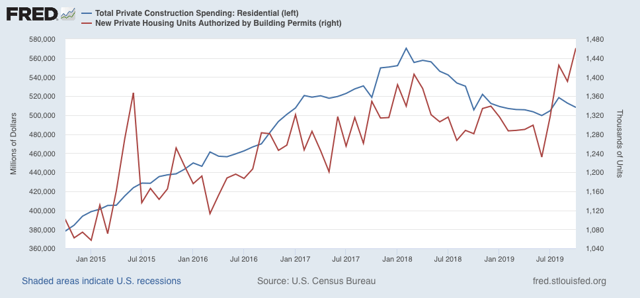
Let’s start with construction spending. Overall construction spending declined -0.8% in October. The more leading residential construction spending declined -0.9%, the second decline in a row (blue in the graph below):


Since actual spending on residential construction doesn’t take place until the house is started, it lags building permits (red in the graph above). So given the strong rebound in permits, I’m not concerned at this point about a renewed decline in construction, as I expect it will follow permits as well.

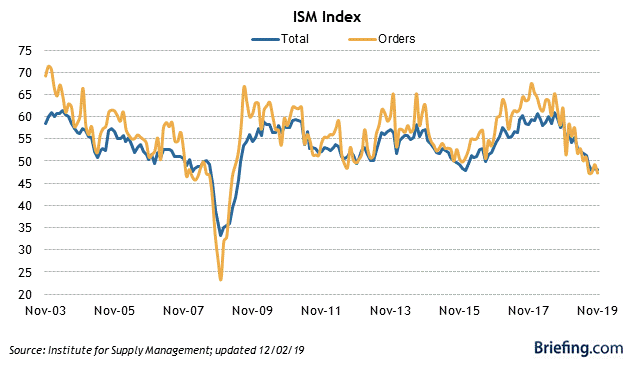
The same can’t be said for the second negative piece of news this morning, in the ISM manufacturing index. The overall index came in at 48.1, while the more leading new orders index came in at 47.2:


In the past it has typically taken at least two readings below 48 for the overall ISM manufacturing index to indicate recession, so the main indication here is that manufacturing may be in a shallow recession, but the economy as a whole is close to flat.

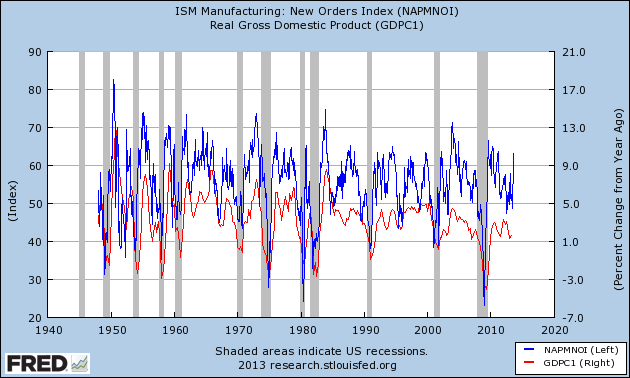
On the other hand, the new orders index is already at a level which has been consistent over the past 70 years with a recession in the very near future - although it is also consistent, as for example in 1966, with a slowdown only (note: ISM doesn’t allow FRED to publish its new data, so the below is a long term historical graph that ends in 2013):

Since the manufacturing sector in the economy is a smaller segment now than at any point since these series were started almost 75 years ago, the shallow  downturn there will have less repercussions than in the past.

A year ago I pointed to this quarter as being the epicenter of when I expected the downturn in the long leading indicators to have the most impact. That certainly appears to be the case. As the same time, I think the economy as a whole is more likely to remain in a slowdown than an outright contraction.